Research Article - Der Pharma Chemica ( 2018) Volume 10, Issue 1
Validation of a Newly Developed Stability Indicating RP-Liquid Chromatographic Method for the Quantitative Determination of Dapagliflozin
Sreenivasulu Sura1, Rameswara Rao Modalavalasa2* and ChandraSekhar B Kothapalli3
1Department of Chemistry, Research Scholar, Jawaharlal Nehru Technological University Anantapur, Ananthapuramu-515002, Andhra Pradesh, India
2Department of Quality Control, Chemical Technical Operations, Dr. Reddy’s Laboratories Ltd., IDA Bollaram, Hyderabad-502325, Telangana, India
3Department of Chemistry, Oil Technological & Pharmaceutical Research Institute, Jawaharlal Nehru Technological University Anantapur, Anantapuramu-515001, Andhra Pradesh, India
- Corresponding Author:
- Rameswara Rao Modalavalasa
Department of Quality Control, Chemical Technical Operations
Dr. Reddy’s Laboratories Ltd., IDA Bollaram, Hyderabad-502325, Telangana, India
Abstract
A novel simple, user friendly and stability representing high performance liquid chromatographic method for estimation of dapagliflozin in API and pharmaceutical forms was developed and validated. A Phenomenex Gemini-NX C18 Column (250 mm length, 4.6 mm diameter, 5 μm particle size) with a mobile phase containing of Methanol: Sodium 1-octanesulphonate in the proportion of 70:30 v/v was utilized for the chromatographic elution study. An injection volume of 20 μl with a flow rate of 1.0 ml/min was chosen for this investigation and the created technique was validated with various parameters like: Linearity, Limit of Detection (LOD), Limit of Quantification (LOQ), precision, accuracy, robustness and ruggedness. Dapagliflozin was eluted at 5.5 ± 0.5 min at wavelength 203 nm. The anticipated technique is linear in the range of 10-50 μg/ml and correlation co-effective (r2) got as 0.9994. The theoretical plates and peak tailing was discovered as 4229 and 1.03 respectively. The percentage accuracy in terms of recovery was accomplished in acceptable range of 98-102. The recently proposed, validated technique is distinct and reproducible for the normal investigation of dapagliflozin in bulk form. Proposed method stability was established by forced degradation studies of drug. In this examination the product was degraded under states of acidic hydrolysis and alkaline hydrolysis, oxidation, photolytic and thermal stress in light of the proposals of International Conference on Hormonization (ICH) Q2R1 Guidelines.
Keywords
Dapagliflozin, C18-Column, Methanol:Sodium 1-octanesulphonate (70:30), Specificity
Introduction
IUPAC name of Dapagliflozin is 2-(4-chloro-3-(4-ethoxybenzyl) phenyl)-6-(hydroxymethyl) tetrahydro-2H-pyran-3,4,5-triol (Figure 1). Dapagliflozin having a molecular formula C21H25ClO6 and molecular weight of 408.875 g/mol, appearance of the material is a white to off-white crystalline powder. Dapagliflozin is soluble in ethanol, Dimethyl Sulfoxide (DMSO) and Dimethyl Formamide (DMF). Dapagliflozin is an oral antidiabetic agent which belongs to a newly developed gliflozin class. Diabetes is a chronic condition that arises when either the pancreas does not produce the insulin or the body cannot make effective use of the insulin. Type-1 diabetes is an autoimmune disease that prevents pancreas from producing insulin, whereas type-2 diabetes is a metabolic disorder that occurs due to inability of the body to make use of the produced insulin. Dapagliflozin has an inhibitory action on Sodium-glucose Co-transporter 2 (SGLT2) [1] which is accountable for the glucose reabsorption (at least 90%) in the kidney. Hindering the transporter system causes blood glucose to be expelled through urine and accordingly increments urinary glucose discharge [2-6]. It received approval by United States of Food Drug Administration (USFDA) in January-2014 for treating the patients having type-2 diabetes.
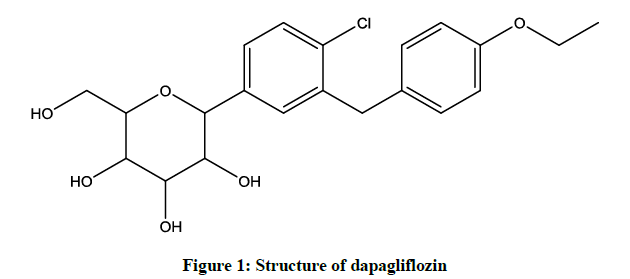
Figure 1: Structure of dapagliflozin
Anna et al. [7] Sreenivasa et al. [8] reviewed the analytical methods adopted for the determination of antidiabetic drugs. Nirali D Patel et al. [9] reviewed the analytical techniques for the estimation of gliflozin's. Not many analytical methods were accounted for dapagliflozin employing Ultra-Violet (UV) spectroscopic method [10-12], High Performance Liquid Chromatography (HPLC) methods using HPLC-Photo Diode Array (PDA) detector, acetonitrile and O-phosphoric acid [13-15], mixture of phosphate buffers, methanol and acetonitrile as mobile phase [16]. In present study ion pair buffers were used as mobile phase for the estimation of the dapagliflozin. The separation in reverse phase chromatography by using ion pair buffers is explained as consisting of two processes-an ion pair distribution process and exchange process.
The scope of the work is to develop and validate a HPLC technique for estimation of dapagliflozin in API and formulated dosage form with a sensible exactness, precision, economy and straightforwardness. The purpose of the investigation to show the capacity of the recently proposed method to measure the desired product response in occurrence of its degradation products. Above said technique was validated according to proposals of the International Conference on Harmonization (ICH) [17] for the assurance of dapagliflozin in bulk and formulated dosage forms.
Materials and Methods
Apparatus
Shimadzu LC-10AT (Shimadzu Corporation) HPLC system associated with VWD detector (UV-Visible) and Lab Solutions programming (Version) was utilized for the method development studies and validation. The Agilent 1100 series (Agilent Technologies Inc.,) HPLC framework associated with VWD indicator (UV-Visible) and Chemstation programming was utilized for ruggedness studies to demonstrate the outcomes are independent of system. pH adjustments were done utilizing Metrohm computerized pH meter (Reproducibility ± 0.01 pH), model 780. Analytical weighing of standards, test samples and chemicals were done utilizing Mettler Toledo XP6 micro analytical balance (Maximum limit of 6.1 g, sensitivity of ± 0.01 mg) and Sartorius BS/BT 2245 model analytical balance (Maximum limit of 220 g, sensitivity of ± 0.1 mg).
Chemicals and reagents
Dapagliflozin (API) gift sample was acquired from Aurobindo Pharma Limited, India. Chromatographic grade of sodium 1-octansulphonate was procured from SD-Fines Chemicals Ltd. India. A.R grade O-phosphoric acid, chromatographic grade Methanol and Water were procured from Rankem Limited, India. dapagliflozin market samples of forxiga 10 mg tablets were mercifully supplied by Astra Zeneca India.
Chromatographic conditions
The chromatographic column utilized for the elution of focused analyte was Phenomenex Gemini-NX C18 Column (250 mm length × 4.6 mm diameter × 5 μ particle size). The mobile phase made out of 30% sodium octane sulphonate buffer (0.005 M, pH=3.0) and 70% methanol (v/v). Prepared mobile phase was filtered by utilizing a 0.45 μ millipore film paper under vacuum filtration and pumped at room temperature, utilizing a variable wave length (UV) detector at wavelength 203 nm and with a flow rate of 1.0 ml/min.
Chromatographic parameters
Equipment: Shimadzu LC-10A Tvp series HPLC system with VWD, Column: Phenomenex Gemini-NX C18 LC-Column, (250 mm length × 4.6 mm diameter × 5 μ particle size), Flow rate: 1.0 ml/min, Wavelength: 203 nm, Injection volume: 20 μl, Column oven temperature: Room temperature, Run time: 10 min.
Solutions and sample preparation
Preparation of buffer
Dissolved 5.88 g of sodium 1-octane sulphonate in 500 ml of HPLC grade water to get 0.005 M octane sulphonate solution and pH of the solution was adjusted to pH=3.0 with 1.0 N O-phosphoric acid. The buffer solution was filtered through 0.45 μ millipore film paper to wipe out fine particles and gasses.
Preparation of mobile phase
Mobile phase made ready by mixing of octane sulphonate buffer and HPLC grade methanol in 30:70 proportion (v/v) and filtered through 0.45 μ millipore film paper and degassed by sonication.
Preparation of diluents
Directly, methanol used as diluent.
Preparation of standard stock solution (1000 μg/ml)
50 mg of dapagliflozin was transferred into a 50 ml dry and clean volumetric flask containing 20 ml Methanol. Solution sonicated for 8 min to dissolve, diluted to volume with methanol and filtered using 0.45 μ millipore film paper to get 1000 μg/ml of standard stock solution.
Preparation of standard working solution for assay (100 μg/ml)
1.0 ml of 1000 μg/ml standard stock solution was further diluted to 10 ml with methanol to get 100 μg/ml working solution. All other further dilutions for method development and validation study were carried out by utilizing the working solution (i.e., 100 μg/ml dapagliflozin) to get 10, 20, 30, 40 and 50 μg/ml of targeted concentrations.
Preparation of sample solutions
Equal to 100 mg dapagliflozin finely grinded tablet powder was taken in 100 ml dry and clean volumetric flask containing 40 ml of diluent, sonicated for 8 min and made up to volume with methanol. Contents in the flask were filtered through 0.45 μ millipore film paper. To get 40 μg/ml concentration sample solution, 400 μl of the above dapagliflozin sample stock solution was pipetted into a 10 ml volumetric flask and made up to the mark with methanol.
Procedure
Injected 20 μl of each solution (viz: Blank, standard solution and sample solution) into the chromatographic system. Peak areas were considered for dapagliflozin and the % assay was ascertained by comparing the principle peak areas of standard and sample, acquired from the individual chromatograms utilizing underneath formula.
Where, AT=Mean peak area of principle peak from test or sample chromatogram, AS=Mean peak area of principle peak from standard chromatogram, WS=Amount of the standard (mg), WT=Amount of the Test or sample (mg), P=% purity of the standard, DS=Dilution factor of standard preparation, DT=Dilution factor of sample preparation.
Force degradation studies
“Development of validated stability-indicating assay methods” were reviewed by Bakshi et al. [18] and Blessy et al. [19]. Stress studies were conducted as directed in ICH [17] to assess the stability showing property of the developed HPLC technique. Forced degradation investigations of dapagliflozin were conducted by exposure the API sample to acidic and basic hydrolysis, oxidative, photolytic, and thermal conditions. The reason for the investigation is to decide the capacity of the proposed method to figure out the analyte response in presence of its degradation products.
Acid and alkali hydrolysis
9.0 ml of 0.1 N hydrochloric acid/sodium hydroxide was transferred into a round bottom flask containing 1.0 ml of dapagliflozin aliquot solution (1000 μg/ml). Above prepared solutions were stored at 35°C for 48 h. The solutions were cooled to 25°C, neutralized by adding an equivalent measure of base or acid. Further diluted using methanol and filtered through a 0.45 μm membrane filter.
Oxidation
9.0 ml of 30% hydrogen peroxide solution was transferred into a round bottom flask contacting 1.0 ml of dapagliflozin solution (1000 μg/ml) and the reaction mixture was kept at 35°C with occasional shaking for 48 h. The samples were cooled to 25°C. Further diluted using methanol and filtered through a 0.45 μm membrane filter.
Irradiation with UV light
Dapagliflozin sample was treated for 48 h to UV light (Wavelength=365 nm). The treated sample was dissolved in methanol and diluted to 10 ml methanol. Resultant sample solution was appropriately diluted with methanol and filtered through a 0.45 μm membrane filter.
Thermal degradation
Dapagliflozin sample was treated for 48 h at 70°C using a refluxing condenser. The treated sample was appropriately diluted with methanol and filtered through a 0.45 μm membrane filter.
Results and Discussion
Method development
Various proportions of water and methanol were tried as mobile phase to develop a simple reverse phase liquid chromatography method. Mobile phase pH was a basic factor to decrease the tailing factor and to enhance the peak shape. Enriched peak shape and elution was attained at pH=3.0 with sodium octane sulphanate buffer. Thereafter, sodium octane sulphanate buffer and methanol were taken in isocratic ratio (30:70 v/v) with a flow rate of 1.0 ml/min. Phenomenex Gemini-NX C18 Column 250 mm length × 4.6 mm diameter × 5 μ particle size was chosen as the stationary phase to improve elution and lesser tailing of the peak was achieved. UV spectrum of dapagliflozin indicated maximum absorption at wavelength 203 nm. Therefore, 203 nm was kept constant as the detection wavelength throughout the investigation. The main peak RT was 5.5 ± 0.5 min with tailing factor and plate count as 1.03 and 4229 respectively. The chromatograms for blank, dapagliflozin standard solution and test sample were shown in Figures 2-4 respectively.
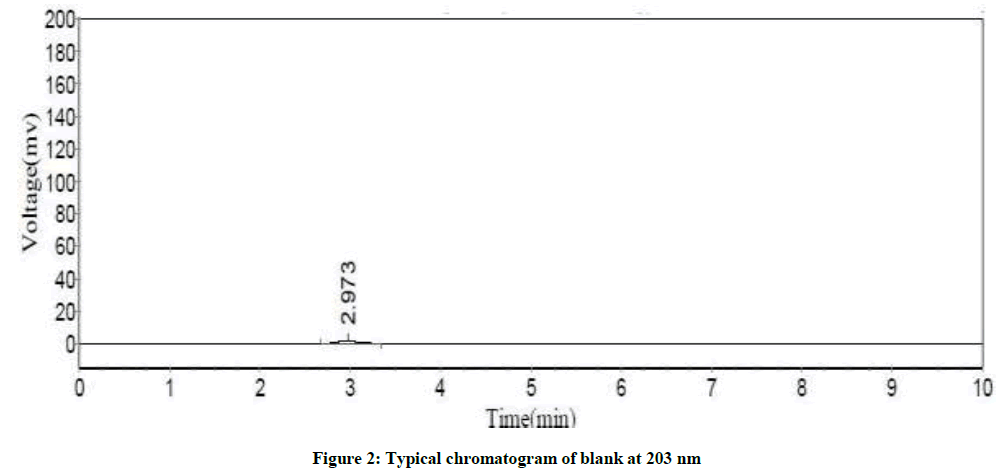
Figure 2: Typical chromatogram of blank at 203 nm
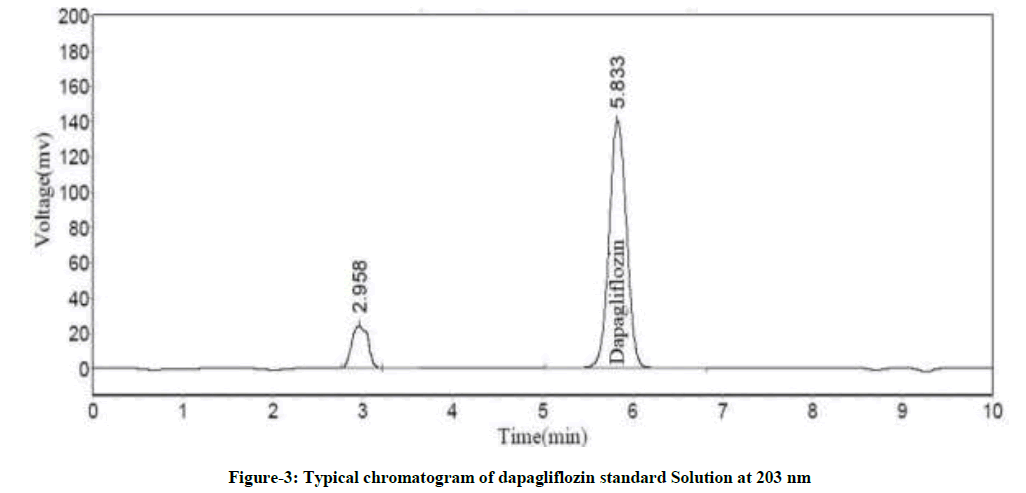
Figure 3: Typical chromatogram of dapagliflozin standard Solution at 203 nm
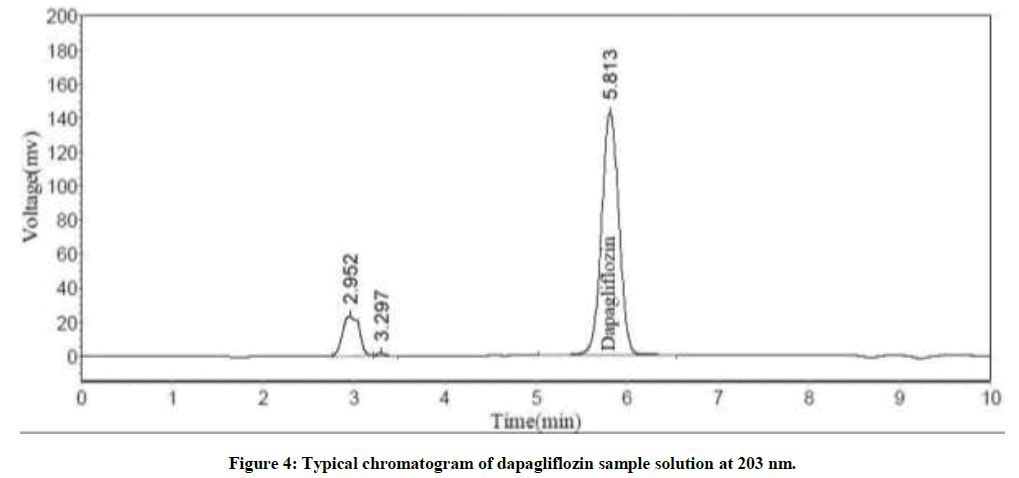
Figure 4: Typical chromatogram of dapagliflozin sample solution at 203 nm.
Analytical method validation
Analytical method validation of the developed method was studied by different parameters like system suitability, precision, ruggedness, Limit of Detection (LOD), Limit of Quantification (LOQ), linearity, accuracy and robustness [20,21] as per ICHQ2A and Q2B guidelines (“Validation of Analytical Procedures: Text and Methodology Q2(R1)”, Geneva, 2005) [17].
System suitability
High performance liquid chromatographic system was alleviated according to the chromatographic settings. After attaining the steady base line, to verify the system suitability, a single 40 μg/ml of standard solution proportional to 100% test concentration of dapagliflozin was injected into the HPLC system. The system suitability parameters (Retention Time (Rt), capacity factor, theoretical plates and peak tailing factor) were taken to establish the suitability for the planned method and the acquired outcomes were tabularised in Table 1.
| Parameter (n=6) | System suitability results |
|---|---|
| Retention Time (Rt) (min) | 5.5 ± 0.5 |
| Capacity factor (k) | 6.7 |
| Theoretical plates (N) | 4229 |
| Peak tailing factor | 1.03 |
Table 1: System suitability parameters for dapagliflozin
Precision
Precision is the assessment of the confidence of the obtained results in a sequence of estimations of a multiple injections of a similar specimen. Precision of the established method is considered by computing % relative standard deviation of six replicates of a single calibration standard solution (40 μg/ml). The precision and intermediate precision were calculated by measuring the resultant responses of principle peak on the same day and on another day for same solution concentration. The obtained results are tabularized (Table 2) in terms of Percentage Relative Standard Deviation (%RSD) of RT, peak area and height.
| Parameter | Intra day 1st day, 1st system, 1st column and 1st analyst |
Inter day 2nd day, 2nd system, 2nd column and 2nd analyst |
|---|---|---|
| Capacity factor (k) | 6.7 | 6.7 |
| Theoretical plates (N) | 4229 | 3845 |
| Peak tailing factor | 1.03 | 0.98 |
| %RSD of Retention Time (Rt) (min) (n=6) | 0.21 | 0.82 |
| %RSD of area (n=6) | 0.76 | 0.90 |
| %RSD of height (n=6) | 0.69 | 0.73 |
Table 2: Precision data of intraday and inter-day for dapagliflozin
Linearity
Linearity is the capability of analytical method to present a response which is proportional to the sample concentration, inside a particular range [20-23]. With a specific end goal to decide the Linearity (L) of the projected method, 20 μl of each 10, 20, 30, 40 and 50 μg/ml calibration standard solutions were prepared as specified previously and injected into chromatograph. Recorded the chromatograms at wavelength 203 nm. The overlay correlation chromatograms of various concentrations (10-50 μg/ml) of dapagliflozin was displayed in Figure 5. In order to construct the calibration curve the averages of the concentrations and the peak response obtained were utilized as appeared in Figure 6. The method is considered linear. A straight line with coefficient of assurance (r2) equivalent to 0.9996 was acquired. Residual plot attained for Dapagliflozin was charted in Figure 7. Analysis of Variance (ANOVA) data obtained from linearity were tabularised in Table 3.
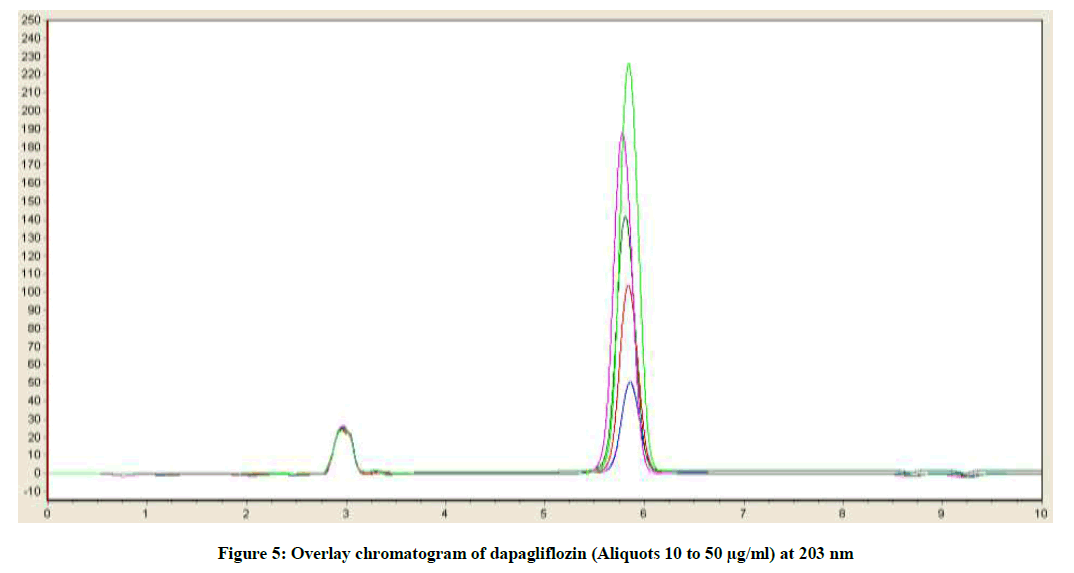
Figure 5: Overlay chromatogram of dapagliflozin (Aliquots 10 to 50 μg/ml) at 203 nm
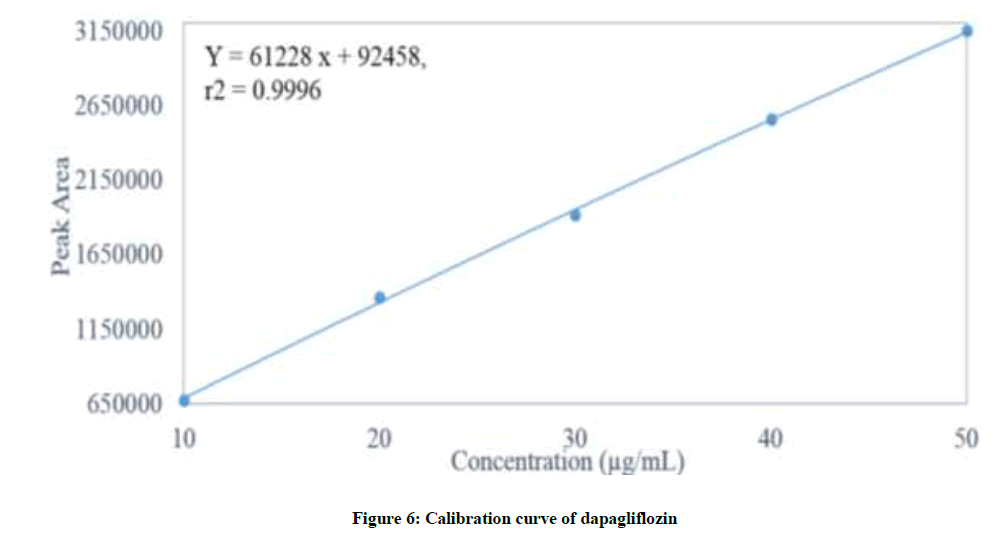
Figure 6: Calibration curve of dapagliflozin
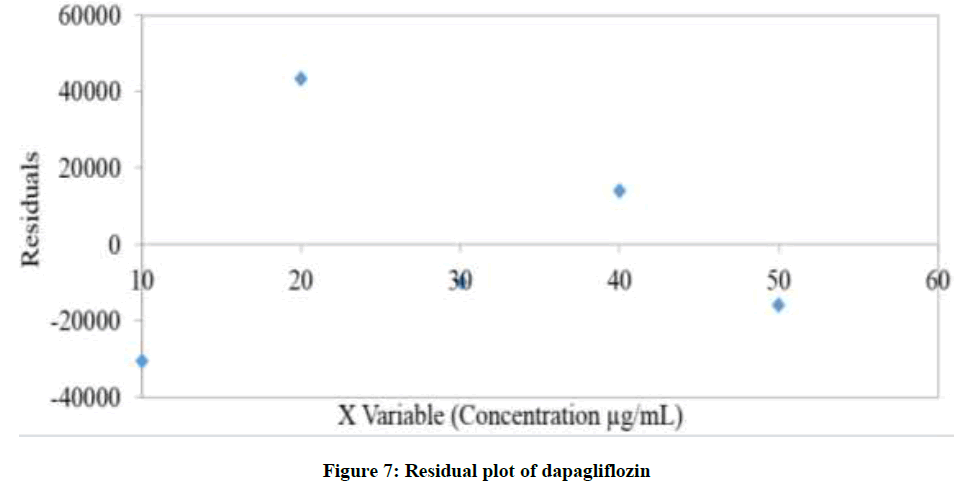
Figure 7: Residual plot of dapagliflozin
| Statistical parameter | Results |
|---|---|
| Slope | 61228 |
| Intercept | 92458 |
| Correlation coefficient | 0.9996 |
| Regression sum of squares | 3748816245294 |
| Residual sum of squares | 3369605374 |
| Total sum of squares | 3752185850668 |
Table 3: Analysis of variance (ANOVA) and linearity data of dapagliflozin
Accuracy or (%Recovery)
Accuracy is the proximity of the acquired outcomes to the true value. The solutions prepared proportional to 80%, 100% and 120% (by considering 40 μg/ml as 100%) reference solution concentration were estimated for the concentration obtained and theoretical as well as the average of the three different concentrations. From the outcomes tabulated in Table 4, it was verified that the variation of the individual recovery was of 100.8% to 101.4% and the mean of the recoveries was of 101.11%. These values are considered satisfactory. The %RSD obtained for dapagliflozin was 0.22, which is within acceptance limit of ≤ 2. Hence, the established technique is accurate.
| Sample name | Amount of drug concentration (µg/ml) | % Recovery | |
|---|---|---|---|
| Spiked | Found | ||
| S1: 80% | 32 | 32.28 | 100.86 |
| S2: 80% | 32 | 32.27 | 100.84 |
| S3: 80% | 32 | 32.27 | 100.86 |
| S4: 100% | 40 | 40.51 | 101.27 |
| S5: 100% | 40 | 40.56 | 101.39 |
| S6: 100% | 40 | 40.53 | 101.34 |
| S7: 120% | 48 | 48.55 | 101.15 |
| S8: 120% | 48 | 48.57 | 101.19 |
| S9: 120% | 48 | 48.56 | 101.16 |
| Mean | 101.11 | ||
| Std. Deviation | 0.23 | ||
| %RSD | 0.22 | ||
Table 4: Recovery study data of dapagliflozin
Robustness
The robustness studies were conducted to measure the ability of the projected method to remain unpretentious by small but measured deviations in method parameters, by changing the flow rate, pH and column oven temperature and composition of the mobile phase within permissible limits from established chromatographic conditions. The acquired results (Table 5) illustrates that there were no obvious change in mean Rt and %RSD obtained for assay results is inside agreeable criteria (%RSD=≤ 2). The plate count and peak tailing were found to be in tolerable limits of >2500 and <2.5 respectively. Hence, the projected method is steady with deviations in the analytical circumstances and the results of dapagliflozin are outlined in Table 5.
| Parameter | Analytical condition | |||||||
|---|---|---|---|---|---|---|---|---|
| Flow rate (ml/min) | Effect of pH | Column temperature ( ?C) | Mobile phase composition (%) | |||||
| 0.98 | 1.02 | 3.4 | 3.6 | 22 | 33 | -10% | + 10% | |
| Mean RT* | 5.87 | 5.07 | 5.94 | 5.90 | 5.86 | 5.73 | 5.91 | 5.73 |
| Std. Dev of Area* | 0.85 | 1.63 | 0.79 | 0.38 | 0.00 | 0.00 | 0.89 | 0.51 |
| %RSD of Area* | 0.96 | 1.90 | 0.92 | 0.44 | 0.00 | 0.00 | 1.01 | 0.59 |
| Peak tailing | 1.00 | 0.98 | 1.03 | 1.03 | 1.03 | 1.02 | 1.03 | 1.00 |
| Plate count | 4083 | 4307 | 3537 | 4259 | 4123 | 4062 | 4375 | 3983 |
Table 5: Results of robustness for dapagliflozin
Stability of mobile phase, standard and sample solution
Stability of solutions such as mobile phase, standard solution and test solution were studied for 48 h. The above solutions were injected at time interims 0 h (initial time), 24 h and 48 h by storing at 25°C. Solutions were prepared as defined in the proposed method and stored in well-closed containers. Injected into chromatographic system and calculated the system suitability test parameters on each day and the results were compared in Table 6. The %RSD results are within tolerable limit of ≤ 2. Hence, the mobile phase, standard stock and sample solutions are steady for 48 h at 25°C.
| System suitability parameter | Results | ||
|---|---|---|---|
| Initial (0 h) | 24 h | 48 h | |
| %RSD of area (n=3) | 0.84 | 1.02 | 1.05 |
| Pale count | 3845 | 4420 | 4076 |
| Peak tailing factor | 0.98 | 1.04 | 1.03 |
Table 6: Solution stability results for dapagliflozin
Limit of detection (LOD) and limit of quantification (LOQ)
Limit of detection (LOD) and limit of quantification (LOQ) were calculated based on the ICH guidelines as below:
Where, S=Slope derived from the calibration curve, SD=Standard deviation of the response. The LOD is the lowest concentration of the analyte that gives a determinate response. The LOQ is the lowest concentration of the analyte which provides response that could be exactly computed. The LOD and LOQ were computed as 0.001 μg/ml and 0.009 μg/ml respectively. Lowest values for LOD and LOQ were obtained by using the projected method, which specifies that the method is sensitive.
Tablet analysis
The amount of dapagliflozin in the forxiga 10 mg tablets was quantified by the newly proposed method. RSD results 0.29% is within acceptance limit of ≤ 2% and the results were tabularised in Table 7.
| Name of the formulation | Label claim | Amount quantified (mg) (n=3) | %RSD |
|---|---|---|---|
| Forxiga | 10 mg | 10.1 mg | 0.29 |
Table 7: Tablet analysis results of dapagliflozin
Specificity
Specificity studies reveals that the degradation was detected, in case of acid hydrolysis, base hydrolysis, oxidation, irradiation with UV light and thermal conditions, as shown in the respective chromatograms (Figures 8-12). The %degradation was calculated to evaluate the stability of dapagliflozin drug product under various stress conditions. Percentage degradation was computed by relating the peak area of untreated or unexposed sample area and treated or exposed sample peak area by utilizing the given formula:
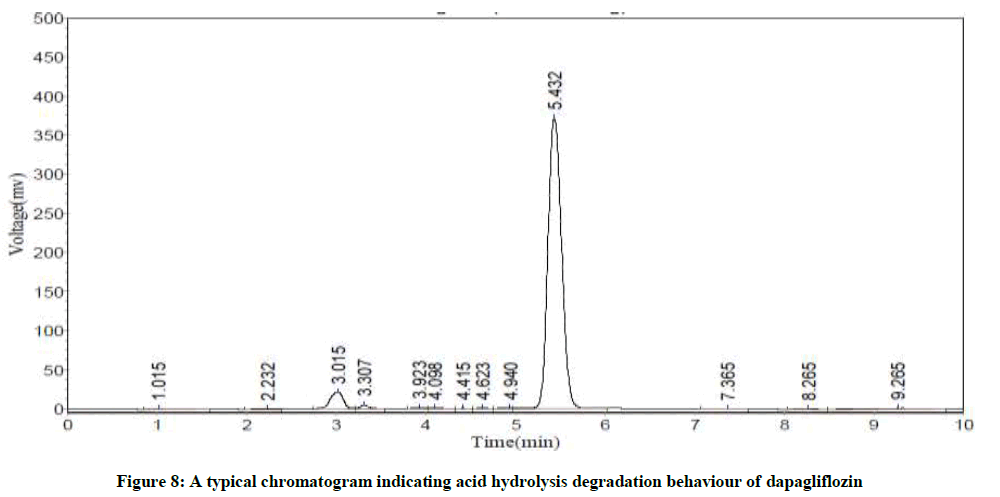
Figure 8: A typical chromatogram indicating acid hydrolysis degradation behaviour of dapagliflozin
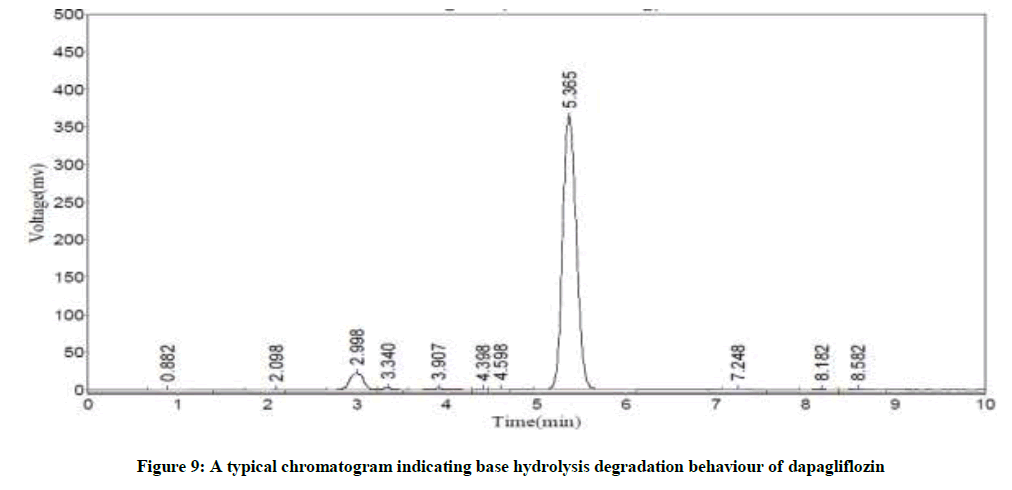
Figure 9: A typical chromatogram indicating base hydrolysis degradation behaviour of dapagliflozin
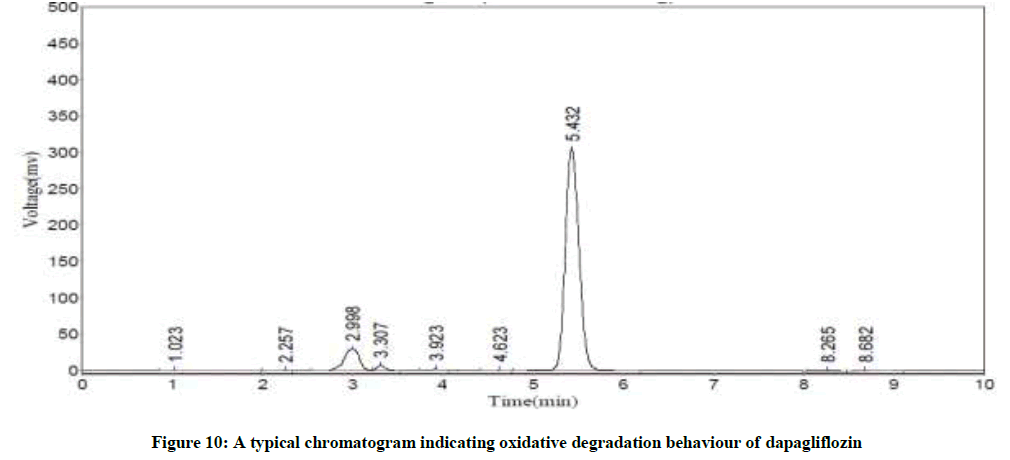
Figure 10: A typical chromatogram indicating oxidative degradation behaviour of dapagliflozin
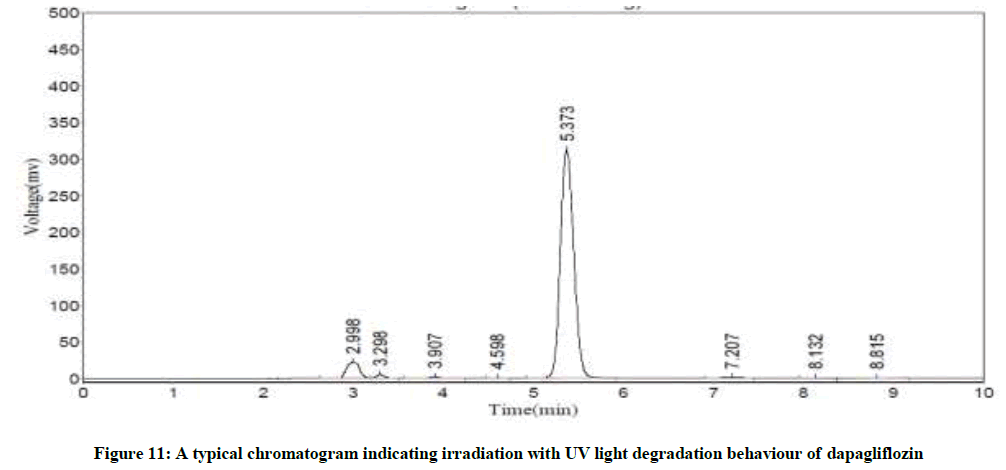
Figure 11: A typical chromatogram indicating irradiation with UV light degradation behaviour of dapagliflozin
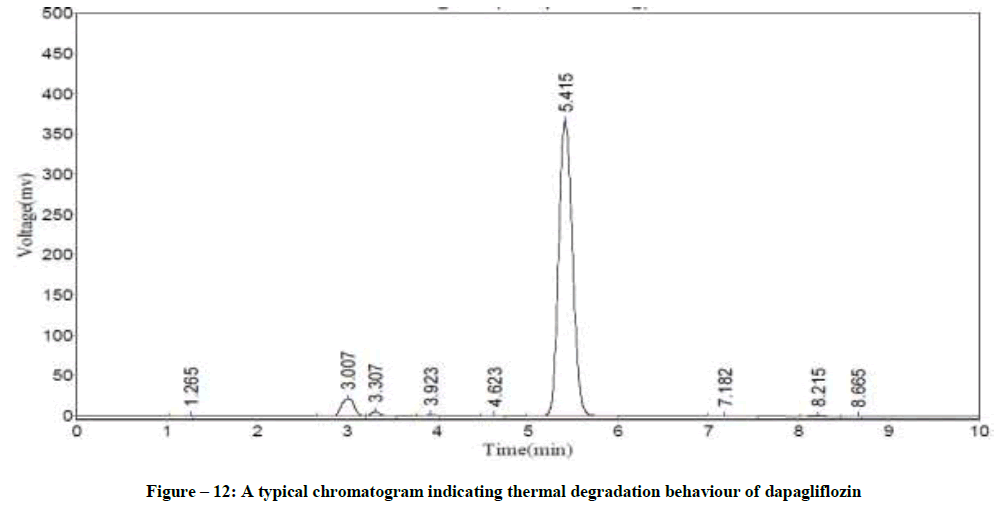
Figure 12: A typical chromatogram indicating thermal degradation behaviour of dapagliflozin
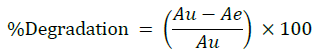
Where, Au=Peak area of untreated/unexposed stock solution, Ae=Peak area of treated/exposed stock solution.
The Retention Time (Rt) and the % of degradation of the dapagliflozin were tabularised in Table 8. The method was capable to completely separate the dapagliflozin from the intact of its degradation products. However, the results of specificity studies discloses that, the projected method has an extraordinary degree of specificity due to its ability to isolate the degradation products from principle peak of analyte.
| Parameters | Retention time (min) | Degradation (%) |
|---|---|---|
| Acid hydrolysis | 5.43 | 1.7 |
| Base hydrolysis | 5.37 | 1.2 |
| Oxidation | 5.41 | 18.1 |
| Treatment with UV light | 5.37 | 17.9 |
| Thermal degradation | 5.42 | 2.7 |
Table 8: Dapagliflozin forced degradation results summary
Conclusion
The proposed new method for the quantification of dapagliflozin using Phenomenex Gemini-NX C18 Column & HPLC with variable wavelength detector (UV) was established and validated in light of the ICH rules. The proposed method is linear in the concentration range of 10 to 50 μg/ml, by means of the correlation co-efficient (r2=0.9996). The %RSD obtained was within the acceptance criteria (RSD<2). The accuracy in terms of %recovery was attained in 98-102% range, which was again inside as far as possible. The robustness was studied to measure the consistency during regular usage. The ease and shorter run time i.e., 10 min, empowers speedier investigation of dapagliflozin. The mobile phase, standard and sample solutions are observed to be steady at 25°C upto 48 h. The method was demonstrated as accurate, precise, robust and specific as the extra peaks aroused during the specificity studies did not influence the principle peak quantification. At the same time the chromatographic elution step is embraced in a brief timeframe (10 min). Hence, the newly established and validated method can be utilized for the routine and stability analysis.
Acknowledgement
Authors of this research article are grateful to DR Biosciences, Bengaluru, Karnataka State, India, for providing the facilities to complete the research work.
References
- P.S. Harsharan, K. Ishpreet, S. Gunjan, Int. J. Pharm. Sci. Rev. Res., 2015, 33(1), 40-47.
- J.J. Neumiller, J.R. White, R.K. Campbell, Drugs., 2010, 70(4), 377-385.
- S. Elkinson, L.J. Scott, Drugs., 2013, 73, 979-988.
- C.J. Bailey, Trends Pharmacol. Sci., 2011, 32(2), 63-71.
- S.L. Anderson, J.C. Marrs, Ann. Pharmacother., 2012, 46(4), 590-598.
- L. An-Rong, J. Zhang, J. Greenberg, T. Lee, J. Liu, Bioorg. Med. Chem. Lett., 2011, 21(8), 2472-2475.
- G. Anna, B. Anna, Open. Chem., 2016, 14, 215-242.
- C.A. Sreenivasa, C.H. Sridhar, K.B. Chandrasekhar, J. Comprehen. Pharm., 2016, 3(3), 70-82.
- N.D. Patel, D.B. Shah, D.G. Maheshwari, J. Global. Trends. Pharm. Sci., 2015, 6(4), 2920-2924.
- B.R. Jani, K.V. Shah, P.P. Kapupara, Int. J. Res. Dev. Pharm. Life. Sci., 2015, 4(3), 1569-1576.
- B.R. Jani, K.V. Shah, P.P. Kapupara, J. Bioequival. Stud., 2015, 1(1), 1-8.
- S. Manasa, K. Dhanalakshmi, G. Nagarjuna Reddy, S. Sreenivasa, Int. J. Pharm. Sci. Drug Res., 2014, 6(3), 250-252.
- S. Manasa, K. Dhanalakshmi, G. Nagarjuna Reddy, S. Sreenivasa, Int. J. Pharm. Sci. Drug Res., 2014, 5(12), 5394-5397.
- S. Manasa, K. Dhanalakshmi, G. Nagarjuna Reddy, S. Sreenivasa, J. Adv. Pharm. Edu. Res., 2014, 4(3), 350-353.
- J. Khyati Patel, B. Ankit Chaudhary, M. Shweta Bhadani, J. Ruchi Raval, World. J. Pharm. Pharm. Sci., 2017, 6(9), 796-809.
- Shyamala, B. Nidhi, M. Kavitha, Pooja, J.V.C. Sharma, Am. J. Biol. Pharm. Res., 2015, 2(2), 109-113.
- International Conference on Harmonization Q2(R1), November, Validation of Analytical Procedures: Text and Methodology, Geneva, 2005, 1-13.
- M. Bakshi, S. Singh, J. Pharm. Biomed. Anal., 2002, 28(6), 1011-1040.
- M. Blessy, D. Ruchi Patel, N. Prajesh Prajapati, Y.K. Agrawal, J. Pharm. Anal., 2014, 4(3), 159-165.
- G.A. Shabir, J. Chromatogr. A., 2003, 987(1), 57-66.
- J.M. Miller, J.B. Crowther, Analytical chemistry in a GMP Environment, 2000, 435.
- B. Mallikarjuna Rao, S. Sivaiah, M.K. Srinivasu, P. Madhavan, M. Lalitha Devi, P. Rajendra Kumar, K.B. Chandrasekhar, C.H. Arpithad, T. Satya Balaji, J. Pharm. Biomed. Anal., 2006, 41(4), 1146-1151.
- S. Sreenivasulu, M. Rameswara Rao, K.B. Chandrasekhar, World. J. Pharm. Pharm. Sci., 2017, 6(2), 1119-1132.