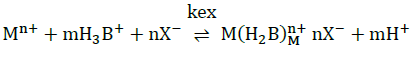
Research Article - Der Pharma Chemica ( 2018) Volume 10, Issue 1
2,2'-{1,2-Ethanediylbis[nitrilo(E)methylylidene]}diphenol Nickel(II) Complex: Optimization, Synthesis, Characterization, Antimicrobial, Thermal and Thermodynamic Stability
IKenna NF, Sunday NF* and Wilberforce O
Department of Industrial Chemistry, Ebonyi State University, PMB 053 Abakaliki, Ebonyi State, Nigeria
- Corresponding Author:
- Sunday NF
Department of Industrial Chemistry
Ebonyi State University, PMB 053 Abakaliki
Ebonyi State, Nigeria
Abstract
There has been increased resistance of antimicrobial drugs to common bacterial ailments thereby making the treatment of such ailments laborious, time consuming and unnecessarily costly. In this study the suitability of 2,2'-{1,2-Ethanediylbis[nitrilo(E)methylylidene]}diphenol nickel(II) metal complex was examined as a potential antimicrobial agent. Solvent extraction method combined with response surface methodology modeling approach was applied in preparing the Ni(II) complex. The ligand and the prepared complex were characterized using UV-Visible, Fourier Transform Infra-Red (FTIR), magnetic susceptibility, Differential Scanning Calorimetry (DSC), Gas Chromatography-Mas Spectroscopy (GC-MS), Proton Nuclear Magnetic Resonance (1H-NMR) and Carbon-13 Nuclear Magnetic Resonance (13C-NMR). The spectra data revealed that the orange coloured complex is diamagnetic, square planar and of 1:1 stoichiometry. Box-Behnken design a response surface methodology approach based on five factors three variables revealed that there is no significant difference between the experimental and predicted result at 95% confidence limit. In vitro antimicrobial activity of 2,2'-{1,2Ethanediylbis[nitrilo(E)methylylidene]}diphenol (H2EBNMD) and the complex was evaluated and based on the result, Ni(II)- H2EBNMD in HCl and Ni(II)-H2EBNMD in HNO3 has higher activity indices of 90.90 and 72.72% respectively at concentration of 10-3 M. Solution chemistry of complex formation indicated that the process is spontaneously feasible, endothermic, involved solvation process, follows pseudo-second order kinetic model and obeys Langmuir (R2=0.9637) and Freundlich (R2=0.9995) kinetic models. Based on the results, a novel synthetic protocol of important industrial design for the complex Ni(II)-H2EBNMD has been developed and the complex been biochemically active is recommended for the treatment of infections due to common clinically important micro-organisms such as Klebsiella sp., Escherichia coli, Pseudomonas sp. and Staphylococcus aureus.
Keywords
H2EBNMD, Optimization, Thermal and thermodynamic stability, Antimicrobial studies
Introduction
Many consumer and commercial products such as magnets, rechargeable batteries, stainless batteries and alloys are made from nickel. Even though the toxicity of nickel is low but high accumulation either through natural or anthropogenic sources has deleterious effect on human and aquatic organisms [1]. Therefore to remove nickel from the environment and convert it into more useful forms which will not be lethal to humans and will be applied in various industrial products, it is important to be complexed with ligands that will provide such intrinsic qualities. Historically, metals and metal complexes have helped immensely in medicine especially in the area of chemotherapy and pharmaceutical formulations. Metals, especially those of the d-block elements and their complexes exhibit notable antimicrobial, cytotoxic, photochemical and chemotherapeutic properties incriminating them as antimicrobial agents [2]. Increased research interest has been on the field of biological and inorganic chemistry and notably on the area of Schiff bases and their metal complexes probably because they serve as excellent biological models [3]. Even though increasing demand for antimicrobial drugs owing to detected resistance of common antimicrobial drugs such as ampicillin, amoxicillin and ciprofloxacin in the prevention and treatment of diseases has been on the rise, the area of metal complexes as potential substitute has been under researched.
The free energy (ΔG°(T)) an overall contribution of the enthalpic and entropic terms determines the stability of a substance and other temperature dependent parameters such as enthalpy, entropy and heat capacity changes are determined using the calorimetric method (DSC) or Van`t Hoff method. The denaturation enthalpy of metal complexes indicate the stability and when degradation occurred within narrow temperature range, the transition is said to be highly co-operative [4-6]. DSC is very germane in studying the stability of biochemical substances such as drugs.
Response Surface Methodology (RSM) a multivariate tool is available as software and applied to optimize different processes [7]. The technique is primarily concerned with the response surface that is influenced by various variables. Response surface methodology is very important in designing the interaction between two or more responses and a number of process variables as well as combination of factors levels that will generate optimum expected yield or quantity. Among the common multivariate techniques, Box-Behnken has been noted to be more advantageous because it includes estimation of the factors of the quadratic model, involves building of the model and more efficient [8]. The optimization of process conditions for nickel(II) 2,2'-{1,2-Ethanediylbis[nitrilo(E)methylylidene]}diphenol complex synthesis for mass production, characterization and in vitro antimicrobial evaluation thereof with thermal analysis forms the cruz of this research.
Materials and Methods
Materials
All the reagents were prepared in distilled water, working solution made by dilution and used without further treatment and or purification. Salicylaldehyde, ethylenediamine, chloroform, carbon tetrachloride of analytical grade were obtained from Merck Standard solutions of Ni(II) was prepared using NiSO4.7H2O (Merck, annular grade) while solutions of acids (HCl, HNO3 HClO4 and H2SO4) were made by diluting the concentrated acids and appropriate standard bases used to stabilize them.
Methods and instrumentation
The following instruments were used to obtain spectral and analytical data of the ligand and complexes. UV-visible (Genesis 10S UV-Visible Spectrophotometer), Fourier Transform Infra-Red (FTIR)-KBr pellets (Perkin-Elmer FTIR-8400S, Shimadzu, Japan), Mass spectra (GCMSQ2010 Plus Shimadzu, Japan, coupled with gas chromatograph). Differential Scanning Calorimetry (DSC) analysis (Thermal degradation pattern) (NETZSCHDTA 404PC Differential scanning calorimeter), Proton Nuclear Magnetic Resonance (1H-NMR) and Carbon-13 Nuclear Magnetic Resonance (13C-NMR) spectra, Tetramethylsilane (TMS) as reference (Bruker Avance II 400 MHz NMR spectrometers). Elemental analyses (Vario-Elemental Microcube ELIII), Magnetic susceptibility with diamagnetic corrections calculated using Paschals constant (Jonhson Matthey magnetic susceptibility balance Alfa product, Model No. MKI) and optimization studies (Design Expert software version-8.0.7.1, Statease Inc., USA, 2011).
Experimental design
Optimizing the reaction conditions for maximum production of the Ni(II)-metal complex was effected using Box-Behnken design a response surface methodology approach. The reaction variables as listed in Table 1 represents the independent variables to maximize the amount of Ni(II) formed. Single factorial text with range of values of extraction variables was subjected to optimization according to Box-Behnken design using Design Expert software version 8.0.7.1 (Stat-ease Inc., USA, 2011). 46 experiments constituting five variables at three levels (-1, 0, +1) with three runs at central point and mean value taken in each duplicate experiment as designed according to Box-Behnken design was employed. The interaction between the reaction conditions is shown by second order polynomial equation (Equation 1) generated from the design expert software:
| Coded values | -1.000 | 0.000 | +1.000 |
|---|---|---|---|
| A (Seconds) | 1.00 | 8.00 | 15.00 |
| B (M) | 0.50 | 0.25 | 0.0001 |
| C (°C) | 20.00 | 30.00 | 40.00 |
| D (µg) | 5.00 | 12.50 | 20.00 |
| E (%) | 0.05 | 0.525 | 1.00 |
Table 1: Levels for response surface methodology of the variables and experimental design (Coded and un-coded form)
 (1)
(1)
The variables, h, mo, mi, mii and mij in equation 2 stands for the quantity of Ni(II) complex formed and extracted and regression coefficient for intercept, linearity, square and interaction respectively. Also, XiXj and Σ are the coded process variables and the random errors respectively. While using mean of 3 replicate determinations, the significance and model fitness were checked from regression coefficient R2 and F-test and P-value determination. Analysis of Variance (ANOVA) was employed in evaluating the reaction variables interactions with model fitting to get optimum conditions on a 95% confidence level fixed probability [8].
Optimization studies
The optimization process using response surface methodology (Box-Behnken design) applied batch equilibration method. 1.0 ml of 2-10-4 M acid concentration in different 20 ml extraction bottles were each added 100 μg of Ni(II) solution. Consequently, 0.2 ml of H2EBNMD solution was added, volume made up to 5 ml with acid solution and 5 ml chloroform added. The phase was agitated at 500 rpm in a rotary shaker, allowed to settle, centrifuged and separated and the amount of metal complexed determined spectrophotometrically at 412 nm. As shown in Equation 2, the quantity of Ni(II) complexed with H2EBNMD qe (μg) is:
 (2)
(2)
Where, Co is initial Ni(II) concentration, Ce is the equilibrium Ni(II) concentration, V is the volume of Ni(II) and N is the mass of H2EBNMD. The percentage of Ni(II) complexed is calculated using Equation 3:
 (3)
(3)
Synthesis of H2EBNMD was prepared by mixing ethylenediamine and salicylaldehyde in 1:2 mole ratio as described elsewhere [9]. Ethylenediamine (22.475 g) was gradually added with stirring to salicyl aldehyde (91.336 g) of in a 500 ml beaker. A yellow hot mixture was formed and left under stirring for 5 minutes, yellow crystals were formed and recrystallization was done twice from carbon tetrachloride to yield golden yellow crystals (64.45% yield, M.P. 121 ± 1°C).
Molecular formula: C16H16N2O2; Formula weight: 268, electronic spectrum (DMF, nm, ƹ=Mol-1.dm3.cm-1) 260 (ƹ=3.0 × 10²), 285 (ƹ=3.6 × 10²), 335 (ƹ=4.7 × 10²); Elemental analysis: Calc. C, 71.64%; H, 5.97%; N, 10.44%; found: C, 70.89%; H, 6.05%; N, 10.41%. FTIR: 3401 cm-1 ν(OH) aromatic, 3042 cm-1 ν(C-H) aromatic, 2913 cm-1 ν(C-H) aliphatic, 1615 cm-1 ν(C=N) iminic, 1285 cm-1 ν(C-O) phenolic; 1H-NMR (ppm): 7.4 (1H, N=C(H) Methine protons of azomethine); 7.11 (3H, Hydrogen of aromatic ring); 6.5 (1, N-H protons); 3.5 (4H, =NCH2CH2N=Methyne or methylene protons). 13C-NMR (ppm): 221.44 (Bonded to phenolic oxygen); 152.65 (aromatic carbons); 48.69 (Methylene carbon); 3.90 (4H, =NCH2CH2N=Methyne or methylene protons).
Synthesis of Ni(II)-H2EBNMD
100 μg of Ni(II) was transferred into a 50 ml calibrated extraction bottle and volume made up to 5 ml with acid solution of 0.0001 M. Then 0.5 ml of H2EBNMD solution was added, 5 min for colour development allowed and complex formed extracted with 5 ml chloroform. The organic extracts were allowed to dry and crude product recrystallized twice from carbon tetrachloride, dried and characterized.
d.p ˃ 300°C; Appearance: Green crystals; Formula weight: 415.71; Percentage yield 45%., Elemental analysis; calc. C, 45.94%; H, 4.575%; N, 10.19%; found: C, 46.18%; H, 4.33%; N, 6.73%; FTIR: 3407 cm-1 ν(OH), ν(C-H) aliphatic, 2936 cm-1 ν(N-H), 1627 cm-1 ν(C=N) iminic, 1455 cm-1 ν(C-O) phenolic, 407 cm-1 ν(Ni-N), 470 cm-1 ν(Ni-O). 1H-NMR (ppm): 1H-NMR (ppm): 6.6 (1H, N=C(H) Methine protons of azomethine); 7.1-7.6 (4H, Hydrogen of aromatic ring); 3.6 (4H, =NCH2CH2N=Methyne or methylene protons). 13C-NMR (ppm): 206.80 (Bonded to oxygen of phenolic group); 79.00 (Solvent peaks); 30.72 (Bonded to methylene carbon) electronic spectrum (DMF, nm, ƹ=Mol-1.dm.cm-1) 260 (ƹ=4.2 × 10⁴), 295 (ƹ=4.3 × 10⁴) and 405 (ƹ=3.5 × 10⁴). From magnetic susceptibility measurement, the complex is diamagnetic. DSC peaks (141.4, 496.1, 573.1 and 836.6°C).
Antimicrobial studies
Culture media used in the study was prepared by separately dissolving 2 g of the nutrient broth powder and 38 g of the Mueller-Hinton agar powder in 250 ml and 1 L of deionized water respectively. The two media were sterilized in an autoclave at 121°C for 15 min and then left over night in a refrigerator after cooling. Cultures of the micro-organisms were prepared in sterile nutrient broth and incubated for 24 h at 37°C. About 0.1 ml of the cultures left overnight in sterile tubes with caps was made up to 10 ml with sterile distilled water. Also, 10 mg/ml of the compounds were made in ethanol as solvent. The positive control was an aliquot of 0.5 Mac Farland standard (10 μg of broad spectrum ampicillin) equivalent of test organism. The cultures of micro-organism was stretched on the surface of a dried Mueller Hinton agar plate and allowed for 20-25 min for pre diffusion of the organism into the agar. Sterile No 4 cork borer was used to make 8 mm hole in the inoculated agar plate. The complexes were introduced into the four (4) different holes made on the inoculated agar plate whereas the control was placed at the centre. The inoculated plates were incubated at 37°C for 18-24 h. The zones of inhibition of the micro-organism growth was measured and recorded for each different Ni(II)-H2EBNMD acid solution.
Results and Discussion
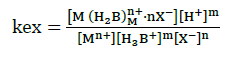
Mechanism of extraction from acid solutions
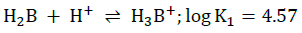
Figure 1 demonstrated the effects of various mineral acid concentrations on the extraction of nickel(II). Quantitative extraction was evident from all mineral acids studied between 0.001-0.0001 M. The acids, HCl, HNO3, H2SO4 and HClO4, at low pH, a sharp decrease in extraction was observed at acid concentration of 0.1-2 M owing to protonation of the H2EBNMD as shown in Equations 4 and 5.
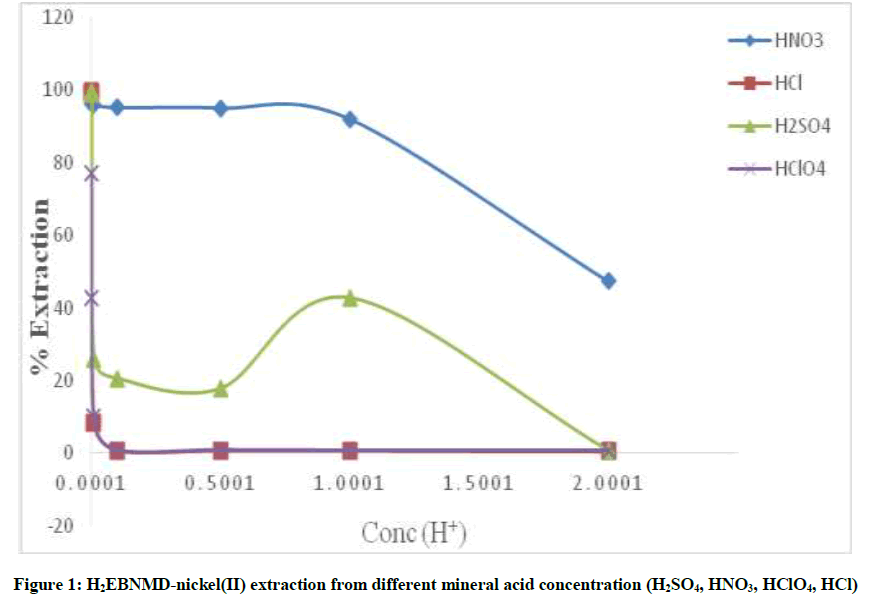
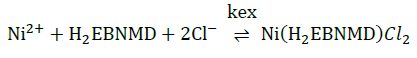
Figure 1: H2EBNMD-nickel(II) extraction from different mineral acid concentration (H2SO4, HNO3, HClO4, HCl)
 (4)
(4)
 (5)
(5)
The monotonous decrease in the extraction at high acidities could be due to complex instability, metal-ligand degradation, demetallation or competition for Ni2+ between molecules of H2EBNMD and increasing anion concentration in the aqueous phase [9].
The metal complex extraction mechanism could be anion association due to protonation (Equations 6, 7 and 8) of H2EBNMD at low pH (10-4 M) and as such can complex with the metal cations as neutral molecule [10] forming ion-association complex of the type [M(H2B)]2X-.
 (6)
(6)
 (7)
(7)
Where, X=Cl-, ClO4-, NO3-, or HSO4-, M=Metal cation and D=Distribution ratio.
 (8)
(8)
Optimizing the reaction parameters and predicted model verification
The 3D response surface plots showing the interaction among the reaction parameters are presented in Figures 2-6 and Table 2. The results indicated the factors must combine effectively for Ni-H2EBNMD complex to be produced. The software generated yield of the Ni-H2EBNMD is as shown in Equation 9.
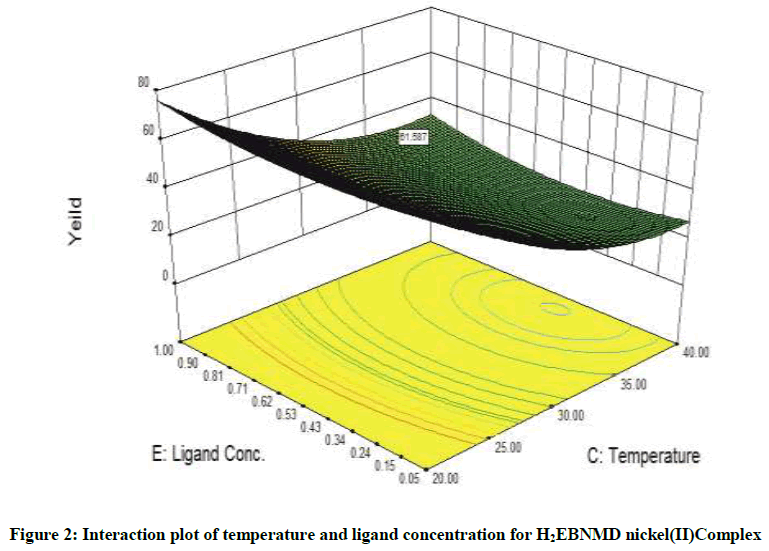
Figure 2: Interaction plot of temperature and ligand concentration for H2EBNMD nickel(II)Complex
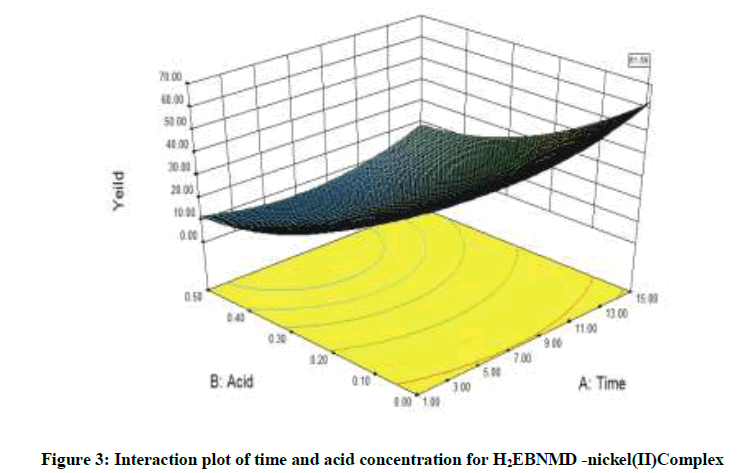
Figure 3: Interaction plot of time and acid concentration for H2EBNMD -nickel(II)Complex
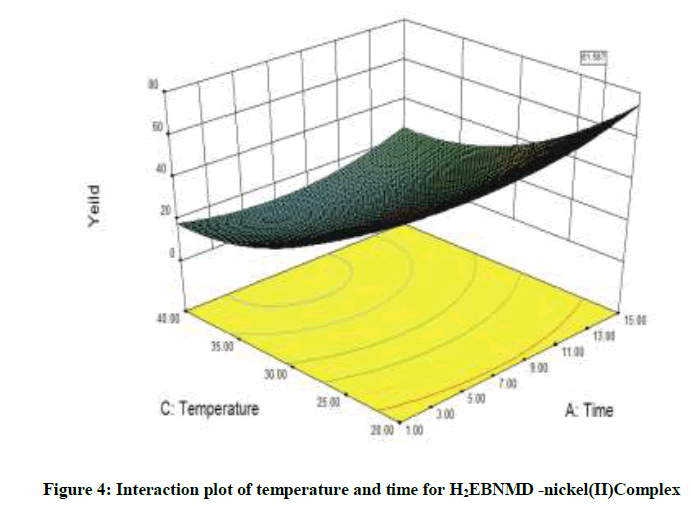
Figure 4: Interaction plot of temperature and time for H2EBNMD -nickel(II)Complex
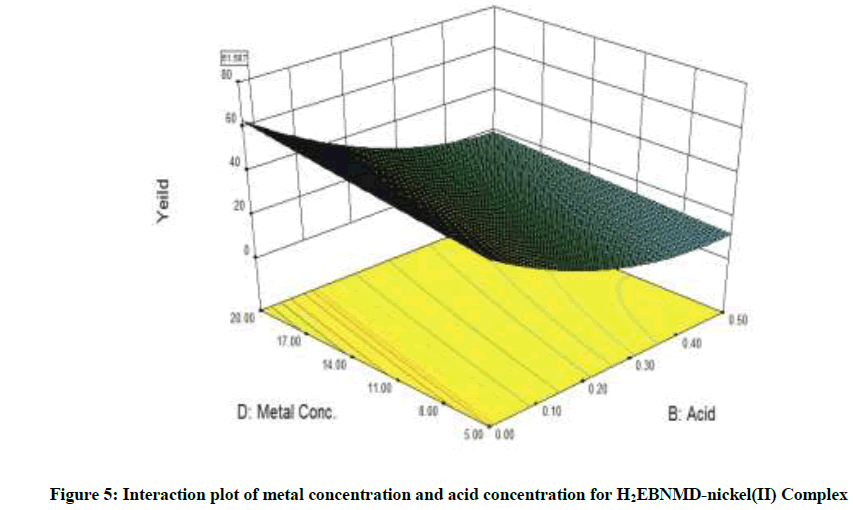
Figure 5: Interaction plot of metal concentration and acid concentration for H2EBNMD-nickel(II) Complex
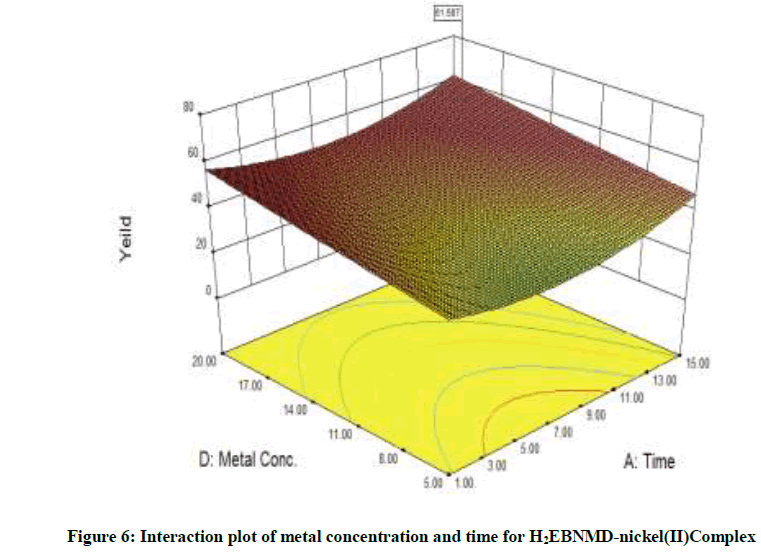
Figure 6: Interaction plot of metal concentration and time for H2EBNMD-nickel(II)Complex
| Expt Run | A | B | C | D | E | Yield |
|---|---|---|---|---|---|---|
| 1 | 1 | 0 | 30 | 12.5 | 0.53 | 22.71 |
| 2 | 15 | 0 | 30 | 12.5 | 0.53 | 29.44 |
| 3 | 1 | 0.5 | 30 | 12.5 | 0.53 | 8.44 |
| 4 | 15 | 0.5 | 30 | 12.5 | 0.53 | 16.57 |
| 5 | 8 | 0.25 | 20 | 5 | 0.53 | 10.16 |
| 6 | 8 | 0.25 | 40 | 5 | 0.53 | 12.18 |
| 7 | 8 | 0.25 | 20 | 20 | 0.53 | 23.79 |
| 8 | 8 | 0.25 | 40 | 20 | 0.53 | 11.31 |
| 9 | 8 | 0 | 30 | 12.5 | 0.05 | 22.03 |
| 10 | 8 | 0.5 | 30 | 12.5 | 0.05 | 7.86 |
| 11 | 8 | 0 | 30 | 12.5 | 1 | 24.44 |
| 12 | 8 | 0.5 | 30 | 12.5 | 1 | 11.48 |
| 13 | 1 | 0.25 | 20 | 12.5 | 0.53 | 22.57 |
| 14 | 15 | 0.25 | 20 | 12.5 | 0.53 | 28.85 |
| 15 | 1 | 0.25 | 40 | 12.5 | 0.53 | 16.19 |
| 16 | 15 | 0.25 | 40 | 12.5 | 0.53 | 24.77 |
| 17 | 8 | 0.25 | 30 | 5 | 0.05 | 1.83 |
| 18 | 8 | 0.25 | 30 | 20 | 0.05 | 8.41 |
| 19 | 8 | 0.25 | 30 | 5 | 1 | 5.05 |
| 20 | 8 | 0.25 | 30 | 20 | 1 | 11.23 |
| 21 | 8 | 0 | 20 | 12.5 | 0.53 | 51.8 |
| 22 | 8 | 0.5 | 20 | 12.5 | 0.53 | 1.79 |
| 23 | 8 | 0 | 40 | 12.5 | 0.53 | 10.12 |
| 24 | 8 | 0.5 | 40 | 12.5 | 0.53 | 33.01 |
| 25 | 1 | 0.25 | 30 | 5 | 0.53 | 2.16 |
| 26 | 15 | 0.25 | 30 | 5 | 0.53 | 10.39 |
| 27 | 1 | 0.25 | 30 | 20 | 0.53 | 9.35 |
| 28 | 15 | 0.25 | 30 | 20 | 0.53 | 15.98 |
| 29 | 8 | 0.25 | 20 | 12.5 | 0.05 | 23.14 |
| 30 | 8 | 0.25 | 40 | 12.5 | 0.05 | 14.36 |
| 31 | 8 | 0.25 | 20 | 12.5 | 1 | 22.6 |
| 32 | 8 | 0.25 | 40 | 12.5 | 1 | 20.92 |
| 33 | 1 | 0.25 | 30 | 12.5 | 0.05 | 10.08 |
| 34 | 15 | 0.25 | 30 | 12.5 | 0.05 | 17.63 |
| 35 | 1 | 0.25 | 30 | 12.5 | 1 | 13.22 |
| 36 | 15 | 0.25 | 30 | 12.5 | 1 | 20.53 |
| 37 | 8 | 0 | 30 | 5 | 0.53 | 12.05 |
| 38 | 8 | 0.5 | 30 | 5 | 0.53 | 2.67 |
| 39 | 8 | 0 | 30 | 20 | 0.53 | 22.62 |
| 40 | 8 | 0.5 | 30 | 20 | 0.53 | 4.87 |
| 41 | 8 | 0.25 | 30 | 12.5 | 0.53 | 0.02 |
| 42 | 8 | 0.25 | 30 | 12.5 | 0.53 | 0.02 |
| 43 | 8 | 0.25 | 30 | 12.5 | 0.53 | 0.02 |
| 44 | 8 | 0.25 | 30 | 12.5 | 0.53 | 0.02 |
| 45 | 8 | 0.25 | 30 | 12.5 | 0.53 | 0.02 |
| 46 | 8 | 0.25 | 30 | 12.5 | 0.53 | 0.02 |
Table 2: Amount of Ni(II)H2EBNMD complex extracted at different factor combinations for coded and un-coded values
Yield=0.019+3.71A-6.78B-2.62C+3.19D+1.51E+0.35AB+0.57AC-0.40AD-0.060AE+18.22BC-2.09BD+0.30BE-3.63CD+1.78CE-0.10DE+9.09A2+10.18B2+13.98C2 +0.36D2+6.26E2 (9)
P-value of 8.77 × 10⁷ and f value of 262.24 showed that the model is highly significant from regression analysis and analysis of variance (Table 3). The coefficient of determination (R2) of 0.9824 illustrated that predicted values and actual values are in good agreement being able to explain 98.24% of the results [11,12]. Strong model agreement was shown by the difference between adjusted R2 and predicted R2 being 0.0301 with the predicted model significance shown by non-significant lack of fit F-values of 1.86.
| Sum of source | Mean squares | df | F | p-value | Prob > F |
|---|---|---|---|---|---|
| Model | 5244.82 | 20 | 262.24 | 8.779E+007 | < 0.0001 |
| A | 220.82 | 1 | 220.82 | 7.39E+007 | < 0.0001 |
| B | 736.29 | 1 | 736.29 | 2.47E+008 | < 0.0001 |
| C | 109.46 | 1 | 109.46 | 3.66E+007 | < 0.0001 |
| D | 162.98 | 1 | 162.98 | 5.46E+007 | < 0.0001 |
| E | 36.40 | 1 | 36.4 | 1.22E+007 | < 0.0001 |
| AB | 0.49 | 1 | 0.49 | 1.64E+005 | < 0.0001 |
| AC | 1.32 | 1 | 1.32 | 4.43E+005 | < 0.0001 |
| AD | 0.64 | 1 | 0.64 | 2.14E+005 | < 0.0001 |
| AE | 0.015 | 1 | 0.015 | 4900.83 | < 0.0001 |
| BC | 1328.60 | 1 | 1328.6 | 4.45E+008 | < 0.0001 |
| BD | 17.50 | 1 | 17.5 | 5.86E+006 | < 0.0001 |
| BE | 0.36 | 1 | 0.36 | 1.21E+005 | < 0.0001 |
| CD | 52.56 | 1 | 52.56 | 1.76E+007 | < 0.0001 |
| CE | 12.60 | 1 | 12.6 | 4.22E+006 | < 0.0001 |
| DE | 0.040 | 1 | 0.04 | 13419.83 | < 0.0001 |
| A2 | 721.6 | 1 | 721.6 | 2.42E+008 | < 0.0001 |
| B2 | 903.94 | 1 | 903.94 | 3.03E+008 | < 0.0001 |
| C2 | 1706.15 | 1 | 1706.15 | 5.71E+008 | < 0.0001 |
| D2 | 1.11 | 1 | 1.11 | 3.72E+005 | < 0.0001 |
| E2 | 341.49 | 1 | 341.49 | 1.14E+008 | < 0.0001 |
| Residual | 7.468E-005 | 25 | 2.99E-06 | ||
| Lack of Fit | 6.585E-005 | 20 | 3.29E-06 | 1.86 | 0.2538 |
| Pure error | 8.833E-006 | 5 | 1.77E-06 | ||
| Core total | 5244.82 | 45 | |||
| Std. Dev. | 1.728E-003 | R2 | |||
| 0.9824 | |||||
| Mean | 13.89 | Adj R2 | |||
| 0.9523 | |||||
| C.V. % | 0.012 | Pred R2 | |||
| 0.9114 |
Table 3: ANOVA for response surface quadratic model for Ni(II)H2EBNMD metal complex extraction
The optimum time of extraction, acid concentration, temperature, metal concentration and ligand concentration as generated was 14.98 min, 10-4 M, 22.67°C, 19.42 μg and 0.17 % respectively for nickel(II). The quantity of Ni-H2EBNMD generated using the design expert software was 61.59 ± 0.08 μg. Comparison of the predicted values with the actual values of 60 μg for nickel(II) indicated very close results as shown in Figure 7. Based on these, the system modeling is appropriate, adequate and optimization aim fulfilled.
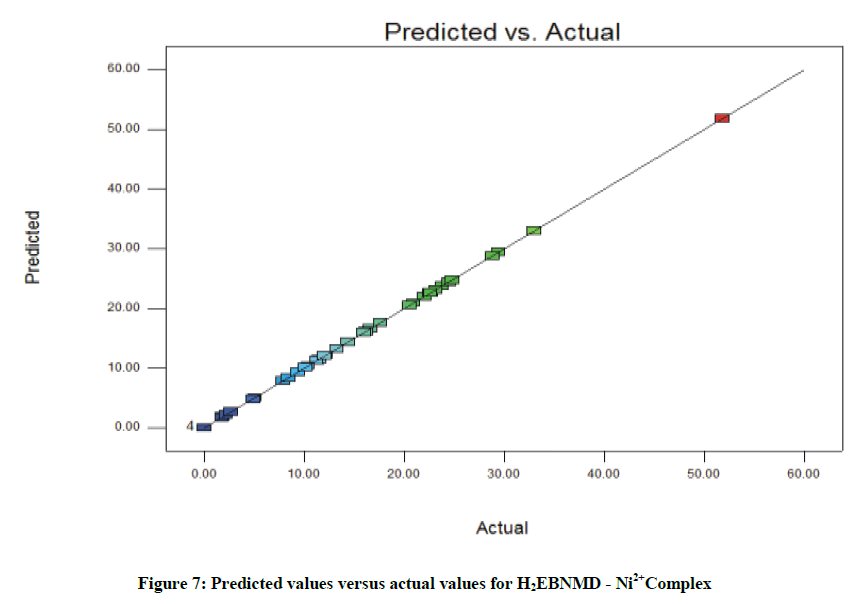
Figure 7: Predicted values versus actual values for H2EBNMD - Ni2+Complex
Spectroscopic data of H2EBNMD and complex
The free H2EBNMD ligand exhibits three absorptions at 260, 285 and 335 nm. The absorption at 260 and 285 nm could be assigned to π-π* transition of the benzene ring and azomethine or respectively [13,14]. The band at 335 nm could be attributed to n-π* intraligand charge transfer transition [14,15].
The absorption at 335 nm in the spectrum of H2EBNMD suffered hypsochromic shift to 405 nm in the form of Ligand to Metal Charge Transfer (LMCT) transition in the complex. Electronic spectrum of the Ni(II) a d8 complex exhibited three bands in the region 24691 cm-1 assignable to 1AIg → 1T2g and 33898 and 38462 cm-1 due to charge transfer transitions respectively notable in a square planar environment for Ni(II) ion [13]. The absence of bands around 10120-11605, 16062-16180 and 25210-25575 cm-1 assignable to 3A2g (F) → 3T2g (F), 3A2g (F) → 3TIg and 3A2g (F) → 3TIg (P) respectively refutes octahedral geometry around Ni(II) ion [13].
The FTIR spectra of the H2EBNMD-Ni(II) complex was interpreted by comparison of its spectra with H2EBNMD. The stretching vibrations of phenolic hydroxyl group at 3401 cm-1 a consequence of intermolecular hydrogen bonding [14-16] in H2EBNMD peak was also present in the spectra of Ni(II)-H2EBNMD complex. Stretching vibrations of (C=N) imine group of H2EBNMD seen at 1615 cm-1 was on complexation shifted to 1627 cm-1 (Higher frequencies) indicating co-ordination through the N2O2 donor atom set of H2EBNMD [17-12]. The new bands in the IR of Ni(II)-H2EBNMD at 407 and 470 cm-1 is as a result of M-N and M-O stretching vibration [17-22].
The mass of H2EBNMD and Ni(II)-H2EBNMD complex were obtained by electron ionization by breaking the molecules into charged ions in GC-MS equipment. The mass spectrum of H2EBNMD shows molecular peak ion at 264 indicating molecular mass of the ligand as 264 g/mol with various fragments at 206, 176, 172, 155 and 127. Ni(II)-H2EBNMD shows a molecular ion peak at 415 indicating molecular mass of the complex as 415 g/mol with various fragments peaks at 355, 327, 289, 206, 139 and 125.
The decomposition studies of Ni(II)-H2EBNMD using differential scanning calorimetry showed four stages of decomposition of the complexes with temperature variation. The four decomposition points occurred at 141.4, 496.1, 573.1 and 836.6°C. The thermal degradation patterns have been attributed to loss of water and labile attachments, loss of component attached to the phenolic moiety, ligand degradation or decomposition and final decomposition to metal oxide as illustrated in Scheme 1. Similar observations have been seen in complexes of H2EBNMD [4,5].
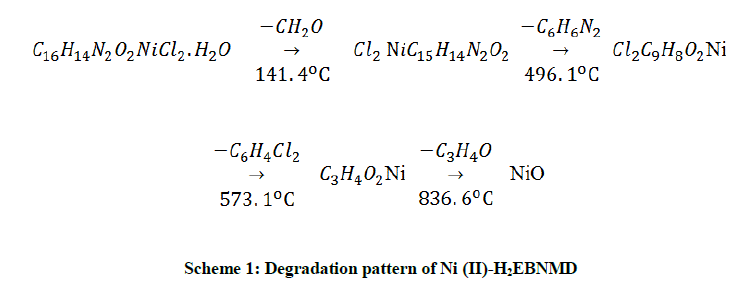
Scheme 1: Degradation pattern of Ni (II)-H2EBNMD
The degradation process was evaluated using some parameters listed in Table 4. Negative values of ΔS and positive value of ΔG was observed in some steps indicating that the reactions are slower than expected establishing the nonspontaneous nature of the degradation process [23]. The endothermic nature of the degradation process is illustrated by the positive value of enthalpy [24] and the calorimetric enthalpy ( ) values determine the overall contribution of exothermic and endothermic processes calculated only by DSC method [25]. The relation in Equation 10, helps in deriving the values of
  .
.
| Compound | T | Tm |  |
 |
 |
 |
 |
 |
|---|---|---|---|---|---|---|---|---|
| Ni(II)-H2EBNMD | 146.4 | 141.4 | 31.24 | 13.7 | 0.221 | -0.009 | 99.74 | 0.697 |
| 509.2 | 496.1 | -101.8 | 19.4 | -0.205 | -0.099 | 152.34 | 0.300 | |
| 617.6 | 573.1 | 576.7 | 55.5 | 1.006 | 0.161 | 3046.4 | 5.156 | |
| 842.2 | 836.6 | 444.66 | 14.1 | 0.531 | 0.365 | 523.56 | 0.623 |
(J/K)=Calorimetric enthalpy, ΔCp=Change in heat capacity (°C), (J/K)=Entropy change, =Free energy change, =Denaturation entropy, =Denaturation enthalpyTable 4: Thermodynamic data on the DSC decomposition of Ni (II)-H2EBNMD complex
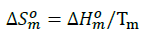 (10)
(10)
Consequently,  could be calculated from the modified Gibb`s Helmotz equation [25] (Equation 11).
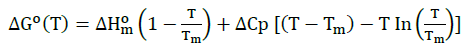 (11)
(11)
 and
and  respectively could be derived from Kirchoff`s laws [25] (Equations 12 and 13).
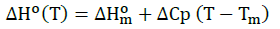 (12)
(12)
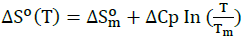 (13)
(13)
Hydrogen of aromatics ring of H2EBNMD was displayed as complex multiplets at 7.11 ppm (3H) due to coupling of 4 hydrogen atoms in the ring whereas the methyne proton of the ethylene bridge was observed as doublet at 3.5 ppm (4H) illustrating the symmetrical nature of the ligand. The appearance of triplet peak at 6.5 ppm (2H) was assigned to (N=C-H) proton whereas the azomethine proton was shown as quartet (1H) at 7.4 ppm [20]. In Ni(II)-H2EBNMD, the complex multiplets observed between 7.1-7.3 ppm (6H) was assigned to the hydrogen of the aromatic ring. The triplet at 6.6 ppm integrated for 1 proton was assigned to the (N=C-H) proton while the doublet at 3.6 ppm was assigned to the methyne proton of the ethylene bridge [19].
H2EBNMD is a symmetrical molecule and as such less than expected resonances appear in the 13C-NMR. The peak centred at 78 ppm was due to the solvent CDCl3 whereas the peaks at 221.44 ppm, 152.65 ppm and 48.69 ppm are due to quaternary carbon atom bonded to oxygen of phenolic group (-C-O), imine bonded carbon (-N=C-H) and methylene carbon(-NCH2CH2N-) respectively [26,27].
Three peaks at 206.8, 30.72 and 79.0 ppm was observed in Ni(II)-H2EBNMD. The peak at 206.8 ppm was assigned to quaternary carbon atom bonded to oxygen atom of phenolic group. The peak at 30.72 ppm was assigned to imine bonded carbon whereas the peak at 79.0 ppm was the solvent peak [27]. The up-field shift of the signals at quaternary carbon atom bonded to oxygen and imine bonded carbon atom of 14.64 and 17.97 ppm respectively confirmed the involvement of C-O and NCH2CH2N groups in bonding.
Antimicrobial evaluation
The antimicrobial activity of the H2EBNMD and the complex was evaluated and based on the result, the activity indices of Ni(II)-H2EBNMD in HCl and Ni(II)-H2EBNMD in HNO3 are high 90.90 and 72.72% respectively (Tables 5 and 6). H2EBNMD is a ligand with hetero donor atoms (N and O) and studies [28-32] have noted that such interferes with enzymatic activities and enzymes that need N or O groups for their activity are more prone to denaturation by metal ions on complexation. The antimicrobial activity indices of the complex Ni(II)-H2EBNMD, was high and averaging a value of 90.90% in Klebsiella sp., and 66.67% in S. aureus (Tables 5 and 6). Generally, it was observed that Ni(II)-H2EBNMD complex have better activity than H2EBNMD. This could be attributed to chelation which enhanced the Ni(II)-H2EBNMD complex crossing over the micro-organisms cell membrane, increasing permeation through the lipid layer of the organism’s cell membrane (Lipophilicity) and blocks metal co-ordination sites on enzymes of the micro-organism and as noted by chelation theory [26-35].
| H2EBNMD-Metal complex | Microorganisms zone of inhibition | |||
|---|---|---|---|---|
| Pseudomonas sp., | Klebsiella sp., | Escherichia coli | Staphylococcus aureus | |
| Ni(II)-H2EBNMD H2SO4 | R | 12 | R | 14 |
| Ni(II)-H2EBNMD HCl | R | 40 | 12 | 14 |
| Ni(II)-H2EBNMD HNO3 | 8 | 32 | 14 | R |
| H2EBNMD | R | 8 | 6 | 6 |
| Ampicillin (Standard) | 21 ± 2 | 44 ± 2 | 34 ± 2 | 21 ± 2 |
Table 5: Antimicrobial activity of H2EBNMD Ni (II)-H2EBNMD complex
| H2EBNMD metal complex | Activity Index (%) | |||
|---|---|---|---|---|
| Pseudomonas sp., | Klebsiella sp., | Escherichia coli | Staphylococcus aureus | |
| Ni(II)-H2EBNMD H2SO4 | - | 27.27 | - | 66.67 |
| Ni(II)-H2EBNMD HCl | - | 90.9 | 27.27 | 66.67 |
| Ni(II)-H2EBNMD HNO3 | 38.09 | 72.72 | 41.18 | - |
| H2EBNMD | - | 18.18 | 17.65 | 28.57 |
Table 6: Activity index of H2EBNMD and Ni(II)-H2EBNMD complex in comparison to standard ampicillin
Complexation thermodynamics
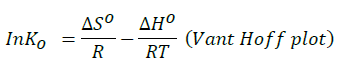
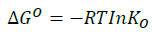
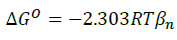
Vant Hoff thermodynamic properties of Ni(II)-H2EBNMD complex in solution as shown in Table 7 illustrated that the change in entropy is negative and change in enthalpy is positive. Temperature was varied between 288-313K and the stability constant of the complex decreased with temperature increase. The observed increase in the quantity of Ni(II)-H2EBNMD extracted with temperature rise indicated that the process could be endothermic [36,37]. The negative values of Gibb’s free energy change, the positive value of enthalpy and negative values of entropy changes indicated that the process is spontaneous and feasible, endothermic and involved solvation process respectively [38,39]. The thermodynamic parameters of complexation such as standard enthalpy of complexation (ΔH0), standard entropy change of complexation (ΔS0), standard free energy changes (Gibb’s free energy) of complexation (ΔG0) and stability constant for complex formation (βn) are evaluated from Equations 14- 17 and represented in Table 7.
| Metal-complex | T (K) | InK0 | Βn | ∆G° (KJ.Mol-1) | ∆H° (KJ.Mol-) | ∆S (KJ.Mol-1.K-1) |
|---|---|---|---|---|---|---|
| Ni(II)-H2EBNMD | 288 | 3.17 | 1.38 | -7.59 | 1155.74 | -0.1817 |
| 293 | 3.10 | 1.35 | -7.55 | |||
| 293 | 3.00 | 1.30 | -7.55 | |||
| 303 | 2.90 | 1.26 | -7.43 | |||
| 308 | 2.923 | 1.27 | -7.48 | |||
| 313 | 2.923 | 1.27 | -7.60 |
Table 7: Vant Hoff Thermodynamic Parameters of Ni(II)-H2EBNMD complex
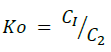 (14)
(14)
 (15)
(15)
 (16)
(16)
 (17)
(17)
Where, Ko=The thermodynamic equilibrium constant, C1=The amount of Ni(II) complexed, C2=Ni(II) ion concentration, R=Universal gas constant (KJ Mol-1k-1) and T=Temperature in K.
Complexation models
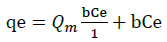
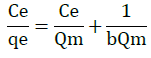
Langmuir model is expressed as Equation 18.
 (18)
(18)
In consideration of the Langmuir model of Ni(II)-H2EBNMD complexation, Ce(μg) is the equilibrium concentration of the Ni(II) ion, qe (μg) the quantity of Ni(II) ion per unit mass of H2EBNMD, Qm and b represents Langmuir constants for complexation capacity and complexation rate respectively graphically evaluated (Figure 8) and as illustrated in Equation 19. Similarly the dimensionless separation factor RL could be derived from Langmuir parameter b [12] as illustrated in Equation 20.

Figure 8: Langmuir isotherm model for Ni (II)-H2EBNMD complexation
 (19)
(19)
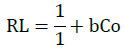 (20)
(20)
Co is the initial Ni(II) metal ion concentration. The RL values for Ni(II)ion complexation on H2EBNMD is 0.2, 0.10,0.07 and 0.05 for 5,10,15 and 20 μg Ni(II) metal ion concentration indicating that the complexation is favourable ((Hall et al., 1966).
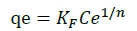
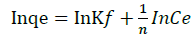
Freundlich complexation model is expressed as Equation 21 where n is the complexation intensity and KF the complexation capacity representing the intercept and slope of the linear plot of Inqe against InCe (Figure 9) and illustrated in Equation 22 respectively. Complexation of Ni(II) ions on H2EBNMD correlated with Langmuir (R2=0.9637) and Freundlich (R2=0.9995) as illustrated in Figures 8 and 9.
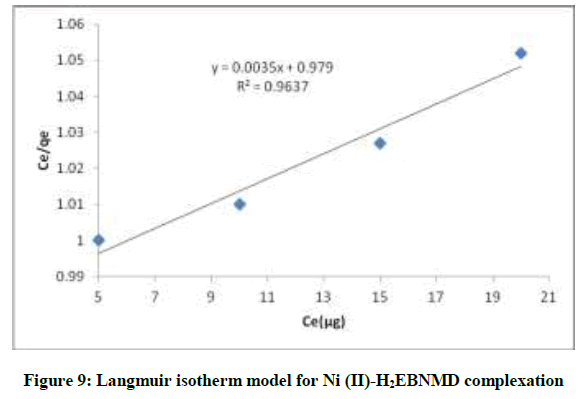
Figure 9: Langmuir isotherm model for Ni (II)-H2EBNMD complexation
 (21)
(21)
 (22)
(22)
Kinetics of complexation
Lagergren Pseudo-first-order and Pseudo-second-order models were applied to analyze the kinetics of complexation process as illustrated in Equations 23 and 24 respectively.
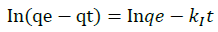 (23)
(23)
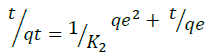 (24)
(24)
Here, qe is the quantity of Ni(II) complexed with H2EBNMD at equilibrium (μg) and qt is the quantity (μg) of Ni(II) complexed at time t (min) and K1 and K2 are rate constants. Plots of In(qe-qt) versus t for Pseudo-first-order model and t/qt versus t for second-order-model (Figures 10 and 11) gave slopes of K1 and K2 respectively. Regression coefficients of complexation from pseudo-second-order kinetic model (R2=0.9983 for nickel(II)) and Pseudo-first-order kinetic model (R2=0.383 for nickel(II)) illustrated that pseudo-second-order kinetic model was obeyed in the complexation process.
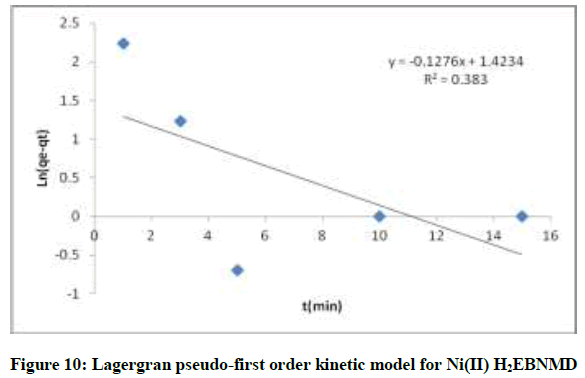
Figure 10: Lagergran pseudo-first order kinetic model for Ni(II) H2EBNMD
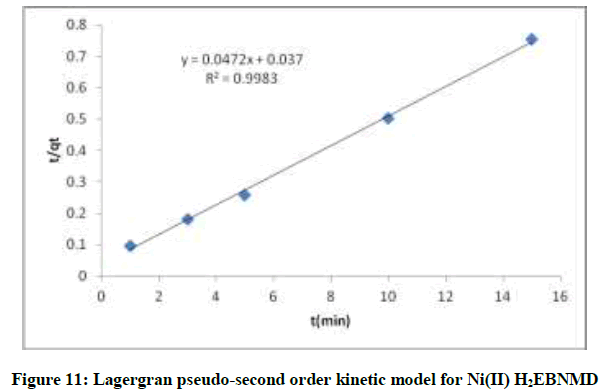
Figure 11: Lagergran pseudo-second order kinetic model for Ni(II) H2EBNMD
Based on spectral data, conductivity data and magnetic susceptibility measurement, the proposed structure for the ligand and complex is shown in Figure 12.
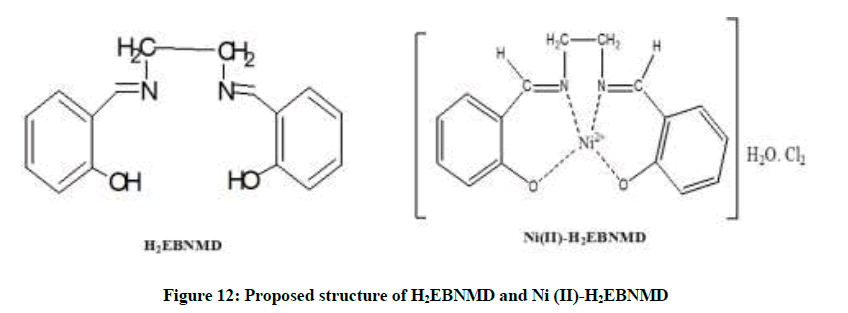
Figure 12: Proposed structure of H2EBNMD and Ni (II)-H2EBNMD
Conclusion
In conclusion (1) H2EBNMD and its Ni(II) complexes was synthesized from various acid solutions leading to the formation of 1:1 diamagnetic ionic complex of square planar geometry. (2) The process conditions for the synthesis of the metal complex were modeled using Box-Behnken design approach to get the optimum conditions for the yield an important industrial design approach. (3) The stability of the prepared complex was studied using DSC and thermodynamic approach (solution) for applicability in drug design and result showed that the complex is stable and its formation in solution feasible. (4) The antimicrobial potency of the complex was studied to ascertain its bioefficacy. The result indicated that the ligand and the complex could serve as potential antimicrobial agent. (5) The complexation fitted into the Freundlich and Langmuir isotherms and as well obeyed pseudo-second-order kinetic model.
Acknowledgement
The authors are grateful to Ebonyi State University, Abakaliki TET Fund seed grant (Ref No: EBSU/TETFund/IBR/2015/10) for financial assistance.
References
- M.Y. Kang, C.S. Lim, H.S. Kim, E.W. Seo, H.M. Kim, O. Kwon, B.R. Cho, Chem. Eur. J., 2012, 18, 1953-1960.
- P.E. Aranha, M.P. dos Santos, S. Romera, E.R. Dockal, Polyhedron., 2006, 26, 1373-1382.
- R. Brown, R. Fischer, J. Blunk, K.D. Berlin, K. Ramalingam, N.N. Durham, Proc. Okla. Acad. Soc., 1976, 56, 15-17.
- G. Bruylant, J. Wouters, C. Michaux, Curr. Med. Chem., 2005, 12, 2011-2020.
- D. Borah, M.K. Baruah, Fuel Proc. Technol., 2001, 72(2), 83-101.
- C.R. Bhattacharjee, P. Goswami, P. Mondal, Inorg. Chim. Acta., 2012, 387, 86-92
- Y.Y. Zhang, J.H. Liu, Chem. Biochem. Eng. Q., 2011, 25, 75-81.
- K. Ravi-kumar, K. PakShirajan, T. Swaminathan, T. Balu, Chem. Eng. J., 2005, 105, 131-138.
- G. Barone, A. Silvestri, G. La Manna, J. Mol. Struct. Theochem, 2005, 715, 79-83.
- A.A.A. Emara, A.M. Ali, A.F. El-Asmy, E.M. Ragab, J. Saud. Chem. Soc., 2011, 18(6), 762-773.
- M. Mourabet, A. EL-Rhilassi, H. Boujaady, M. Bennani-Ziatni, R. EL-Hamri, A. Taitai, J. Saud. Chem. Soc., 2015, 19, 603-615.
- K.L. Hall, L.C. Eagletow, A. Acrivos, T. Vermeulen, Ind. Eng. Chem. Fundam., 1966, 5, 212-223.
- P. Gluvchinsky, G.M. Mocler, Spectrochim. Acta A., 1977, 33, 1073-1077.
- X.M. Hu, L.W. Xue, G.Q. Zhao, W.C. Yang, Bull. Chem Soc. Ethiop., 2014, 29(3), 407-413.
- A. Jancso, Z. Paksi, S. Mikkola, A. Rockenbauer, T. Gajda, J. Inorg. Biochem., 2005, 99, 1480-1489.
- J.A. Faniran, K.S. Patel, J.C. Bailar Jr, J. Inorg. Nucl. Chem., 1974, 36,1547.
- K. Ueno, A.E. Martel, J. Phys. Chem., 1956, 60, 1270-1276.
- T. Kurahashi, Y. Kobayashi, S. Nagamoto, T. Tosha, T. Kitagawa, H. Fujji, Inorg. Chem., 2005, 44, 8156-8166.
- T. Kurahashi, K. Oda, M. Sigimoto, T. Ogura, H. Fujji, Inorg. Chem., 2006, 45, 7709-7721.
- N.S. Venkatramanan, K. Gopi, S. Rajagopal, Coord. Chem. Rev., 2005, 249, 1249-1268.
- N.S. Venkatramanan, S. Premsingh, S. Rajagopal, K. Pitchumani, J. Org. Chem., 2003, 68, 7460-7470.
- S. Premsingh, N.S. Venkatramanan, S. Rajagopal, S.P. Mirza, M. Vairamani, P. Sambasiva Rao, K. Velavan, Inorg. Chem., 2004, 43, 5744-5753.
- V.K. Sivasubramanian, M. Ganesan, S. Rajagopal, R. Ramaraj, J. Org. Chem., 2002, 67, 1506-1514.
- A.M. Imelda Jayaseeli, S. Rajagopal, J. Mol. Catal. A Chem., 2009, 309, 103-110.
- C.H. Lee, C.K. Hsu, C.L. Chang, Thermochim. Acta., 2002, 173, 392-393.
- P. Kopel, M. Biler, Z. Travnicek, M. Nadvornick, Acta Universitatis Palackianae Olomucensis Facultas Rerum Naturalium Chemica., 1998, 37, 17-23.
- M. Badea, A.M. Crasanda, M.C. Chifiriuc, L. Marutescu, V. Lazar, D. Marinescu, R. Olar, J. Therm. Anal. Calorim., 2013, 111(3), 1743-1751.
- A. Silvestri, G. Barone, G. Ruisi, M. Teresa, L. Giudice, S. Tumminello, J. Inorg. Biochem., 2004, 98, 589-594.
- K.H. Thompson, C. Orvig, Dalton Trans., 2006, 6, 761-764.
- B.G. Tweedy, Phytopathol.,1964, 55, 910-914.
- S. Mohammed, M.S. Ameerunisha Begum, S. Sounik, M. Nethaji, A.R. Chakravarty, J. Inorg. Biochem., 2010, 104, 477-484.
- S. Routier, H. Vezin, E. Lamour, J.L. Bernier, J.P. Catteau, C. Bailly, Nucl. Acids. Res., 1999, 27, 4160-4166.
- A. Terenzi, G. Barone, A. Silvestri, A.M. Giuliani, A. Ruggirello, V.T. Liveri, J. Inorg. Biochem., 2009, 103, 1-9.
- A. Gosalves, M.F. Blanco, C. Vivero, F. Valles, Eur. J. Cancer., 1978, 14, 1185-1190.
- A. Böttcher, M.W. Grinstaff, J.A. Labinger, H.B. Gray, J. Mol. Catal. A Chem., 1996, 113, 191-200.
- M. Gullotti, L. Casella, A. Pasini, R. Ugo, Dalton Trans., 1977, 4, 339-345.
- G.M. Bancroft, A.G. Maddock, R.P. Randl, J. Chem. Soc. A., 1968, 2939-2944.
- A.A. El-Bindary, M.A.D. El-sonbati, M.K. Abd-El kader, J. Chem., 2003, 1155, 682186
- M.B. Juan, A. Eva, M.G. Ana, C. Luis, Anal. Sci., 2003, 19, 1431-1439.


