Research Article - Der Pharma Chemica ( 2018) Volume 10, Issue 10
2D QSAR Study of Imidazothiazole-Propenones Derivatives as Potential Anticancer Agents by DFT-QSAR Models
Lafridi Hind1, Hanane Zaki2,3, Hsaine Zgou1* and Mohammed Bouachrine3
1Material Sciences, Processes, Environment and Modeling, Polydisciplinary Faculty, Ibn Zohr University, Ouarzazate, Morocco
2Biology Environment and Health Laboratory, Faculty of Sciences and Technics, Moulay Ismail University, Meknes, Morocco
3Materials, Environement and Modeling Laboratory, ESTM, Moulay Ismail University, Meknes, Morocco
- *Corresponding Author:
- Hsaine Zgou
Material Sciences, Processes
Environment and Modeling, Polydisciplinary Faculty
Ibn Zohr University, Ouarzazate, Morocco
Abstract
A series of Imidazo-propenones were evaluated for their cytotoxic effects against human cancer cell lines A549 (lung adenocarcinoma epithelial cell line). Quantitative Structure-Activity Relationship (QSAR) has been investigated in a series of 23 imidazothiazole-prop-2-en-1-one derivatives to correlate the activities and structures, using DFT and 2D-QSAR. The compounds were obtained by molecular descriptors encoding a small part of the whole chemical information of the molecule. The principal component analysis PCA; linear (Multiple linear regressions (MLR)); nonlinear (artificial neural network); and the regression partial least squares (PLS) models were used to relate the structural features to their reported activities. The ANN model was tested by leave-one-out-cross-validation reliably and unbiasedly estimates prediction errors, also to assess the significance of the model and to predict biological activities of other novel compounds. In this work, the results obtained indicate that our proposed models constituted of relevant descriptors. It is worth noting that such combination of several calculated parameters for the drugs structures obtained could be useful for the development of newer chemotherapeutic agents.
Keywords
Imidazo-propenones, 2D-QSAR, DFT study, Human lung cancer, Computational studies.
Introduction
Fused heterobicyclic compounds have crucial importance in the field of medicinal chemistry because of their wide range of physiological activities, such as anticancer, anti-inflammatory, antioxidant, antiviral, and antimicrobial activities [1,2]. Among the heterocyclic rings containing bridgehead nitrogen atom, imidazothiazoles derivatives have gained much importance, especially, in their different biological activities [3]. Aryl amino propenones are a new class of compounds reported recently with potent anti-tumor property by stimulation of tubulin polymerization, leading to disruption of tibulin-microtubule dynamic equilibrium and finally apoptotic cell death [4]. Our group has been devotedly working towards QSAR study of imidazothiazole-prop-2-en-1-one derivatives (Figure 1) as potential anticancer agents against human cancer cell lines A549. This article recapitulates the current knowledge about the biological behavior of these families of heterocycles relying on the multivariate statistical analyses. Historically, the primary objective of QSAR was to understand which properties are important to control a specific biological activity of a series of compounds. However, the main objective of novel compounds with improved activity based on their structure is one of the major challenges in today’s drug design and prediction of novel compounds. The aim of this study was to establish an empirical rule or function relating the structural descriptors of compounds under investigation to bioactivities. Four approaches were taken in order to accomplish this goal, namely, the principal components analysis (PCA), the development of multilinear mathematical equation (RLM), regression partial least squares (PLS) and creation and training of artificial neural networks (ANN). Once validated, the finding can be used to predict activities of untested compounds.
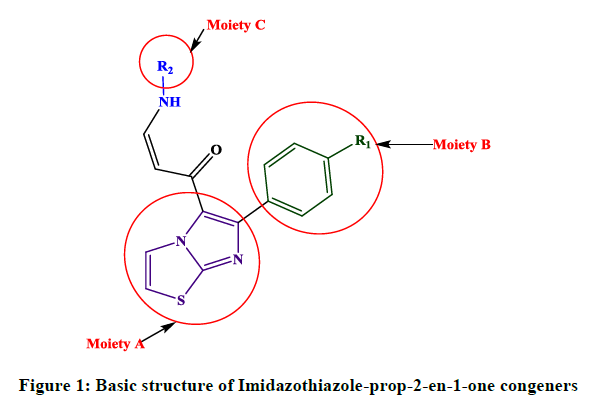
Figure 1: Basic structure of Imidazothiazole-prop-2-en-1-one congeners
Within the currently ongoing search for effective anticancer drug candidates, in the present study we have attempted to establish a reliable quantitative structure–activity relationship (QSAR) analysis based on 23 Imidazothiazole-prop-2-en-1-one-derivatives.
Materials and Methods
Experimental
A dataset of 23 Imidazothiazole-propenones derivatives were collected from the literature [5] and studied for their anti-proliferative activity against A549 (lung adenocarcinoma epithelial) cells. The activity (IC50) means the median concentration of molecules determined experimentally to inhibit 50% of cancer cells in a population of cancer cells [6]. Biological data are generally expressed as the opposite of the log 10 base of activity (pIC50=-log10 (IC50)) in order to obtain higher mathematical values when the structures are biologically very efficient [7]. The anticancer activity is expressed by the anticancer potential pIC50 that is defined in Eq. (1):
pIC50 = -log10 (IC50 * 10-6) (1)
The structures and their inhibitory activities are registered in Table 1. The biological data used in this study were the ant icancer activity against A549 (lung adenocarcinoma epithelial) cells.
| Compd. | R1 | R2 | *PIC50 | Compd. | R1 | R2 | *PIC50 |
|---|---|---|---|---|---|---|---|
| 1 | 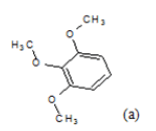 |
CH3 | 4.82 | 13 | H | 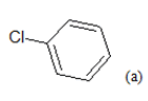 |
5.85 |
| 2 | 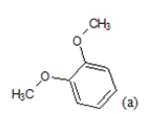 |
CH3 | 5.06 | 14 | H | 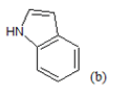 |
6.22 |
| 3 | 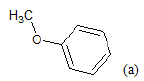 |
CH3 | 4.92 | 15 | H | 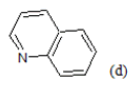 |
6.4 |
| 4 | 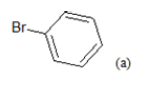 |
CH3 | 5.04 | 16 | F | 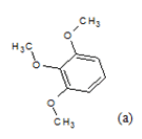 |
5.21 |
| 5 | 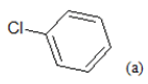 |
CH3 | 4.86 | 17 | F | 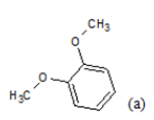 |
5.44 |
| 6 | 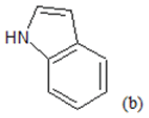 |
CH3 | 5.06 | 18 | F | 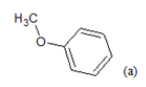 |
5.68 |
| 7 | 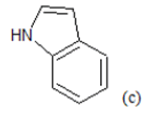 |
CH3 | 5.2 | 19 | F | 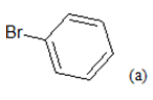 |
5.54 |
| 8 | 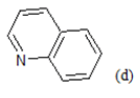 |
CH3 | 5.03 | 20 | F | 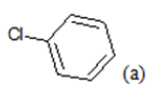 |
5.51 |
| 9 | 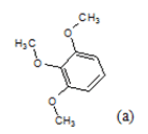 |
H | 4.94 | 21 | F | 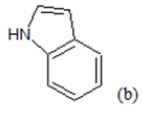 |
5.98 |
| 10 | 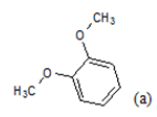 |
H | 5.43 | 22 | F | 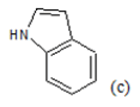 |
5.54 |
| 11 | 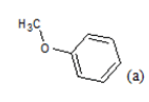 |
H | 6.22 | 23 | F | 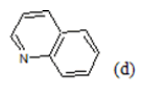 |
5.94 |
| 12 | 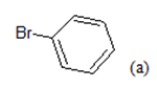 |
H | 6.3 |
(a): Substitutions at Para positions; (b): 5-indolyl; (c): 6-indolyl. (d) 3-quinolinyl
Table 1: Chemical structures of Imidazothiazole-propeones derivatives used in this study and their experimental activity for anticancer activity against A549 cells
Methodology
DFT optimization
DFT (density functional theory) methods were used in this study [8]. It is a closely related methodology to Hartree–Fock theory in that it attempts to provide a solution to the electronic state of a molecule directly from the electron density. A grid search procedure was performed with core structure to identify their lowest energy conformation. Geometry optimization was performed to obtain fixed core structure using the ab-initio calculation with 6-31G (d) [9] basis set of Gaussian 9 program. The functional groups are added to the core structure and the full geometry optimization was performed by B3LYP method [10].
Molecular descriptors calculation
To build QSAR models, it is obligatory to construct numerical descriptors of a set of molecule. Molecular descriptors are formal mathematical representations of a molecule, used to establish quantitative relationships between structures and properties, or biological activities.
A broad spectrum of descriptors such as topological, Electronic, thermodynamic, quantum mechanical, spatial, was calculated using Gaussian 9, ACD/Chemskech, and Chemoffice programs [11-13].
Only 15 descriptors (Table 2) were calculated. These descriptors have high divergence and good representation of biological activity.
| Abbreviation | Definition |
|---|---|
| E HOMO | The energy of Highest occupied Molecular Orbital |
| E LUMO | The energy of Lowest Unoccupied Molecular Orbital |
| μ | Dipole moment |
| PW | Molecular weight |
| LogP | Measure of lipophilicity calculated as octanol–water partition coefficient |
| D | Density |
| αe | Polarisability |
| PSA | Polar surface area |
| NHA | Count of all nitrogen, oxygen, and fluoride atoms present in the molecule able to form hydrogen bonds. |
| NHD | Count of all hydrogen atoms linked to oxygen and nitrogen atoms |
| Nrotb | The number of rotatable bonds |
| J | Balaban index |
| TC | Total connectivity |
| TVC | Total valence connectivity |
| ET | Total Energy |
Table 2: List of descriptors used in this study
QSAR modeling
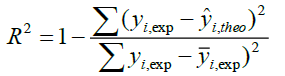
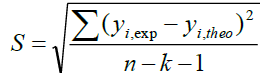
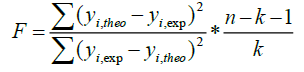
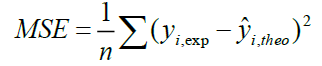
A QSAR model is developed according to statistical indicators. The structure of imidazothiazole-propenones was studied by different multivariate methods for regression analysis: multiple linear regressions (MLR), principal component analysis (PCA), partial least squares (PLS), artificial neural networks (ANNs). They are among more commonly used approaches for regression modeling [14]. To estimate the quality of the model, we determine these various statistical indicators analyses, including the correlation coefficient R, determination coefficient (R2), adjusted coefficient (Radj 2), Mean squared Error (MSE), significance level (p-value), the standard deviation S, and Fischer test F. The R2, S and F parameters describe the predictive capacity within the limits of the model and allow estimating the precision of the values calculated on the learning set [15]. The squared correlation coefficient R2 gives an evaluation of the dispersion of theoretical values around the experimental data. The quality of the modelling is improved when the points are close to the fitting line [16].
These various statistical metrics have been defined in the following manners:
 (2)
(2)
 (3)
(3)
 (4)
(4)
 (5)
(5)
Where, yi,exp : The experimental value of the anticancer activity;  : the theoretical value of the anticancer activity;
 : The average value of the experimental values of the anticancer activity, k is the number of independent descriptors, n is the number of molecules of the training set and n−k−1 corresponds to the degree of freedom. The (PCA), (MLR), (PLS) are available in the software called XLSTAT [17], and the (ANNs) are accessible in the software MATLAB [18].
Principal components analysis: In this study, we screened 15 preselected descriptors for 23 Imidazothiazole-propenones compounds, by using the statistical methods based on the principal component analysis (PCA). The principal component analysis (PCA) [19] has become the usual method of choice where a large number of descriptors are used. It is used to get the exploration and for the visualization of the huge numbers of descriptor data generated, to eliminate independent descriptors that are highly correlated by examining multicollinearity between descriptors and to select descriptors that show a high correlation with the response activity; that give extra weight because they will be more effective for predictions.
Multiple linear regressions (MLR): Regression analysis is used for modeling dependent variable Y, quantitative measures of response (IC50), in terms of predictors X (independent variables or molecular descriptors). The study of MLR (descendant) were based on the elimination of descriptors until a valid model was obtained and the stepwise multiple linear regression procedures were based on the forward selection and backward elimination methods were employed to determine the best regression models [20].
Artificial neural networks (ANN): Artificial neural networks (ANN) [21] have become an important modeling technique for QSAR. A particular advantage of ANNs is their inherent ability to incorporate nonlinear dependencies between the dependent and independent variables without using an explicit mathematical function. The network was built for three layers and organized in a layered topology as follows: (i) the input layer formed by a number of neurons equal to the number of descriptors obtained in the multiple linear regression models (In this work i=10), (ii) the output layer (in this work m=1) consisting of the calculated activity values, and (iii) the hidden layers (between them). The number of artificial neural in the hidden layer was adjusted experimentally. The hidden layer consisted of 10 artificial neural. The architecture of the applied ANN models is presented in Figure 2.
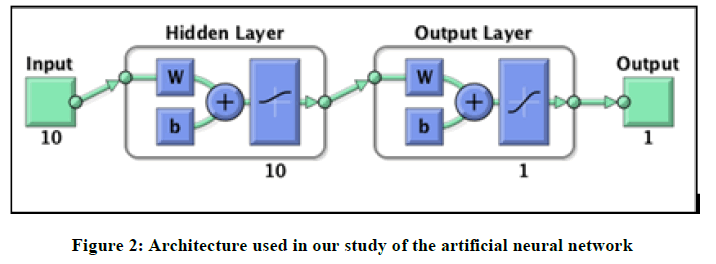
Figure 2: Architecture used in our study of the artificial neural network
The regression partial least squares (PLS): With the partial least squares (PLS) model, one aims to describe the linear relationship between a set of explanatory variables, X [22] and a response variable, Y. This method is capable of providing a solution when variables in the data are highly correlated. Therefore, unlike MLR analysis, the multicollineraity problem in the descriptors is omitted by PLS analysis. This is possible because the original variables are represented by a few new orthogonal latent factors, T obtained by maximizing the covariance of X with y. The PLS were generated to predict anticancer activity values (pIC50) and the equation was justified by the conventional approach: correlation coefficient (r), determination coefficient (r2), adjusted (radj2), Mean Squared Error (MSE), and significance level (p-value).
Validation
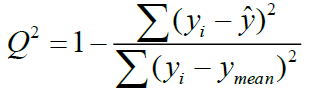
The final stage of QSAR-model analysis consists of statistical validation in order to assess the significance of the model, and to predict the activity of new compounds. The leave-on-out (LOO) has been used for this propose in which one compound is removed from the dataset and rebuilding the model. This is repeated such that each observation in the sample is used once as the validation data [23]. It involves using a single observation from the original sample as the validation datum and the remaining observations as the training data. A number of modified data sets are created by deleting in each case one or a small group of molecules [24]. To assess the accuracy of the prediction on the training set, the correlation coefficient of cross-validation Q2 was used and calculated by the following relation- ship:
 (6)
(6)
Where yi,  are the actual and predicted activity of the molecule in the training set, respectively, and y mean is the average activity of all molecules in the training set. The performance of a mathematical model, for Eriksson et al. [25], was characterized by a value of Q2 cv>0.5 for a satisfactory model and for an excellent model when Q2 cv>0.9. According to them, for a given training set, a model will be performing well if the acceptance criterion R2-Q2 cv<0.3 is respected.
Results and Discussions
Data for analysis
In this work, we screened 15 topological and electronic descriptors for 23 Imidazothiazole-propenones compounds. From the results of the DFT calculations, the quantum chemistry descriptors such as : the total energy (ET), the highest occupied molecular orbital energy (EHOMO), the lowest unoccupied molecular orbital energy (ELUMO), the dipole moment (μ), were obtained by the DFT Calculations. The number of rotatable bonds (Nrotb), total connectivity (TC), total valence connectivity (TVC), Density (D), and the molecular weight (PW), are calculated using Chemoffice.
Six other chemical descriptors of the studied molecules are calculated using Marvin Sketch Software [26], such as: Octanol/Water partition coefficient (LogP), Balaban Index(J), polarizability (αe), number of H-bonds acceptors (NHA), number of H-bonds donors (NHD), polar surface area (PSA). Table 3 shows the values of the calculated parameters obtained.
| Cpd. code | Et | EHOMO | E LUMO | μ | PW | D | αe | LogP | PSA | NHA | NHD | Nrotb | J | TC | TVC |
|---|---|---|---|---|---|---|---|---|---|---|---|---|---|---|---|
| 1 | -1 791.7 | -5.16 | -1.52 | 4.51 | 449.52 | 1.27 | 49.59 | 4.21 | 74.11 | 7 | 1 | 8 | 1089919 | 1.55E-06 | 3.24E-08 |
| 2 | -1 677.2 | -4.99 | -1.46 | 3.87 | 419.5 | 1.26 | 47.29 | 4.23 | 64.87 | 6 | 1 | 7 | 1059125 | 1.61E-05 | 1.00E-07 |
| 3 | -1 562.6 | -5.13 | -1.44 | 3.12 | 389.47 | 1.25 | 44.98 | 4.64 | 55.64 | 5 | 1 | 6 | 770961 | 2.78E-05 | 2.84E-07 |
| 4 | -4 019.2 | -5.5 | -1.66 | 3.94 | 438.34 | 1.46 | 45.68 | 5.39 | 46.41 | 4 | 1 | 5 | 638497 | 3.94E-05 | 6.96E-07 |
| 5 | -1 907.7 | -5.51 | -1.66 | 4.01 | 393.89 | 1.32 | 44.5 | 5.26 | 46.41 | 4 | 1 | 5 | 638497 | 3.94E-05 | 3.72E-07 |
| 6 | -1 579.7 | -5.07 | -1.35 | 4.34 | 398.48 | 1.34 | 46.53 | 4.78 | 62.2 | 5 | 2 | 5 | 768380 | 1.14E-05 | 4.74E-08 |
| 7 | -1 579.7 | -6.54 | -6.03 | 4.46 | 398.48 | 1.34 | 46.53 | 4.78 | 62.2 | 5 | 2 | 5 | 768380 | 1.14E-05 | 1.30E-07 |
| 8 | -1 617.8 | -5.45 | -1.83 | 1.87 | 410.49 | 1.31 | 48.36 | 4.73 | 59.3 | 5 | 1 | 5 | 1653646 | 8.04E-06 | 5.19E-08 |
| 9 | -1 752.4 | -5.23 | -1.68 | 3.09 | 435.5 | 1.29 | 47.84 | 3.76 | 74.11 | 7 | 1 | 8 | 1212229 | 1.14E-05 | 4.10E-08 |
| 10 | -1 637.9 | -5.1 | -1.6 | 4.93 | 405.47 | 1.28 | 45.54 | 3.78 | 64.87 | 6 | 1 | 7 | 902144 | 1.97E-05 | 1.16E-07 |
| 11 | -1 523.3 | -5.17 | -1.48 | 3.16 | 375.44 | 1.27 | 43.23 | 4.19 | 55.64 | 5 | 1 | 6 | 649647 | 3.41E-05 | 3.48E-07 |
| 12 | -3 979.9 | -5.55 | -1.7 | 3.81 | 424.31 | 1.48 | 43.92 | 4.94 | 46.41 | 4 | 1 | 5 | 534120 | 4.82E-05 | 3.79E-07 |
| 13 | -1 868.4 | -5.51 | -1.85 | 0.55 | 379.86 | 1.34 | 42.75 | 4.81 | 46.41 | 4 | 1 | 5 | 534120 | 4.82E-05 | 9.11E-07 |
| 14 | -1 540.4 | -50.96 | -1.39 | 4.51 | 384.45 | 1.36 | 44.78 | 4.33 | 62.2 | 5 | 2 | 5 | 651183 | 1.39E-05 | 5.47E-08 |
| 15 | -1 578.5 | -5.48 | -1.87 | 2.31 | 396.46 | 1.33 | 46.61 | 4.28 | 59.3 | 5 | 1 | 5 | 773087 | 9.84E-06 | 6.35E-08 |
| 16 | -1 851.6 | -5.28 | -1.73 | 4.25 | 453.49 | 1.33 | 47.79 | 3.93 | 74.11 | 7 | 1 | 8 | 1410479 | 9.28E-06 | 1.27E-08 |
| 17 | -1 737.1 | -5.27 | -1.72 | 4.06 | 423.46 | 1.32 | 45.48 | 3.94 | 64.87 | 6 | 1 | 7 | 1059125 | 1.61E-05 | 3.58E-08 |
| 18 | -1 622.6 | -5.18 | -1.65 | 5.03 | 393.43 | 1.32 | 43.18 | 4.35 | 55.64 | 5 | 1 | 6 | 770961 | 2.78E-05 | 1.01E-07 |
| 19 | -4 079.2 | -5.55 | -1.91 | 1.79 | 442.3 | 1.53 | 43.87 | 5.1 | 46.41 | 4 | 1 | 5 | 638497 | 3.94E-05 | 2.48E-07 |
| 20 | -1 967.7 | -5.56 | -1.91 | 1.76 | 397.85 | 1.39 | 42.7 | 4.97 | 46.41 | 4 | 1 | 5 | 638497 | 3.94E-05 | 2.81E-07 |
| 21 | -1 639.6 | -5.16 | -1.43 | 5.84 | 402.44 | 1.41 | 44.73 | 4.49 | 62.2 | 5 | 2 | 5 | 768380 | 1.14E-05 | 1.89E-08 |
| 22 | -1 639.6 | -5.07 | -1.65 | 4.34 | 402.44 | 1.41 | 44.73 | 4.49 | 62.2 | 5 | 2 | 5 | 768380 | 1.14E-05 | 3.80E-08 |
| 23 | -1 677.4 | -5.54 | -1.92 | 3.73 | 414.45 | 1.38 | 46.56 | 4.45 | 59.3 | 5 | 1 | 5 | 907015 | 8.04E-06 | 1.85E-08 |
Table 3: Values of chemical descriptors
Correlation matrix: Principal component analysis
The set of 15 descriptors encoding the 23 of imidazothiazole-propenones compounds are submitted to PCA analysis. The quality of the projection during the passage of N dimensions (N is the number of variables) to a smaller number of dimensions. The first eigenvalue is 6.854 and represents 42.84% of the variability. This means that we represent the data on a single axis, so always we will have 43% of the total variability that will be preserved. The percentages of variance are 42.84%; 16.86%, and 11.64% for the axes F1, F2; and F3 respectively. They are sufficient (the total information was estimated to be 71%) to describe the information provided by the data matrix (Figure 3).
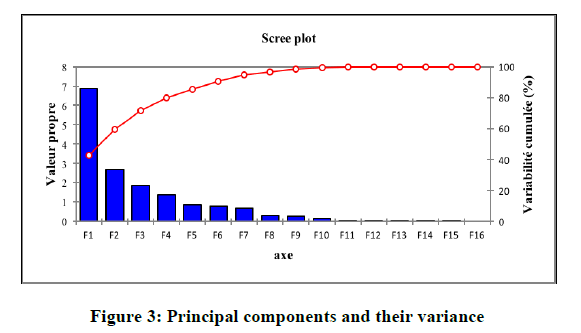
Figure 3: Principal components and their variance
The principal component analysis (PCA) was conducted to identify the link between the different variables. The Pearson correlation coefficients are summarized in the following Table 4 as a correlation matrix and in Figure 4. These descriptors are represented in a correlation circle. Bold values are different from 0 at a significance level of p=0.05.
| Variables | Et | E HUMO | E LUMO | μ | PW | D | αe | LogP | PSA | NHA | NHD | N rotb | J | TC | TVC | PIC50 |
|---|---|---|---|---|---|---|---|---|---|---|---|---|---|---|---|---|
| Et | 1 | -0.114 | -0.052 | 0.187 | -0.49 | -0.785 | 0.228 | -0.57 | 0.555 | 0.459 | 0.263 | 0.241 | 0.337 | -0.598 | -0.468 | -0.059 |
| EHUMO | -0.114 | 1 | -0.078 | -0.147 | 0.252 | -0.049 | 0.089 | 0.074 | -0.072 | 0.042 | -0.409 | 0.166 | 0.162 | 0.114 | 0.121 | -0.32 |
| E LUMO | -0.052 | -0.078 | 1 | -0.024 | 0.068 | -0.05 | -0.093 | -0.164 | -0.016 | 0.08 | -0.304 | 0.186 | 0.047 | 0.11 | 0.018 | 0.091 |
| μ | 0.187 | -0.147 | -0.024 | 1 | 0.115 | -0.095 | 0.207 | -0.299 | 0.458 | 0.368 | 0.461 | 0.238 | 0.039 | -0.428 | -0.502 | -0.075 |
| PW | -0.49 | 0.252 | 0.068 | 0.115 | 1 | 0.263 | 0.572 | -0.122 | 0.353 | 0.462 | -0.308 | 0.528 | 0.475 | -0.217 | -0.212 | -0.403 |
| D | -0.785 | -0.049 | -0.05 | -0.095 | 0.263 | 1 | -0.377 | 0.591 | -0.536 | -0.597 | 0.183 | -0.569 | -0.433 | 0.4 | 0.243 | 0.335 |
| αe | 0.228 | 0.089 | -0.093 | 0.207 | 0.572 | -0.377 | 1 | -0.381 | 0.749 | 0.72 | -0.02 | 0.52 | 0.776 | -0.777 | -0.531 | -0.51 |
| LogP | -0.57 | 0.074 | -0.164 | -0.299 | -0.122 | 0.591 | -0.381 | 1 | -0.822 | -0.856 | 0.071 | -0.754 | -0.509 | 0.599 | 0.584 | -0.084 |
| PSA | 0.555 | -0.072 | -0.016 | 0.458 | 0.353 | -0.536 | 0.749 | -0.822 | 1 | 0.952 | 0.204 | 0.734 | 0.686 | -0.873 | -0.734 | -0.267 |
| NHA | 0.459 | 0.042 | 0.08 | 0.368 | 0.462 | -0.597 | 0.72 | -0.856 | 0.952 | 1 | -0.073 | 0.903 | 0.711 | -0.724 | -0.617 | -0.343 |
| NHD | 0.263 | -0.409 | -0.304 | 0.461 | -0.308 | 0.183 | -0.02 | 0.071 | 0.204 | -0.073 | 1 | -0.374 | -0.206 | -0.372 | -0.31 | 0.122 |
| N rotb | 0.241 | 0.166 | 0.186 | 0.238 | 0.528 | -0.569 | 0.52 | -0.754 | 0.734 | 0.903 | -0.374 | 1 | 0.577 | -0.372 | -0.338 | -0.413 |
| J | 0.337 | 0.162 | 0.047 | 0.039 | 0.475 | -0.433 | 0.776 | -0.509 | 0.686 | 0.711 | -0.206 | 0.577 | 1 | -0.658 | -0.548 | -0.46 |
| TC | -0.598 | 0.114 | 0.11 | -0.428 | -0.217 | 0.4 | -0.777 | 0.599 | -0.873 | -0.724 | -0.372 | -0.372 | -0.658 | 1 | 0.836 | 0.192 |
| TVC | -0.468 | 0.121 | 0.018 | -0.502 | -0.212 | 0.243 | -0.531 | 0.584 | -0.734 | -0.617 | -0.31 | -0.338 | -0.548 | 0.836 | 1 | 0.065 |
Table 4: Correlation matrix (Pearson (n)) between different obtained descriptors
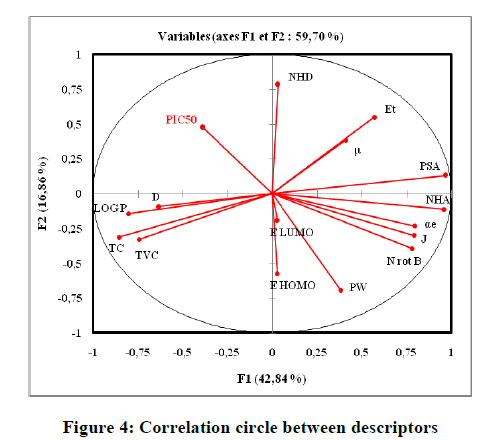
Figure 4: Correlation circle between descriptors
In the correlation matrix, we have: PSA and NHA are perfectly correlated (r=0. 9521), both variables are redundant. NHA and Nrotb are correlated (r=0. 9028). NHA and LogP are negatively correlated (r=-0. 8557). Consequently, the number of H-bonds acceptors (NHA), and the polar surface area (PSA) are removed. In the projection of the compounds on the plane of the two first axes, F1, and F2 (Figure 5), they are distributed into homogenous clusters. The congeners are categorized into the tree following groups:
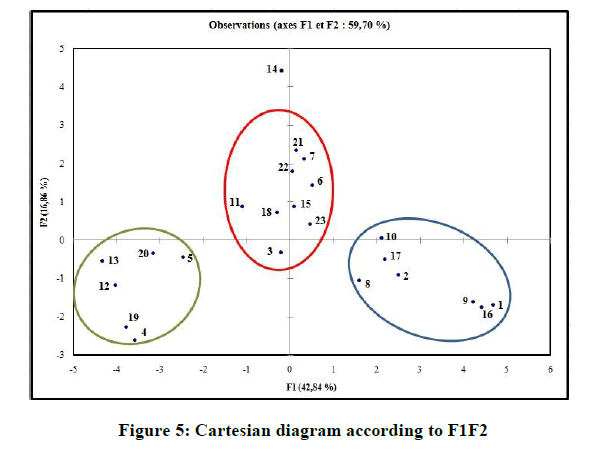
Figure 5: Cartesian diagram according to F1F2
(i) Congeners 1, 2, 8, 9, 10, 16, 17, are congeners with the presence of more than one methoxy group at the Moiety C ; (ii) Congeners 3, 6, 7, 11, 14, 15, 18, 21, 22, 23, are substituted of heterocyclic ring systems like quinoline or indole and (iii) Congeners 4, 5, 12, 13, 19, 20 with the presence of halogens on Moiety B. Congener 14, is quite special; it is an indol-5-yl substitution on Moiety C and has exerted potent cytotoxicity on A549 cancer cells. PCA results suggest that our dataset composed essentially of tree groups of compounds. All compounds of the same group have similar structural characteristics, which suggest that those molecules may have the same behavior concerning the relation between the structures and their anti-proliferative activity.
Multiple linear regressions (MLR)
The Multi linear regression method was used to find the best correlation models from selected non-collinear descriptors. On the basis of the highest R, R2 and F values in the step-wise regression procedure. The selection of the final equation consists of comparison of R2 and F augmentation of the statistical parameters of the best descriptor equations.
The QSAR models built using descendant and stepwise multiple linear regression methods are represented by the following equations:
Descendant MLR:
pIC50=-18. 51822 + 0. 03563 × μ - 0. 08168 × PW + 23. 52605 × D + 0. 56897 × αe - 0. 89027 × LogP - 0. 99671 × NHD + 0.86191 × Nrotb - 3. 29358E-7 × J +18131 × TC – 211497 × TVC (7) R=0.845; R2=0.985; Q2=0.671; MSE=0.095; p-value < 0.05 for Pr< 0.0001.
Regression model are significant (Table 5) at p-value < 0.001 (means that we would be taking a lower than 0.001% risk in assuming that the null hypothesis is wrong) using the F statistics. The p-value is the observed significance probability of obtaining a greater F value by chance alone if a model fits no better than the overall response mean. Therefore, we can conclude with confidence that the models do bring a significant amount of information. The leave on-out-cross-validated correlation coefficient LOO (Q2 =0.67), greater than 0.50 indicates the reliability of the model and qualifies the model as valid. As a result of the lowest p-value, an optimum fit was found to require 10 descriptors (PW, LogP, NHD, J, TVC, μ, D, αe, Nrotb, TC). Positive values in the regression coefficients show that the indicated variables (μ, D, αe, Nrotb, TC) contribute positively to the value of pIC50, where a negative value in the regression coefficient of variable (PW, LogP, NHD, J, TVC), contribute negatively to the value of pIC50. Increasing μ, D, αe, Nrotb, TC can increase the activity, and decreasing PW, LogP, NHD, J, TVC can also increase the activity. The predicted values computed using the MLR model which the experimental values for the training and the sets are shown in Table 6, and plotted in Figure 6.
| Source | DDL | Sum of squares | Means squares | F | Pr> F |
|---|---|---|---|---|---|
| Model | 10 | 4.2679 | 0.4268 | 47.548 | < 0.0001 |
| Error | 7 | 0.0628 | 0.009 | ||
| Total corrected | 17 | 4.3307 |
Table 5: Analysis of variance
| No. of Compd. | pIC50 Values against cancer cell line | ||||||||
|---|---|---|---|---|---|---|---|---|---|
| Observed | MLR | PLS | ANN | CV | |||||
| Pred. | Resid. | Pred. | Resid. | Pred. | Resid. | Pred. | Resid. | ||
| 1 | 4.824 | 4.832 | -0.008 | 4.714 | 0.11 | 4.824 | 0 | 5.01 | -0.186 |
| 2 | 5.06 | 5.097 | -0.036 | 5.084 | -0.023 | 5.06 | 0 | 5.08 | -0.02 |
| 3 | 4.917 | 5.015 | -0.098 | 5.364 | -0.447 | 4.941 | -0.024 | 5.01 | -0.093 |
| 4 | 5.036 | 5.028 | 0.009 | 5.136 | -0.1 | 5.036 | 0 | 5.04 | -0.004 |
| 5 | 4.86 | 4.88 | -0.02 | 5.364 | -0.504 | 4.905 | -0.045 | 5.06 | -0.2 |
| 6 | 5.06 | 5.091 | -0.031 | 5.575 | -0.515 | 5.062 | -0.001 | 5.19 | -0.13 |
| 7 | 5.201 | 5.078 | 0.123 | 5.564 | -0.363 | 5.199 | 0.001 | 5.03 | 0.171 |
| 8 | 5.027 | 5.046 | -0.019 | 4.786 | 0.241 | 5.028 | -0.001 | 5.16 | -0.133 |
| 9 | 4.936 | 5.938 | -1.002 | 5.049 | -0.114 | 4.935 | 0 | 4.94 | -0.004 |
| 10 | 5.432 | 6.27 | -0.838 | 5.588 | -0.156 | 5.432 | 0 | 5.58 | -0.148 |
| 11 | 6.222 | 6.178 | 0.044 | 5.819 | 0.403 | 6.222 | 0 | 5.75 | 0.472 |
| 12 | 6.301 | 6.3 | 0.001 | 5.65 | 0.651 | 6.193 | 0.108 | 5.93 | 0.371 |
| 13 | 5.854 | 5.859 | -0.005 | 5.631 | 0.223 | 5.854 | 0 | 5.86 | -0.006 |
| 14 | 6.222 | 6.202 | 0.02 | 6.04 | 0.182 | 6.222 | 0 | 6.22 | 0.002 |
| 15 | 6.398 | 6.403 | -0.005 | 5.541 | 0.857 | 6.068 | 0.329 | 6.49 | -0.092 |
| 16 | 5.208 | 5.174 | 0.034 | 4.914 | 0.294 | 5.161 | 0.047 | 5.06 | 0.148 |
| 17 | 5.444 | 5.433 | 0.01 | 5.424 | 0.02 | 5.443 | 0 | 5.75 | -0.306 |
| 18 | 5.678 | 5.679 | -0.002 | 5.786 | -0.108 | 5.678 | 0 | 5.62 | 0.058 |
| 19 | 5.538 | 5.597 | -0.059 | 5.491 | 0.047 | 5.537 | 0 | 5.48 | 0.058 |
| 20 | 5.509 | 5.376 | 0.132 | 5.652 | -0.143 | 5.509 | 0 | 5.55 | -0.041 |
| 21 | 5.983 | 5.708 | 0.275 | 5.958 | 0.025 | 5.983 | 0 | 5.51 | 0.47 |
| 22 | 5.538 | 5.65 | -0.113 | 5.913 | -0.375 | 5.538 | 0 | 5.51 | 0.028 |
| 23 | 5.943 | 5.913 | 0.03 | 5.454 | 0.489 | 5.943 | 0 | 5.71 | 0.233 |
Table 6: Observed values and calculated of pIC50 according to different methods
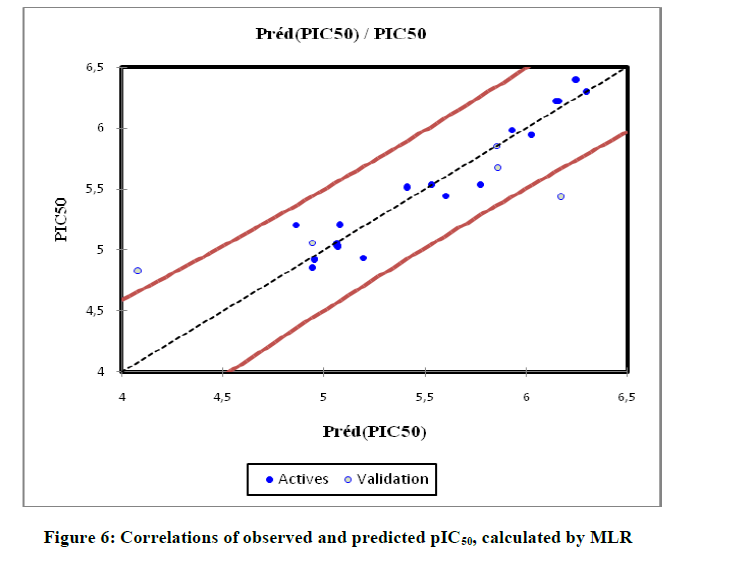
Figure 6: Correlations of observed and predicted pIC50, calculated by MLR
Artificial neural networks (ANN)
In order to increase the probability of good characterization of studies compounds, neural networks (ANN) was used to generate predictive models of quantitative structure–activity relationships (QSAR) between a set of molecular descriptors obtained from the MLR and observed activity. The correlations coefficients obtained with the Neural network (R=0.991), show that the selected descriptors by MLR are pertinent and that the model proposed to predict activity is relevant. R=0.991; R2=0.981; MSE=0.094; Q2=0.98. The values of predicted activities calculated using ANN is given in Table 6.
Partial least squares (PLS)
We submitted the data matrix constituted obviously from the descriptors proposed by MLR corresponding to the 23 molecules, to the partial least squares (PLS). This method used the coefficients R, R2, Q2 and the F- values to select the best regression performance. The QSAR models built using partial least squares (PLS) method is represented by the following equation:
pIC50 =11.50863167648 + 2.81567237468288E-02 × μ -4.68290961356534E-03 × PW + 1.3298815382869 × D -7.83673724381542E-02 × αe - 0.413562186612193 × LogP + 0.167836396208886 × NHD - 7.93428175234133E-02 × N rotb -3.72803469016281E-07 × J + 672.162502794494 × TC -176652.27401151 × TVC (8)
R=0.701; R2=0.557; MSE =0.106; Q2=0.5.
As can be seen from Figure 7, the VIF values of all ten descriptors are smaller than 5.0, indicating that there is no collinearity among the selected descriptors and that the resulting model has good stability. The descriptors: αe, LOG P, J, D, Nrotb are the most significant in the model. The values of predicted pIC50 calculated from Equation 8 and the observed values are given in Table 6. The correlations of predicted and observed activities calculated using PLS is illustrated in Figure 8.
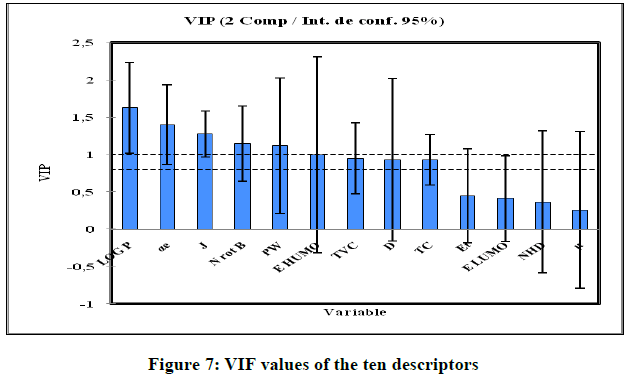
Figure 7: VIF values of the ten descriptors
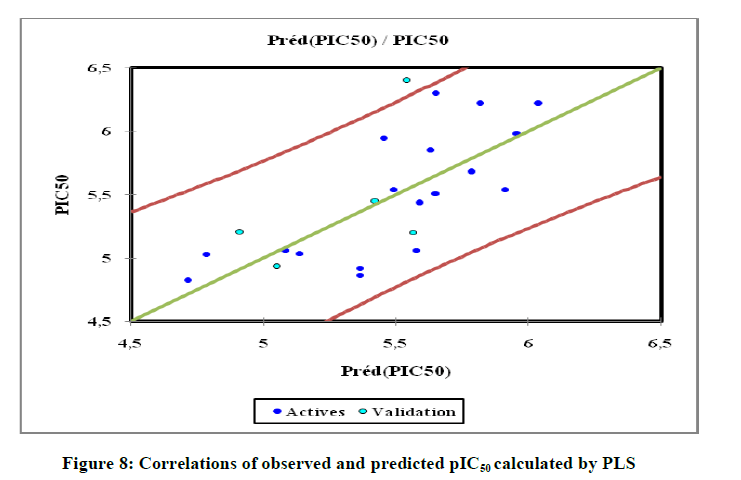
Figure 8: Correlations of observed and predicted pIC50 calculated by PLS
Validation of model-cross validation
In order to assess the significance of the model, an internal validation (leave-on-out (LOO)) has been used for this propose. We validated our models with cross validation using LOO procedure (using ANN, MATLAB 2016), as an internal test of the quality of the model. The performances of this model are resumed by the following statistical measures obtained:
R=0.933; R2=0.870; MSE=0.094; Q2=0.832
A good correlation was obtained with cross validation (Q2cv=0.832). Consequently, the predictive power of this model is very significant.
The parameters of the performance of the generated models are shown in Table 7. It can be seen that the ANN is statistically better than the MLR and PLS model and has a better predictive ability and good internal stability. Also the ANN model has the highest cross validation coefficient (Q2=0.98). However, both the results obtained by the PLS and MLR should be regarded as satisfactory for predicting anticancer activity using the proposed descriptors.
| Method/parameter | R | R2 | Q2 | MSE |
|---|---|---|---|---|
| MLR | 0.845 | 0.985 | 0.671 | 0.095 |
| ANN | 0.991 | 0.981 | 0.98 | 0.094 |
| PLS | 0.701 | 0.557 | 0.5 | 0.106 |
Table 7: The statistical results of MLR, PLS, and ANN models with validation techniques
Conclusion
In this contribution several studies have been reviewed where a combination of DFT and 2D-QSAR has led to predictive and meaningful models. Our present attempt to correlate the experimental anticancer activity against lung adenocarcinoma epithelial cell line with ten calculated molecular descriptors has led to relatively successful QSAR models that relate this pharmacological and medicinal activity to structural characteristics of the drugs. Notably, all descriptors appearing in the regression equations and the study of the quality of RLM., PLS., and ANN models indicated that the ANN results exhibit better prediction capability and the model was validated successfully by leave-one-out-cross-validation.
Acknowledgement
The authors are grateful to the “Association Marocaine des Chimistes Théoriciens (AMCT)” for help on computation software.
References
- A.E. Rashad, A.E. Mahmoud, M.M. Ali, Eur. J. Med. Chem., 2011, 46, 1019-1026.
- A.H. Shamroukh, M.E. Zaki, E.M. Morsy, F.M. Abdel-Motti, F.M. Abdel-Megeid, Arch. Pharm. Chem. Life Sci., 2007, 340, 236-243.
- M.L. Fasio, M.L. Errea, N.B. D’Accorso, J. Med. Chem., 2015, 90, 666-83-83.
- M.V.R. Reddy, B. Akula, S.C. Cosenza, C.M. Lee, M.R. Mallireddigari, V.R. Pallela, D.R.C.V. Subbaiah, A. Udofa, E.P. Reddy, J. Med. Chem., 2012, 55, 5174-5187.
- I. Bin Sayeed, K.R. Garikapati, V.K.K. Makani, A. Nagarajan, M.A. Shareef, A.A. Alarifi, M. Pal-Bhadra, A. Kamal, Med. Chem., 2017, 2, 6480-6487.
- L. Xie, X. Zhai, L. Ren, H. Meng, C. Liu, W. Zhu, Y. Zhao, Chem. Pharm. Bull., 2011, 59, 984-990.
- S. Chatterjee, A. Hadi, and B. Price, Regression Analysis by Examples, Wiley VCH, New York, 2000.
- A.D. Becke, J. Chem. Phys., 1993, 98, 5648.
- C. Lee, Phys. Rev. B, 1988, 37, 785.
- C. Lee, W. Yang, R.G. Parr, Phys. Rev. B Condens. Matter., 1988, 37, 785-789.
- Adamo and Baron, 2000, Parc&Grimme, Gaussian 03, 2003.
- ACDLABS 10, Advanced Chemistry Development, Inc., Toronto, On, Canada, 2015, http://www.acdlabs.com.
- Chembio Office, PerkinElmer Informatics, 2010, http://www.cambridgesoft.com.
- Zaki, Mor. J. Chem., 2017, 5, 202-211.
- G.W. Snedecor, W.G. Cochran, Statistical Methods, Oxford and IBH, New Delhi, 1967, 381.
- E.X. Esposito, A.J. Hopfinger, and J.D. Madura, Methods in Molecular Biology, 2004, 275, 131-213.
- XLSTAT 2009 Add-in software, XLSTAT Company, www.xlstat.com.
- MATLAB (R2016a), and statistics Toolbox Release 2016a, The Math Works, Inc... Natick, Massachussetts, United States, 2016.
- I.T. Jolliffe, Principal Component Analysis, New-York, NY: Springer, 2nd (Edn.), 2002.
- S. Chtita, M. Bouachrine, T. Lakhlifi, Modélisation de molécules organiques hétérocycliques biologiquement actives par des méthodes QSAR/QSPR. Recherche de nouveaux médicaments, Chimie Faculté des sciences, Meknès, 2017.
- J. Zupan, J. Gasteiger, 2nd (Edn.) VCH, Weinheim, 1999.
- H. Martens, T. Næs, Multivariate calibration, John Wiley& Sons, Chichester, 1989.
- T. D. Mark, T. Puzyn, J. Leszczynski, M.T. Cronin, Recent Advances in QSAR Studies, Springer, edition, 2010.
- H. Hazhazi, H. Zaki, M. Benlyas, Y. Filali-zergouti, Y. Boumedjane, M. Bouachrine, IJEAB, 2017, 256.
- L. Eriksson, J. Jaworska, A. Worth, M.T.D. Cronin, R.M. Mc Dowell, P. Gramatica, Environmental Health Perspec., 2003, 111, 1361-1375.
- Marvin Sketch 5.11.4, Chem Axon, 2012.


