Research Article - Der Pharma Chemica ( 2023) Volume 15, Issue 2
Aluminium corrosion inhibition in 2M H2SO4 by three organics antipyretics molecules (Meloxicam, Piroxicam and Tenoxicam): Adsorption, Thermodynamic, DFT, PCA and QSPR studies
Kalifa Mariko1, Diabate Donourou2, Koffi Affouet Aurelie1 and Niamien Paulin Marius1*2Universite Peleforo gon Coulibaly, BP 1328 Korhogo, Cote D'Ivoire
Niamien Paulin Marius, Universite Felix Houphouet Boigny, 22 BP 582, Abidjan 22, Cote D'Ivoire, Email: niamienfr@yahoo.fr
Received: 04-Feb-2023, Manuscript No. dpc-23-89659; Editor assigned: 06-Feb-2023, Pre QC No. dpc-23-89659; Reviewed: 20-Feb-2023, QC No. dpc-23-89659; Revised: 21-Feb-2023, Manuscript No. dpc-23-89659; Published: 28-Mar-2023, DOI: 10.4172/0975-413X.15.2.21-34
Abstract
Adsorptions of organic antipyretic molecules (Meloxicam, Tenoxicam and Piroxicam) were investigated at various concentrations and temperatures, using the gravimetric technique. The increase in the concentration of these molecules increased the effectiveness of inhibition efficiency, while the increase in temperature resulted in a decrease in the effectiveness of inhibition efficiency. Adsorption and activation enthalpies and entropies were determined and analysed. Molinspiration software was used to determine molecular properties like molecular weight (M), Total polar surface area (TPSA) and molecular volume (Vm). Density Functional Theory (DFT) was used to determine the other molecular descriptors: the highest occupied molecular orbital energy EHOMO, the lowest unoccupied molecular orbital energy ELUMO, the energy gap , the dipole moment , the global electronegativity , the global hardness (η) and softness , the electrophilicity index (ω) and the fraction of electrons transferred (Δ????). Fukui functions and the dual descriptors were also determined. Later, Principal Component Analysis (PCA) and Quantitative Structure Property Relationship (QSPR) approaches were used to establish mathematical relations between the inhibition efficiency and some sets of molecular parameters.
Keywords
Antipyretic molecules; Sulfuric acid; Aluminium; Gravimetric method; Corrosion inhibition; DFT; PCA; QSPR models
INTRODUCTION
Aluminium, a light silvery white weight metal is used in many applications such as power lines, tall buildings, window frames, consumer electronics, aeronautical components, ships, etc. It is due to its special properties: ductile and highly malleable, excellent heat and electricity conductor. Metallic aluminium and its oxide and hydroxide are nontoxic.
Although chemically active, aluminium is netherveless highly resistant to corrosion because of its hard oxide film on its surface. However, in very aggressive environments, corrosion occurs.
Nowadays, organic molecules forming adsorbed protective films [1-3] are used to protect metal from corrosion. They often have heteroatoms O, N, S in their structures. To reduce the corrosion rate they limit oxygen diffusion and water access to the metal surface.
The gravimetric method [4] is used in this work in order to access to the mass loss which is linked to the inhibition efficiency of the molecule. The experimental results are generally used to fit adsorption models as Langmuir, El-Awady, Freundlich, etc. The thermodynamic functions of adsorption and activation (ΔG,ΔH,ΔS) [5-7] are determined and used to elucidate the type of adsorption and the corrosion process. To obtain information on the inhibition efficiency and the molecular parameters, we used Molinspiration software in order to access to molecular weight (M), molecular polar surface area (SP) and molecular volume (Vm). The DFT (Density Functional Theory) [8-10] was also used to access to the molecular descriptors such as the lowest unoccupied molecular orbital energy (ELUMO), the highest occupied molecular orbital energy (EHOMO), the energy gap (ΔE), the global electronegativity (X), the hardness (), the softness (σ), the electrophilicity index (ω) of the molecules and their fraction (ΔN) of electron transferred whose values tell us about the mechanism by which the molecule protects the metal. In order to get information on electron exchange sites, we determined the Fukui functions (fkα) and the dual descriptors (δfk) for each of the studied molecules.
Nowadays, developing a QSPR (Quantitative Structure Property Relationship) method [11-13] is important because it helps to predict the behaviour of molecules of the same family. So it can guide scientists in their choices of new organic molecules for preventing the metal corrosion. In this context, we used PCA and QSPR methods to establish mathematical relations to show the correlation between the inhibition efficiency EI (%) and some sets of molecular parameters.
MATERIALS AND METHODS
Experimental device is composed of a thermostatic bath (SELECTA), which maintains the temperature measured by a thermometer, a chronometer to control the time of contact between the metal and its environment and an analytical electronic METLER balance (precision ± 0.1 mg).
Material
The molecules structures (Figure 1) were first obtained using the Molinspiration software (carbon: grey; hydrogen: white; oxygen: red ; nitrogen: blue and sulfur: yellow).

Figure 1. Chemical structures of Meloxicam (a), Piroxicam(b) and Tenoxicam(c)
These organic molecules with heteroatoms and of purity (P>99%) were obtained from Alibaba (China).
Gravimetric method
Weight loss measurement was performed using aluminium samples in the form of rods measuring 10 mm by 2.5 mm of diameter, cut from commercially pure aluminum.
The corrosive solution of 2M H2SO4 was prepared by dilution of analytical grade sulfuric acid solution (P = 98%, d = 1.84, M = 98.08g/mol). The samples were polished with different emery papers, washed thoroughly with double distilled water, degreased with acetone solution (P = 99.5%, d = 0.79, M = 99.5%) from MERCK, dried in a desiccator and weighed. The samples were immersed for 2 hours in a beaker containing the corrosive solution with or without the tested molecule; they were then retrieved, washed to remove the corrosion products, using bristle brush, rinsed and weighed again. All tests were made in aerated solutions and were triplicated to guarantee the reliability of the results. The corrosion rate W in (g/cm2.s) was obtained using the following relation:
Where ��1 and ��2 are respectively the weight in gram before and after immersion. S (in cm2) is the total surface area in contact with the liquid and t is the immersion time in s. The surface coverage θ, was obtained from the corrosion rate as follows:
Where W0 and W are respectively, the corrosion rate without and in presence of the studied molecule. The inhibition efficiency EI(%)) is giving by :

Computational Details
All the calculations have been performed by resorting to Density Functional Theory (DFT) methods, using Gaussview 05 (graphical interface) and Gaussian 09W programs. The calculations were realised using B3LYP/6-31 G(d) level [14, 15]. The quantum chemical descriptors like chemical hardness (��), chemical electronegativity (��), chemical potential (μ��), global electrophilicity index (��), electron affinity (Α) and ionisation potential (��) were defined in terms of the highest occupy molecular orbital energy (EHOMO) and the lowest unoccupied molecular orbital energy (ELUMO). For N-electrons system with total energy��, the electronegativity (��) and the chemical potential (���� ) [16] are given as follows:

The chemical hardness (��)[17] which is defined as the second derivative of �� with respect to �� is given by:
Where ��(��) is the external potential of the system. The ionisation potential (��) and the electronic affinity (��) are given by:


The chemical softness (��) which measures the molecular reactivity is given by:
The global electrophilicity which expresses the propensity to accept electrons is given bellow:

The fraction of electrons transferred from an inhibitor to a metallic surface is given by:

With (������=4.28 ���� and ������=0) [18] The Fukui functions [19] which can be utilized in determining the reactivities of molecules towards the metallic surfaces are given by:
Where ���� is the charge of the atom, according to the Mulliken population. The electrophilic and the nucleophilic functions are:


Where N+1, N and N-1 are respectively the number of electrons in the case of anionic, neutral and cationic species. Even if the Fukui function reveals nucleophilic or electrophilic region in a molecule, only the dual descriptor can indicates unambiguously such regions. This dual function [20] is given by:
Principal Component Analysis (PCA)
The Principal Component Analysis (PCA) is used to reduce the dimensionality of the data set consisting of large number of interrelated variables, while retaining as much as possible of variation present in the data set.
QSPR methods
After selection of sets of descriptors, multiple linear and non-linear regressions were employed to develop models with the following forms:


Where ����, ���� and ���� are components of a set of three parameters whereas ���� is the concentration of the inhibitor and Res is the residual.
RESULTS AND DISCUSSION
Gravimetric method
The evolution of the inhibition efficiency with concentration and temperature is presented in Figure 2.

Figure 2. derpharmachemica-versus
The curves show that inhibition efficiency increases when the concentration increases, but it decreases with increase in temperature. Thus, we can observe that:
For Meloxicam:
- T = 298 K, IE = 61.11% for C = 0.01mM and IE = 88.89% for C = 10 mM ; - T = 338 K, IE = 27.54% for C = 0.01Mm and IE = 63.77% for C = 10 mM.
For Piroxicam:
- T = 298 K, IE = 33.33% for C = 0.01mM and IE = 94.45 % for C = 10 mM ; - T = 338 K, IE = 4.35% for C = 0.01mM and IE = 47.83% for C = 10 mM.
For Tenoxicam:
- T = 298 K, IE = 66.67% for C = 0.01mM and IE = 94.45 % for C = 10 mM ; - T = 338 K, IE =21.74% for C = 0.01mM and IE = 55.07 % for C = 10 mM.
Adsorption isotherm

The nature of the interactions between the metallic surface and the inhibitor molecules during the corrosion inhibition process can be understand [21] by the use of adsorption characteristics of the molecules. In this study, the degree of surface coverage for a given temperature was fitted into many adsorption isotherms. The results were best fitted by the Langmuir adsorption isotherm [22] which equation is given by:
Figure 3 gives the straight lines deduced from the obtained results. Although the determination coefficients obtained are very close to the unit, we observe that the slopes of the lines are different from the unit, which reflects the existence of interactions between adsorbed molecules. The Langmuir adsorption isotherm cannot therefore be applied rigorously: the modified Langmuir isotherm called Villamil isotherm [23], the equation for which is given below, must therefore be used:

Figure 3. Langmuir adsorption isotherms, (a): Meloxicam, (b) : Piroxicam, (c): Tenoxicam
Adsorption thermodynamic functions
According to Villamil isotherm, ���� is the effective degree of surface coverage. So, adsorption constant �������� can be calculated using equations (18 and 19). The adsorption free enthalpy can be obtained by using the following equation:

Where the ��������0 is the free standard energy of adsorption; �� is the perfect gas constant and �� is the absolute temperature. The number 55.5indicates the concentration of water in solution in mol. L-1. The values of the slopes, intercept, �������� and ��������0 are listed in Table 1.
| Molecule | T(K) | Slope | Intercept | R2 | K_ads (mol-1) | ã??â??Gã??_ads0(kJ.mol-1) |
|---|---|---|---|---|---|---|
| . Meloxicam | 298 | 1.1268 | 0.1131 | 0.999 | 8.841.73 | -32.45 |
| 308 | 1.1647 | 0.1378 | 0.999 | 7256.89 | -33.03 | |
| 318 | 1.5025 | 0.1514 | 0.999 | 6605.02 | -33.54 | |
| 328 | 1.5639 | 0.1546 | 0.999 | 6468.30 | -34.08 | |
| 338 | 1.5790 | 0.2455 | 0.996 | 4073.32 | -34.63 | |
| Piroxicam | 298 | 1.0588 | 1.0588 | 0.996 | 4066.69 | -30.53 |
| 308 | 1.3948 | 1.3948 | 0.999 | 4677.27 | -31.01 | |
| 318 | 1.8481 | 1.8481 | 0.998 | 4074.98 | -31.58 | |
| 328 | 2.0246 | 2.0246 | 0.992 | 2158.43 | -31.87 | |
| 338 | 2.1080 | 2.1080 | 0.993 | 2096.00 | -32.76 | |
| Tenoxicam | 298 | 1.0604 | 0.0992 | 0.999 | 10080.6 | -31.80 |
| 308 | 1.1036 | 0.1224 | 0.999 | 8169.9 | -32.40 | |
| 318 | 1.7172 | 0.2019 | 0.999 | 4952.9 | -33.10 | |
| 328 | 1.7896 | 0.2521 | 0.999 | 3966.7 | -33.50 | |
| 338 | 1.8043 | 0.2732 | 0.999 | 3660.3 | -34.30 |
The values of ��������0 are more negative than -20 kJ.mol-1 (for physisorption) and less negative than - 40 kJ. mol-1 (for chemisorption) : this reflects that the studied molecules adsorb [24] on the aluminium surface via competitive physical and chemical adsorption mechanisms. Figure 4 gives the plots of ��������0 versus ��. The observed negative values of ��������0 reflect spontaneous adsorption.

Figure 4. ��������0 versus �� for (a) : Meloxicam, (b) : Piroxicam and (c) : Tenoxicam
The changes in enthalpy (��������0) and entropy (��������0) are related to the change on free adsorption enthalpy by the basic equation below:

The obtained plots are straight lines with slopes (-��������0) and intercepts (��������0). The obtained values are listed in Table 2.
| Molecule | (kJ. mol-1) | (J. mol-1.K-1) |
|---|---|---|
| Meloxicam | -16.34 | 54.1 |
| Piroxicam | -14.63 | 53.2 |
| Tenoxicam | -13.62 | 61.0 |
The negative values of ��������0 reflect the exothermic behaviour of the adsorption of the studied molecules on the aluminium. The values of change in adsorption entropy are positive, showing [25] an increase in disorder, what can be explained by a quasi-substitution process between organic compounds in solution and water molecules adsorbed on the metallic surface.
DFT studies
To gain further insights into the interactions between the studied molecules and the aluminium surface, DFT calculations were performed. So, we have determined the quantum chemical descriptors which are important due to their influence on electronic interaction between the studied molecules and the metal surface. The descriptors are listed in Table 3.
| MELOXICAM | PIROXICAM | TENOXICAM | |
|---|---|---|---|
| EHOMO (eV) | -5.646 | -6.091 | -6.276 |
| ELUMO (eV) | -2.280 | -2.144 | -2.410 |
| ΔE (eV) | 3.366 | 3.947 | 3.866 |
| μ (D) | 5.8414 | 4.9742 | 3.4580 |
| I (eV) | 5.646 | 6.091 | 6.276 |
| A (eV) | 2.280 | 2.144 | 2.410 |
| χ (eV) | 3.963 | 4.117 | 4.343 |
| η (eV) | 1.683 | 1.973 | 1.933 |
| (eV-1) | 0.594 | 0.507 | 0.517 |
| ΔN | 0.094 | 0.041 | -0.016 |
| ω (eV) | 4.666 | 4.295 | 4.878 |
| ET (Hartree) | -1802.76 | -1442.69 | -1763.46 |
Donor –acceptor interactions occur between frontier molecular orbitals (HOMO and LUMO) of interacting/reacting species according to Fukui’s frontier orbital approximation [26]. The highest occupied molecular orbital (HOMO) is an indicator of the tendency of the molecule to donate electrons to the d-orbital of the metal, the aluminium in our case ([Ne]3s23d1). A high energy value (EHOMO) indicates a better tendency to donate electron and a better inhibition efficiency. In our work, the values of EHOMO (-5.646 eV, -6.091 eV and -6.276 eV) respectively, for Meloxicam,Piroxicam and Tenoxicam can be considered as high referring to the literature [27-29], showing that the studied molecules can give electrons to the aluminium. On the other way around, ELUMO indicates the ability to accept electrons, therefore a low value of ELUMO, indicates a better ability to accept electrons. In our work, the obtained values of ELUMO are respectively -2.280 eV, -2.410 eV and -2.144 eV, for Meloxicam, Piroxicam and Tenoxicam. These low values [30, 31], referring to the literature show that the studied molecules can accept electrons from aluminium.
Another important parameter is the energy gap �� :

�� is an important reactivity parameter ; when this parameter decreases [32], the reactivity of the molecule increases, what indicates a good inhibition character of the molecules leading to a good inhibition efficiency. The obtained values in this work are smaller than 5 eV, what shows [33] that the studied molecules are good inhibitors.
The global hardness (��) which has the same trend with the energy gap give information about the reactivity of the molecule. Higher values of this parameter lead to a weak reactivity and lower values to good reactivity. This parameter acts contrarily to the global softness (��).
Electronegativity (��) is one the parameters that express the inclination to accept or give electrons. When two systems are brought together, electrons will flow from the component with lower value of electronegativity to that of higher value until the chemical potentials became equal.Therefore, the fraction of electrons transferred (Δ��) calculated for the three molecules show [34] that it is probable that Meloxicam, and Piroxicam with positive values of electrons transferred (Δ��=0.094 and Δ��=0.041 respectively) give electrons to the aluminium while Tenoxicam, with a negative value of electrons transferred (Δ��=−0.016) accepts electrons from the metal.
Considering the values of the electrophilicity parameters (��=4.666 ����,��=4.295 ����,��=4.878 ����) respectively, for Meloxicam, Piroxicam and Tenoxicam, and observing the high values of this parameter [35], one can deduce that the three molecules can receive electrons from the aluminium.
Local reactivity parameters
In order to get information on each part of a molecule, based on its behaviour due to the nature of substituent functional groups, we used the Fukui function [36, 37] which permit the distinction of all sites via the electrophilic (����−) and the nucleophilic (����+) Fukui functions or the dual function (Δ����). Table 4 contained the determined parameters.
| Molecule | Atom | q_k (N+1) | q_k (N+1) q_k (N) | q_k (N-1) | f_k^+ | f_k^- | â??f_k |
|---|---|---|---|---|---|---|---|
| Meloxicam | N(26) | -0.417127 | -0.458395 | -0.411929 | 0.041268 | -0.046466 | 0.087734 |
| O(27) | -0.625305 | -0.594176 | -0.650716 | -0.031129 | 0.056540 | -0.087669 | |
| Piroxicam | C(13) | 0.602161 | 0.664672 | 0.667164 | -0.062511 | -0.002492 | -0.060019 |
| C(16) | 0.056621 | 0.105375 | 0.235375 | -0.048754 | -0.130000 | 0.081246 | |
| Tenoxicam | C(3) | 0.240700 | 0.277123 | 0.257104 | -0.036423 | 0.020019 | -0.056442 |
| N(19) | -0.651026 | -0.653254 | -0.600629 | 0.002228 | -0.052625 | 0.054853 |
This table shows that:
- N (26), C (16), N (19), respectively on Meloxicam, Piroxicam and Tenoxicam are the nucleophilic attacks centers.
- O (27), C (13), C (3), respectively on Meloxicam, Piroxicam and Tenoxicam are the electrophilic attacks centers.
The HOMO and LUMO orbitals related to the Fukui functions and the dual functions are given by Figure 6.

Figure 5. Optimized structures of Meloxicam, Piroxicam and Tenoxicam obtained with B3LYP/6-31 G (d)

Figure 6. HOMO and LUMO orbitals of Meloxicam (a), Piroxicam (b) and Tenoxicam (c)
PCA and QSPR
We divided the parameters into sets of three quantum chemical parameters by using a matrix of correlation, referring to PCA. In order to obtain Quantitative Structure-Property Relationship (QSPR) models which are means of correlating experimental inhibition efficiency to molecular descriptors? Multiple linear and non-linear regressions were used to predict effects on the inhibition efficiency. QSPR models assume that changes in molecular structures are reliable to changes in the observed quality of a model. The precision of the answer depends on the selection of descriptors. Reducing [38] the number of variables in a data set is naturally done at the expense of accuracy, but the trick in reducing dimensionality is to exchange a bit of precision for simplicity.
| IE(%) | EHOMO | ELUMO | ΔE | μ | M | δNO | Vm | ω | η | ΔN | |||
| IE(%) | 1 | ||||||||||||
| EHOMO | -0.958 | 1 | |||||||||||
| ELUMO | 0.013 | 0.273 | 1 | ||||||||||
| ΔE | 0.992 | -0.913 | 0.142 | 1 | |||||||||
| μ | -0.778 | 0.925 | 0.618 | -0.690 | 1 | ||||||||
| M | -0.956 | 0.833 | -0.305 | -0.986 | 0.559 | 1 | |||||||
| δNO | -0.883 | 0.980 | 0.457 | -0.815 | 0.982 | 0.707 | 1 | ||||||
| Vm | -0.829 | 0.954 | 0.549 | -0.749 | 0.996 | 0.628 | 0.994 | 1 | |||||
| ω | -0.155 | -0.133 | -0.989 | -0.282 | -0.499 | 0.438 | -0.326 | -0.424 | 1 | ||||
| η | 0.992 | -0.914 | 0.140 | 0.999 | -0.958 | 0.985 | -0.816 | 0.751 | 0.279 | 1 | |||
| χ | 0.806 | -0.942 | -0.581 | 0.723 | -0.999 | 0.598 | -0.989 | -0.999 | 0.458 | 0.724 | 1 | ||
| ΔN | -0.855 | 0.968 | 0.507 | -0.781 | 0.991 | 0.666 | 0.998 | 0.999 | -0.378 | -0.782 | -0.996 | 1 | |
Linear and non-linear models are based on sets of three descriptors : one (�� ���� EHOMO ���� Δ��) highly and the two (ELUMO and ω) weakly correlated to inhibition efficiency. So, a dependent variable (descriptor) is associated to two independent descripors. The objective is to minimize the difference between experimental and predicted values. According to this paradigm, the constituted sets are (��, ELUMO, ω), (EHOMO, ELUMO, ω) and (Δ��, ELUMO, ω). The constants in the systems of equations were determined using EXCEL software. All the obtained constants are given in Table 5 (linear form) and Table 6 (non-linear form).
| C_i (μM) | (, ELUMO, ω) | ( E_HOMO,E_LUMO,ω) | (â??E,E_LUMO,ω) | ||||||
|---|---|---|---|---|---|---|---|---|---|
| A | B | D | A | B | D | A | B | D | |
| 10 | -21.939 | -154.704 | -66.372 | 10.926 | -165.061 | -66.125 | 10.926 | 154.135 | -66.125 |
| 100 | -1.243 | -9.123 | -3.867 | 0.619 | -9.710 | -3.853 | -0.619 | -9.091 | -3.853 |
| 500 | -0.146 | -1.132 | -0.469 | 0.073 | -1.201 | -0.468 | -0.073 | -1.128 | -0.468 |
| 1000 | -0.066 | -0.513 | -0.210 | 0.033 | -0.544 | -0.209 | -0.033 | -0.511 | -0.209 |
| 5000 | 0.0057 | 0.0239 | 0.0132 | -0.00283 | 0.02656 | 0.01313 | 0.00283 | 0.02373 | 0.01313 |
| 10000 | 0.00794 | 0.04639 | 0.02171 | -0.00395 | 0.0501 | 0.0216 | 0.004 | 0.0462 | 0.022 |
| C_i (μM) | (, ELUMO, ω) | ( E_HOMO,E_LUMO,ω) | (â??E,E_LUMO,ω) | ||||||
|---|---|---|---|---|---|---|---|---|---|
| A | B | D | A | B | D | A | B | D | |
| 10 | -1.235 | -9.473 | -4.149 | 0.6150 | -10.0550 | -4.1350 | -0.6153 | -9.4407 | -4.1355 |
| 100 | -0.1357 | -1.0844 | -0.4766 | 0.0676 | -1.1485 | -0.4751 | -0.0676 | -1.0809 | -0.4751 |
| 500 | -0.0342 | -0.2841 | -0.1254 | 0.01704 | -0.3003 | -0.1250 | -0.0170 | -0.2832 | -0.1250 |
| 1000 | -0.0279 | -0.2339 | -0.1035 | 0.01388 | -0.24703 | -0.1032 | -0.01388 | -0.23315 | -0.10316 |
| 5000 | -0.00690 | -0.06642 | -0.02975 | 0.00344 | -0.0697 | -0.0297 | -0.0034 | -0.0662 | -0.0297 |
| 10000 | -0.0041 | -0.0598 | -0.0275 | 0.00205 | -0.06171 | -0.0275 | -0.00205 | -0.05966 | -0.0275 |
In order to determine the best set in each type of models, we use the following statistical criteria:


Where ������������ and ������â??������ are experimental and theoretical values of the inhibition efficiency. N is the number of observations.
Figures 7 and 8 give IE(%) theo versus IE(%)exp respectively for the two types of models.

Figure 7. IEtheo(%) versus IE exp(%) for the linear models

Figure 8. IEtheo (%) versus IEexp(%) for non-linear models
The values of the statistical parameters are listed in Table 7.
| Type of Model | (η,E_(LUMO,) ω) | (E_HOMO,E_LUMO,ω) | (â??E,E_LUMO,ω) | ||||||
|---|---|---|---|---|---|---|---|---|---|
| R2 | RMSE | MPD | R2 | RMSE | MPD | R2 | RMSE | MPD | |
| Linear | 0.9989 | 0.1597 | 0.0058 | 0.9984 | 0.1556 | 0.0063 | 0.9985 | 0.1566 | 0.0060 |
| Non-linear | 0.9966 | 0.2373 | 0.0104 | 0.9992 | 0.1279 | 0.0050 | 0.9994 | 0.0990 | 0.0031 |
According to the literature [38] the best model is that with the highest value of the determination coefficient (R2), the smallest value of RMSE and the smallest value of MPD. Thus, one can see that (��,����������,��) is the best set for the linear models, while (��,����������,��) is the best set for the non-linear models.
The use of Principal Component Analysis (PCA) allows reducing the number of variables of the data set, while preserving as much information as possible. In order to access to principal components, we use for each of the three sets, the correlation matrix which allows determining eigenvectors and eigenvalues of the covariance matrix. So, the obtained results for:
- For the best linear set (��,����������,��) - The correlation matrix is:
| η | ELUMO | ω | |
| η | 1 | 0.140162 | -0.2799863 |
| ELUMO | 0.140162 | 1 | -0.98977 |
| ω | -0.2799863 | -0.98977 | 1 |
The eigenvalues and eigenvectors are given below:
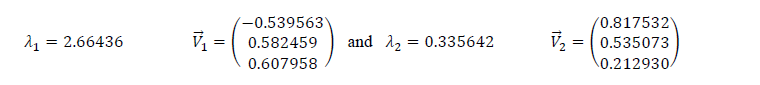
Ranking eigenvalues in descending order, we have ��1>��2, which means that the eigenvector that correspond to the first component (PC1) is ��â?? 1 and the one that corresponds to the second component (PC2) is ��â?? 2.
- For the best non-linear set (����,����������,��) - The correlation matrix is:
| ΔE | ELUMO | ω | |
| ΔE | 1 | 0.141607 | -0.281387 |
| ELUMO | 0.141607 | 1 | -0.98977 |
| ω | -0.281387 | -0.98977 | 1 |
The eigenvalues and eigenvectors are given below:
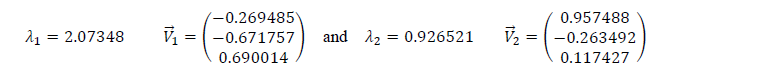
We have ��1>��2, which means that the eigenvector that correspond to the first component (PC1) is ��â?? 1 and the one that corresponds to the second component (PC2) is ��â?? 2.
We must noticed that for the two sets, the third eigenvalue is nearly zero. So, this component can’t be taken into account.
T
he pourcentage of information accounted for each component is given by:
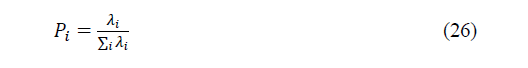
Where ���� is the eigenvalue for the component (PCi). All the calculated values are listed in Table 8.
| P1 | P2 | |||
|---|---|---|---|---|
| (η,E_(LUMO,) ω) | 88.81 | 11.19 | ||
| (ΔE,E_(LUMO,) ω) | 69.12 | 30.88 | ||
From this Table, one can see that for the best linear set, all the information is nearly contained in the first component (≈90%) whereas for the best non-linear set, even if the higher percentage is in the first component (≈69%), the percentage for the second component (≈31%) must also be taking into account. Observing the obtained results, we can see that for it is possible to use a set of two descriptors for each model: (��,����������) for the linear model and (Δ��,����������) for the non-linear model. So, the mathematical models are based on the following equations:


The calculated coefficients in the linear model are listed in Table 9 and the representation of IEtheo (%) versus IEexp (%) is given by Figure 9.
| Ci (μM) | A | B | D |
|---|---|---|---|
| 10 | -7.01060 | -12.07180 | -0.02630 |
| 50 | -0.37344 | -0.81396 | -0.00153 |
| 100 | -0.04040 | -0.12303 | -0.00019 |
| 1000 | -0.01920 | -0.06163 | -0.000083 |
| 5000 | 0.00271 | -0.00447 | 0.0000052 |
| 10000 | 0.00305 | -0.00026 | 0.0000086 |

Figure 9. IEtheo(%) versus IEexp(%)
All the calculated coefficients in the non-linear model are listed in Table 10 and the representation of IEtheo (%) versus IEexp (%) is given by Figure 10.
| Ci (μM) | A | B | D |
|---|---|---|---|
| 10 | -0.05580 | -0.54700 | -0.90260 |
| 50 | -0.00338 | -0.05911 | -0.10339 |
| 100 | -0.00015 | -0.01443 | -0.02720 |
| 1000 | 0.00006 | -0.01129 | -0.02245 |
| 5000 | 0.00057 | -0.00243 | -0.00646 |
| 10000 | 0.00168 | -0.00053 | -0.00605 |

Figure 10. IEtheo(%) versus IEexp(%)
One can see that the use of PCA reduces the number of descriptors. Thus two descriptors can be used instead of three.
CONCLUSION
This study focused on the effects of three organic antipyretics molecules (Meloxicam, Piroxicam and Tenoxicam) on aluminium corrosion in sulfuric acid 2M solution. The results obtained showed that the three molecules are effective inhibitors of aluminium corrosion in this medium. The thermodynamic functions proved that the adsorption of these molecules is spontaneous, exothermic and it has been noted that the increase of disorder shows the replacement of water molecules by the studied organic ones. Their adsorption process is composed of physorption and chemisorption. DFT calculations lead to molecular descriptors. The use of PCA helped in the choice of the pertinent descriptors and showed its reducing character of the datasets.
REFERENCES
- Zhao YS, Yang W, Zhang G, et al., Eng Aspects. 2005, 277: p 111-118.
- Sherif EM, Park SM, Electrochimica Acta. 2006, 55: p. 4665-4673.
- Bade S, Shitole NV, Lonkar NM, J Chem Technol Res. 2014, 6: p 1865-1872.
- Usman AD, Okoro LN, Chem Sci Rev Lett. 2015, 4: p 17-24.
- Benali O, Larabi L, Tabti B, Anti-Corrosion Methods and Materials. 2005, 52: p 280-285.
- Sudhish KS, Ebenso EE, Int J Electrochem Sci. 2011, 6: p 3277-3291.
- Abd El Rehim SS, Sayyah SM, El Deeb MM, et al., Int J Indu Chem. 2016, 7: p39-52.
- Li X, Deng S, Xie X, Corrosion Science. 2014, 81: p 162-175.
- Obot IB, Obi-Egbedi NO, Collo Surfaces A: Physic Engi Aspects. 2008, 330: p 207-212.
- Adejoro A, Akintayo DC, Ibeji CU, Jordan J of Chem. 2016, 11: p 38-49.
- Lukovits I, Shaban A, Kalman E. Russ J Electrochem. 2003, 39: p. 177-181.
- El Ashry SH, El Nemr A, Ragab S. J Mol Model. 2012, 18: p. 1173-1188.
- Aboelnga MM, Awad MK, Gauld JW, et al., J Mol Model. 2014, 20: p. 2422-2439.
- Lee C, Yang W, Parr RG. Phys Rev B Condens Matter Mater Phys. 1988, 17: p. 785-789.
- Parr RG, Yang W. Oxford University Press, Oxford, UK. 1989, 16.
- Parr RG, Donnelly DA. J Chem Phys. 1993, 98: p.5648-5652.
- Parr RG, Pearson RG. J Am Chem Soc. 1983, 105: p. 7512-7516.
- Pearson RG. Inorg Chem. 1988, 27: p. 734-740.
- Parr RG, Yang W. J Am Chem Soc. 1999, 121: p. 1922-1924.
- Morell C, Grand A, Torro-Labbé A. J Phys Chem. 2005, 109: p. 205-212.
- Goulart CM, Esteves-Souza A, Martinez-Huitle CA, et al., Corros Sci. 2013, 67: p. 281-291.
- Sahin M, Bilgic S, Yilmaz H. Appl Surf Sci. 2002, 195: p. 1-7.
- Villamil RF, Corio P, Rubim JC, et al., Electroanalytical Chemistry. 1999, 472: p. 112-119.
- Sasikumar Y. J Mol Liq. 2015, 211: p.105-118.
- Moretti G, Quartarone G, Tassan A, et al., Werkst Korros. 1994, 45: p. 641-647.
- Bereket G, Ogretir C, Ozssahin C. J Mol Struct. 2003, 663: p. 39-46.
- Musa AY, Kadhum AH, Mohamed AB, et al., J Mol Struc. 2010, 969: p. 233-237.
- El-Ashry ESH, El-Nemr A, Esawy SA, et al., Electrochimia Acta. 2006, 51: p. 3957-3968.
- El- Lateef AHM, Abo-Riya MA, Tantawy AH. Corros Sci. 2016, 108: p. 94-110.
- Arshad MN, Bibi A, Mahmood T, et al., Molecules. 2015, 20: p. 5851-5874.
- Singh A, Ansari KR, Kumar A, et al., J Alloys Compounds. 2017, 712: p. 121-133.
- Seo H, Roh Y. J NanoScience and Nanotehnology. 2015, 15: p. 5649-5652.
- El-Issami S, Bazzi L, Mihit M, et al., Pigm Resin Technol. 2007, 36: p. 161-168.
- Lukovits I, Kalman E, Zucchi F. Corrosion. 2001, 57: p. 3-8.
- Parr RG, Szentpaly LV, Liu S. J Amer Chem Society. 1999, 121: p. 1922-1924.
- Allison TC, Tong YJ. Electrochimica Acta. 2012, 101: p. 334-340.
- Farver J, Merz KM. J Chem Theory Comput. 2010, 6: p. 548-559.
- Moradi F, Gharaghani S, Keyranpour M. 6 th conference on bioinformatics, Tehran, Iran, 2016.
Indexed at, Goggle scholar, Crossref
Indexed at, Goggle scholar, Crossref
Indexed at, Goggle scholar, Crossref
Indexed at, Goggle scholar, Crossref
Indexed at, Goggle scholar, Crossref
Indexed at, Goggle scholar, Crossref
Indexed at, Goggle scholar, Crossref
Indexed at, Goggle scholar, Crossref
Indexed at, Goggle scholar, Crossref
Indexed at, Google Scholar, Crossref
Indexed at, Google Scholar, Crossref
Indexed at, Google Scholar, Crossref
Indexed at, Google Scholar, Crossref
Indexed at, Google Scholar, Crossref
Indexed at, Google Scholar, Crossref
Indexed at, Google Scholar, Crossref


