Research Article - Der Pharma Chemica ( 2024) Volume 16, Issue 1
Analytical Method Development for Dorzolamide Using UV Spectroscopy
Sachin Kothawade1*, Shubhangi Albhar1, Vijaykumar Wakale2, Sandesh Bole1, Kunal Raut3, Prashant Patil1, Jay prakash Suryawanshi4, Payal Navasupe3, Rachana Hajare3, Sharmila Kuskar1, Vaibhav Wagh3 and Vishal Pande12Department of Pharmaceutical Chemistry, Samarth Institute of Pharmacy, Belhe, Pune, Maharashtra, India
3Department of Pharmaceutical Chemistry, RSM'N. N. Sattha College of Pharmacy, Ahmednagar, Maharashtra, India
4Department of Pharmacognosy, RSM's N. N. Sattha College of Pharmacy, Ahmednagar, Maharashtra, India
Sachin Kothawade, Department of Pharmaceutics, RSM’s N. N Sattha College of Pharmacy, Ahmednagar, Maharashtra, India, Email: Sachin.kothawade23@gmail.com
Received: 22-Dec-2023, Manuscript No. DPC-23-123311; Editor assigned: 27-Dec-2023, Pre QC No. DPC-23-123311 (PQ); Reviewed: 10-Jan-2024, QC No. DPC-23-123311; Revised: 12-Jan-2024, Manuscript No. DPC-23-123311 (R); Published: 02-Feb-2024, DOI: 10.4172/0975-413X.16.1.172-177
Abstract
The development and evaluation of an analytical technique for the UV spectroscopy based determination of Dorzolamide is the main focus of this study. Dorzolamide, a carbonic anhydrase inhibitor, is utilized to reduce intraocular pressure in the treatment of ocular hypertension and openangle glaucoma. The study involved establishing the maximum wavelength (λmax) of Dorzolamide HCL as 253 nm, confirmed by UV spectra in different media. The method's validation included linearity testing, where a calibration curve exhibited a strong correlation (R2=0.9995) in simulated tear fluid. Accuracy studies demonstrated a high precision of 98%-100%, while precision tests, both intra-day and inter-day, indicated a %RSD of less than 2%, confirming the method's reliability. The method's sensitivity was assessed with Limit of Detection (LOD) and Quantification (LOQ) found as 0.37 μg/ml and 1.12 μg/ml, respectively. Robustness and ruggedness assessments further supported the method's reliability, with %RSD values within acceptable ranges. The developed UV spectroscopy method for Dorzolamide analysis exhibits excellent accuracy, precision, sensitivity and robustness, making it a valuable tool for pharmaceutical quality control.
Keywords
Dorzolamide; UV spectroscopy; Analytical method development; Validation; Linearity; Accuracy; Precision
Introduction
Dorzolamide functions as a carbonic anhydrase inhibitor. By inhibiting carbonic anhydrase, it reduces the production of fluid and lowers intraocular pressure [1,2]. The IUPAC exemption of the compound is (4S, 6S)-4-(ethylamino)-6-methyl-7,7-dioxo-5, 6-dihydro-4H-thieno [2,3-b] thiopyran-2 sulfonamide. Figure 1 displays the chemical composition of Dorzolamide. Dorzolamide is prescribed for the treatment of ocular hypertension, a condition characterized by elevated intraocular pressure, commonly associated with open-angle glaucoma [3-5]. It aids in the prevention of progressive vision loss or visual impairment by reducing elevated intraocular pressure [6-7].

Figure 1. Structure of Dorzolamide.
Materials and Methods
Preparation of stock solution of DRZ in STF at pH 7.4
Preparation of Simulated Tear Fluid (STF): All the ingredients were weighed as mentioned in table and transferred to 100 ml distilled water. All the ingredients were made soluble completely and pH of tear fluid was determined and pH of the STF was found to be 7.4 (Table 1).
| S. no. | Ingredient | Quantity |
|---|---|---|
| 1 | Sodium bicarbonate | 0.02 g |
| 2 | Calcium chloride di hydrate | 0.008 g |
| 3 | Sodium chloride | 0.67 g |
| 4 | Distilled water | Up to100 ml |
Table 1: 3D structure of potential inhibitors (targets) against dementia.
Estimation of λ max
To ascertain λ max of Dorzolamide, it took place truthfully weighed (10 mg) and dispersed in 100 ml STF to produce concentration 100 μg/ml. From this 1 ml was taken and diluted up to 10 ml by simulated tear fluid to prepare 10 μg/ml. The sample's UV spectrum, which occupies 200 nm-400 nm, was recorded.
Preparation of stock solution of DRZ
Standard stock solution of Dorzolamide: After precisely weighing about 10 mg of the medication, it was added to a calibrated 10 ml volumetric flask. It was dispersed in STF and using the same solvent, the volume had been increased to 10 ml to achieve the ultimate concentration of 1000 μg/ml.
Working stock solution: By pipetting out 1 ml of the standard stock solution and diluting it up to 10 ml with STF, the standard stock solution was further diluted to create a working standard solution of 100 μg/ml. Pipetting out 0.2, 0.4, 0.6, 0.8 and 1 ml of the working standard solution was used to create a series of DRZ dilutions into separate 10 ml volumetric flasks and diluting to volume with STF to produce the concentrations varying from 2 μg/ml-10 μg/ml. The previously mentioned solutions had been scanned between 400 and 200 nm in relation to blank (STF). The λmax was recorded and the absorbance of all solutions was measured against STF as blank at that specific λmax. The absorbance at λmax was graphed against the concentration (2 μg/ml-10 μg/ml) to create the calibration curve.
Linearity and range
Five different concentrations were used to prepare five solutions at different concentrations of 2, 4, 6, 8 and 10 (μg/ml) for the linearity study. The resulting data were then used for the linearity plot.
Accuracy
Recovery studies were prepared at three distinct concentrations (2, 6 and 10 μg/ml) of DRZ and three separate versions of the absorbance results were taken to verify the accuracy of the method. Standard Deviation (SD) and percentage Relative Standard Deviation (RSD) were computed from the collected data.
Precision
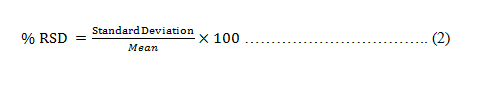
By examining three distinct concentrations repeatedly (2, 6 and 10 μg/ml) of the standard DRZ solution on three separate days and at various times within the same day (intraday precision) (interday precision), the method's precision was assessed in simulated tear fluid (pH 7.4). To determine the intraday and interday precision of the method, the entire calibration curve's range was represented by for every three concentrations, three duplicates (2, 6 and 10 μg/ml), which were then analyzed and denoted as a percentage of Relative Standard Deviation (RSD) as given in equation 2.
Limit of Detection (LOD)
The lowest amount of the drug that the technique can detect is known as the limit of detection. Limit of detection is calculated as given in equation 3.
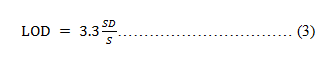
Where, SD = Standard Deviation of Y-intercept S= Calibration curve's slope.
Limit of Quantification (LOQ) The smallest amount of the medication that the method can measure is known as the limit of quantification. Limit of quantification is calculated using equation 4.
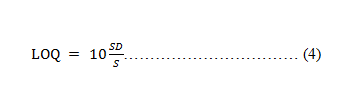
Where, SD=Standard Deviation of Y-intercept S= Calibration curve's slope.
Robustness
The analysis was performed at three different wavelengths (i.e., 253 ± 2) to determine the robustness of the method. The corresponding absorbance was recorded and the result was expressed as a percentage RSD.
Ruggedness
By having two separate analysts perform the analysis and record the corresponding absorbance, the robustness of the approach was ascertained. % RSD was used to indicate the end result.
Results and Discussion
Determination of λmax of Dorzolamide HCL
The stock solution of Dorzolamide HCL has a maximum wavelength of 253 nm, which is consistent with the literature. Figure 2 illustrate the UV spectra of the drug in various media. Furthermore, overlay of Dorzolamide HCL gives constant absorption peak irrespective of concentration as shown in Figure 3.

Figure 2. UV Spectra of DRZ HCL in STF.

Figure 3. Overlay spectra of DRZ HCL.
Validation of UV spectrophotometric analytical method
Linearity/ calibration curve of Dorzolamide HCL: In the concentration varying of 2 μg/m-10 μg/ml, a plot of absorbance vs. concentration of Dorzolamide HCL follows Beer Lamberts law. For values ranging from 2 to 10 μg/ml, a high correlation straight line calibration curve was obtained (Figure 4).

Figure 4. Calibration curve of DRZ HCL in STF.
The method's linearity was tested in water and artificial tear fluid at concentrations varying from 2 to 10 g/ml. Every sample's absorbance was measured and recorded in triplicate. Figures 4 show the calibration curves for Dorzolamide HCl in simulated tear fluid. Simulated tear fluid has excellent correlation coefficients of R2=0.9995; Y=0.0889x+0.0105 was found to be the regression equations. The reduced amount of error (<2%) suggests that the regression equation has a strong prediction potential (Table 2) [8-11].
| Sr. No. | Concentration (µg/ml) | Absorbance in STF |
|---|---|---|
| 1 | 0 | 0 |
| 2 | 2 | 0.1944 |
| 3 | 4 | 0.3761 |
| 4 | 6 | 0.5421 |
| 5 | 8 | 0.7245 |
| 6 | 10 | 0.8937 |
Table 2: Concentration and its absorbance in STF.
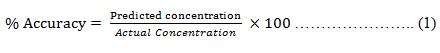
Accuracy
To test the analytical method's accuracy, three dilutions of the drug 2, 6 and 10 μg/ml were made in simulated tear fluid. Accuracy was ascertained using the standard curve's regression equation. Tables 3 demonstrate the results. The accuracy was determined to be between 98 and 100 percent. As a result, the analytical approach passes the parameter accuracy test.
| Sr. no. | Concentration (µg/ml) | Predicted conc (µg/ml) | Accuracy (%) |
|---|---|---|---|
| 1 | 2 | 1.96 ± 0.17 | 98.12% |
| 2 | 6 | 5.95 ± 0.012 | 99.80% |
| 3 | 10 | 9.92 ± 0.05 | 99.42% |
Table 3: Accuracy studies.
Precision
The analytical method's precision was assessed using three different drug concentrations, namely 2,6,10 μg/ml. The standard deviation and percent RSD were calculated using the data obtained. Tables 4 and 5 exhibit the data. Since %RSD was found to be less than 2%, given method passes the test for precision.
Intra-day precision: On the same day, three distinct DRZ HCL concentrations were tested in triplicate to determine how repeatable the procedure was. The percent RSD for intraday precision was determined to precise at concentrations of 2,6,10 μg/ml.
Inter-day precision: On a separate day, the repeatability of the procedure was examined in triplicate for three distinct DRZ HCL concentrations. The percent RSD for intraday precision was determined to precise at concentrations of 2,6,10 μg/ml (Tables 4 and 5).
| Time | Actual concentration | ||
|---|---|---|---|
| LQC (2 µg/ml) | MQC (6 µg/ml) | HQC (10 µg/ml) | |
| Predicted concentration (µg/ml) | |||
| 10.00 am | 1.963 ± 0.017 | 6.008 ± 0.035 | 9.843 ± 0.089 |
| 1.00 pm | 1.950 ± 0.018 | 5.96 ± 0.047 | 9.986 ± 0.078 |
| 5.00 pm | 1.972 ± 0.014 | 6.01 ± 0.052 | 10.04 ± 0.074 |
| Mean | 1.96 | 5.992 | 9.95 |
| S.D | 0.016 | 0.044 | 0.08 |
| % RSD | 0.81 | 0.73 | 0.8 |
| % Accuracy | 98.12 | 99.73 | 99.5 |
Table 4: Results for three determinations of the intraday precision (%RSD) and accuracy for the estimation of Dorzolamide HCL in a day.
| Days | Actual concentration | ||
|---|---|---|---|
| LQC (2 µg/ml) | MQC (6 µg/ml) | HQC (10 µg/ml) | |
| Predicted concentration (µg/ml) | |||
| 1 | 1.99 ± 0.01 | 5.9 ± 0.033 | 9.36 ± 0.09 |
| 2 | 1.92 ± 0.007 | 5.973 ± 0.04 | 9.81 ± 0.04 |
| 3 | 1.954 ± 0.008 | 5.987 ± 0.02 | 10.09 ± 0.07 |
| Mean | 1.95 | 5.95 | 9.75 |
| S.D | 0.008 | 0.031 | 0.06 |
| %RSD | 0.41 | 0.52 | 0.61 |
| %Accuracy | 99.06 | 99.49 | 99.02 |
Table 5: Results for three determinations of the intraday precision (%RSD) and accuracy for the estimation of Dorzolamide HCL in a day.
Limit of Detection (LOD)
The term "limit of detection" refers to the lowest dosage of the medication that the method can identify. LOD=3.3 (σ/s) Where, σ is standard deviation S is a slope obtained from calibration curve equation LOD was determined to be 0.37 μg/ml.
Limit of Quantification (LOQ)
The smallest amount of the medication that the technique can measure is known as the limit of quantification. LOQ=10 (σ/s) Where, σ is standard deviation S is a slope obtained from calibration curve equation LOQ was found to be 1.12 μg/ml.
Robustness and ruggedness
The method was observed within the range and was found to be robust, as indicated by the % RSD. Furthermore Tables 6 and 7 shows the robustness and ruggedness data respectively.
| λmax | Concentration (µg/ml) |
Absorbance | Statistical analysis |
|---|---|---|---|
| 251 | 6 | 0.5457 | Mean=0.5510 SD=0.005 %RSD =1.06 |
| 253 | 6 | 0.5574 | |
| 255 | 6 | 0.5510 |
Table 6: Robustness parameter for validation.
| Analyst | Concentration (µg/ml) | Absorbance | Mean | SD | %RSD |
|---|---|---|---|---|---|
| 6 | 0.5375 | 0.5391 | 0.001 | 0.31 | |
| Analyst 1 | 6 | 0.5409 | |||
| 6 | 0.5389 | ||||
| 6 | 0.5411 | ||||
| Analyst 2 | 6 | 0.5387 | 0.5397 | 0.001 | 0.22 |
| 6 | 0.5395 |
Table7: Ruggedness parameter for validation.
Conclusion
The developed UV spectroscopy method for Dorzolamide analysis proves to be a robust and reliable tool for pharmaceutical applications. The method demonstrated accurate determination within a concentration range of 2 μg/ml-10 μg/ml, as validated by strong correlation coefficients and low error percentages. Precision tests, both intra-day and inter-day, exhibited %RSD values below 2%, indicating the method's consistency. Sensitivity assessments with LOD and LOQ values of 0.37 μg/ml and 1.12 μg/ml, respectively, highlighted the method's capability to detect and quantify low concentrations of Dorzolamide. Robustness and ruggedness evaluations further confirmed the method's stability and suitability for routine analysis. This UV spectroscopy method holds promise for enhancing the pharmaceutical quality control of Dorzolamide formulations, ensuring reliable and accurate dosage preparations for the treatment of ocular conditions.
References
- Sugrue MF. J Ocul Pharmacol Ther. 1996; 12(3): p. 363-376.
[Crossref] [Google Scholar] [PubMed]
- Supuran CT, Altamimi AS, Carta F. Expert Opin Ther Pat. 2019; 29(10):781-792.
[Crossref] [Google Scholar] [PubMed]
- Kouchak M, Malekahmadi M, Bavarsad N, et al. Drug Dev Ind Pharm. 2018; 44(8): p. 1239-1442.
[Crossref] [Google Scholar] [PubMed]
- Jayanetti V, Sandhu S, Lusthaus JA. J Exp Pharmacol. 2020: 16(4): p. 539-548.
[Crossref] [Google Scholar] [PubMed]
- Mansouri K, Tanna AP, De Moraes CG, et al. Surv Ophthalmol. 2020; 65(2): p. 171-186.
[Crossref] [Google Scholar] [PubMed]
- Nguyen T, Combs EM, Wright PJ, et al. Home Healthc Now. 2021; 39(4): p. 186-193.
[Crossref] [Google Scholar] [PubMed]
- Yang C, Huang X, Li X, et al. Adv Sci. 2021; 8(6): p. 200-297.
[Crossref] [Google Scholar] [PubMed]
- Tambe S, Jain D, Amin P. Spectrochim Acta A Mol Biomol. 2021; 14(5): p. 119-168.
[Crossref] [Google Scholar] [PubMed]
- Alva-Ensastegui JC, Bernad-Bernad MJ, Vega-Morales JC. J Mol Struct. 2023; 1279(13501): p. 135-316.
- Dinç E, Büker E. Talanta. 2019; 191: p. 248-256.
[Crossref] [Google Scholar] [PubMed]
- Thangabalan B, Kahsay G, Eticha T. J Anal Methods Chem. 2018; 16(7): p. 218-222.
[Crossref] [Google Scholar] [PubMed]
Copyright: Sachin Kothawade, Department of Pharmaceutics, RSMâ??s N. N Sattha College of Pharmacy, Ahmednagar, Maharashtra, India, E-mail: Sachin.kothawade23@gmail.com This is an open access article distributed under the terms of the Creative Commons Attribution License, which permits unrestricted use, distribution, and reproduction in any medium, provided the original work is properly cited.


