Research Article - Der Pharma Chemica ( 2022) Volume 14, Issue 12
Chemometric-Assisted UV method for quantisation of Perindopril and Losartan in tablet dosage form
Vijayalakshmi R1*, Sundar VD2 and Dhanaraju MD22Department of Pharmaceutics, GIET School of Pharmacy, NH-16 Chaitanya Knowledge City, Rajahmundry-533296, India
Vijayalakshmi R, Department of Pharmaceutical Analysis, GIET School of Pharmacy, NH-16 Chaitanya Knowledge City, Rajahmundry-533296, India, Email: vijayalakshmigsp@gmail.com
Received: 30-Nov-2022, Manuscript No. dpc-22-81847; Editor assigned: 02-Dec-2022, Pre QC No. dpc-22-81847; Reviewed: 16-Dec-2022, QC No. dpc-22-81847; Revised: 19-Dec-2022, Manuscript No. dpc-22-81847; Published: 26-Dec-2022, DOI: 10.4172/0975-413X.14.12.11-17
Abstract
In very recent days multivariate calibration techniques are used to resolve mixtures of double or triple compounds with similar spectral characteristics. In many cases, these multivariate methods for the study of spectral data have many more benefits like simple processing and cheaper analysis. These methods have been very often applied for quantitation of drugs, as HPLC methods are tedious and conventional spectroscopic methods were slow, expensive and complex. The work proposal describes new spectrophotometric methods for the concurrent estimation of Perindopril (PRN) and Losartan (LRN) in their mixtures and dosage form. The stated chemometric methods are multivariate techniques including PCR and PLS. These techniques employ the concentration statistics matrix, produced by using the several combinations containing the two drugs dissolved in methanol. The absorbance input matrix related to the concentration was deduced by studying the absorbance in between 200–350 nm at 1 nm intervals on the zero-order spectra which does not require any extraction steps. The accuracy values, precision, and linearity ranges of the methods have been tested, and analysing the combinations having the studied drugs has then been validated. The results confirmed the suitability of the recommended method for the accurate and highly precise analysis of Perindopril and Losartan in pharmaceutical preparations. These developed methods were applied exactly to the formulation mixture preparations without earlier treatment. Also, no expensive laboratory procedure is required. Moreover, the determined techniques are suitable for study without any of the excipient interference.
Keywords
Chemometric assisted spectrophotometric method; Synthetic binary mixtures; Perindopril; Losartan
INTRODUCTION
Chemometrics was introduced in 1972 by SvanteWold [1]. Chemometric analysis is the tool used for extracting data of analytical samples. In the presence of interfering substances during the determination of mixtures including drug combinations; chemometric tools like MLR (Multiple linear regression, PCR(Principal component regression) and PLS utilizing chromatographic/spectrophotometric data can be used [2,3]. In these recent years, the adoption of chemometrics, especially multivariate methods, play a decisive role in the multicomponent analysis of pharmaceutical mixtures [4-7]. The application of PCR and PLS methods for spectral data analysis are being rapidly used for instrumental methods without any separation techniq Chemometrics was introduced in 1972 by SvanteWold [1]. Chemometric analysis is the tool used for extracting data of analytical samples. In the presence of interfering substances during the determination of mixtures including drug combinations; chemometric tools like MLR (Multiple linear regression, PCR(Principal component regression) and PLS utilizing chromatographic/spectrophotometric data can be used [2,3]. In these recent years, the adoption of chemometrics, especially multivariate methods, play a decisive role in the multicomponent analysis of pharmaceutical mixtures [4-7]. The application of PCR and PLS methods for spectral data analysis are being rapidly used for instrumental methods without any separation techniques [8,9]. Multivariate calibration by PCR/PLS have been more often used for simultaneous UV spectrophotometric acquisition of antibiotic/multiple combination dosage forms [10,11], and β-lactam antibiotic binary mixtures [12] in pharmaceutical multicomponent formulations [13].ues [8,9]. Multivariate calibration by PCR/PLS have been more often used for simultaneous UV spectrophotometric acquisition of antibiotic/multiple combination dosage forms [10,11], and β-lactam antibiotic binary mixtures [12] in pharmaceutical multicomponent formulations [13].
Perindopril, (2S)-2-{(1S)-2-carbethoxy butyl amino}-1-oxo propyl-(2s, 3as, 7as)-1-per hydro indole-2-carboxylic acid (The Merck Index Online - Chemicals, Drugs and Biologicals, n.d.) is one of the Acetyl choline esterase inhibitor [14] used in the management of hypertension and also heart attacks. This drug is available in Martindale; the extra pharmacopoeia. Considerable literature survey depicts that the estimation procedure of drug is not available in any official pharmacopoeia and thereby it is essential for more investigation. Few reports on the estimation of perindopril are Initial rate method [15], Amperometric method [16], Spectrophotometric method [17-19], Potentiometric method(R I Stefan, J K Van Staden, 1999), Liquid Chromatography [20], Gas Chromatography [21], High performance Liquid Chromatography [22], Reverse phase Liquid Chromatography [23].
Losartan, 2-n-butyl-4-chloro-1-[p-(o-1H-tetrazol-5-ylphenyl)benzyl]-imidazole-5methanol mono potassium salt is orally active, most selective non-peptide angiotensin II receptor antagonist used for the treatment of hypertension [24]. The quantitation of losartan was tested in tablets by HPLC/capillary electrophoresis/super-critical fluid Chromatography [25]. LRN presence in urine by GC-MS [26] and simultaneously with its active metabolite in biological fluids by HPLC [26-31]. The literature survey evidences application of advanced instrumental methods for the study of PRN alone or in combination with LRN. There is a need for spectrometric methods which are cost-effective and less time consuming.
METHODS
Materials & reagents
PRN and LRN were donated by Aurobindo Pharma Limited, Hyderabad, which were used as reference standards without any further purification. Water & methanol (HPLC grade, Rankem), potassium dihydrogen ortho phosphate & sodium hydroxide (A.R grade, Rankem) was used in the analysis. Commercial tablets claimed to contain 4 mg of PRN and 50 mg of LRN were used in analysis. Perkin Elmer Lambda 25 UV-Vis Double beam spectrophotometer with UV Win lab software was used for spectral studies.
Standard solutions of PRN and LRN
Stock solution of Perindopril (PRN) and losartan (LRN) (1 mg/ml) in methanol by the similar method given by Laxmi et al., with some modifications. For the preparation of PRN working standards, 0.2-0.5 mg/ml of analyte in methanol was prepared by transferring aliquots of stock solution to a 100 ml standard flask and diluted to 100 mL with same solvent. The LRN working standard solution was also prepared in a similarly with the same solvent in the concentration range of 0.02-0.08 mg/ml.
Pharmaceutical Sample preparation
Twenty tablets were weighed precisely and powdered. An equivalent of 4 mg and 50 mg of PRN and LRN, respectively were dissolved separately in 50 ml of diluent. The solutions were sonicated for 10 min and passed through 0.45 μm nylon membrane filter in to a 100 ml volumetric flask and the residues were washed with methanol until the final volume. The proposed chemometry based spectrophotometric techniques were applied and the concentration of each component was determined.
Calibration sets for Chemometric spectrophotometry
The PRN and LRN (12 binary mixtures) of various concentrations were made and were scanned in UV range(200-400 nm) with the levels of 50-150 μg/ml and 10-50 μg/ml for PRN and LRN, respectively. The UV absorption spectra of these samples between 240-270 nm were collected at 1.0 nm intervals over blank. The computations were made in software. PCR and PLS techniques were adopted in the UV absorption data matrix of these mixtures. Detection wavelength was chosen by scanning both the analytes over a range of wavelength from 200-350 nm in a spectrophotometer and the suitable wavelength was found to be 210 nm. Optical and Regression parameters are depicted in table (Table 1).
| Parameters | PRN | LRN |
|---|---|---|
| Calibration range (µg/ml) | 30-Oct | 25-May |
| Detection limit (µg/ml) | 2.12 | 1.2 |
| Quantitation limit (µg/ml) | 7.26 | 3.96 |
| Slope (b) | 0.24 | 0.68 |
| SD of Slope (Sb) | 0.015 | 0.023 |
| RSD of Slope (%) | 0.054 | 0.065 |
| Intercept (a) | 0.526 | 0.415 |
| SD of Intercept (Sa) | 0.34 | 0.46 |
| Correlation coefficient | 0.9997 | 0.9998 |
Preparation of binary mixtures for Chemometric spectrophotometric predictions
Within the stated range various mixed concentrations of PRN and LRN were prepared and used. About 16 synthetic binary mixtures of titled ingredients were separately used as prediction sets during the validation of the proposed methods.
Validation of Proposed method
One among the validation methods is cross validation (internal validation). The rationale behind the application of cross validation is to avoid over fitted models to be determined. In some cases, CV is used for validating the model predictivity when the external data set is not available. It should be used only for assessing the number of the model components and as a starting point in the model evaluation.
PRESS = Σ (yi - yi,hat)2, ………………(7)
RMSECV/RMSEP = √PRESS/I…….(8)
Where PRESS is prediction error of sum of squares, RMSECV is root mean square error of cross validation, yi is the reference value and yi,hat is predicted value of response. ‘I’ is the number of samples. RMSEP is root mean square error of prediction which can be used to determine the model complexity in cross validation.
Recovery studies
Recovery studies were conducted by the proposed method at three different levels 2-4 μg/ml and 10-25 μg/ml of working standard solution of LRN and PRN, respectively. Each concentration was injected and recorded for three times. Known aliquots of standard drug were then added to each previously studied formulation and the total amount of the drug was kept within the linearity limit and estimated again.
Intermediate Precision (Reproducibility)
The intraday & Inter-day precision of the established method was assessed by scan the responses thrice on the same day and on other days for one week at 3 different strengths of standards of PRN (18, 20, and 22 μg /ml) and LRN (16, 18, and 20 μg /ml). The result was stated in terms of relative standard deviation (% RSD).
Statistical parameters:
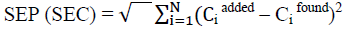
In chemometric methods, the predictive ability of a calibration model can be defined in various ways like standard error of calibration (SEC) and predictions (SEP), which is given by the following equation;
Choosing optimum number of factors for PCR and PLS:
For PCR and PLS methods, 16 calibration spectra were selected for the application of cross validation technique. This allows modelling of the systems and avoidance of over fitting and under fitting, with optimum amount of information. The MSEP was calculated by comparing the predicted concentrations with the actual ones for each of the calibration samples.
RESULTS
The overlain zero-order (UV) spectra of PRN and LRN were recorded. As placed (Figure 1), an overlap between the PRN/LRN upto few wavelengths was noticed. For the establishing chemometric techniques for the quantisation of PRN&LRN in their binary mixtures, ideal states were scrutinised and the absorbance data matrix was achieved by computing the absorbance between 240 and 270 nm.

Figure 1: UV overlain absorption plot of PRN and LRN
To solve the overlapped spectra, to the zero order spectra chemometric calibrations were applied. A calibration set comprising mixtures of PRN and LRN was prepared in 0.1 M NaOH in the concentration range illustrated in table (Table 2). The absorbance in the region of 240-270 nm were obtained from the UV spectra. PCR and PLS algorithms were applied to determine correlation between calibration concentration and its absorbance data. The quality of multi-component analysis is dependent on the spectral mode, wavelength region and the calibration set chosen. The main drawback in development studies of multivariate method has been that all the information present in the sample target should be present in the calibration data set.
| Mixture No. | Concentration, µg/ml | |
|---|---|---|
| PRN | LRN | |
| 1 | 10 | 5 |
| 2 | 10 | 10 |
| 3 | 10 | 15 |
| 4 | 10 | 20 |
| 5 | 15 | 5 |
| 6 | 15 | 10 |
| 7 | 15 | 15 |
| 8 | 15 | 20 |
| 9 | 20 | 5 |
| 10 | 20 | 10 |
| 11 | 20 | 15 |
| 12 | 20 | 20 |
| 13 | 25 | 5 |
| 14 | 25 | 10 |
| 15 | 25 | 15 |
| 16 | 25 | 20 |
These validation mixtures were scrutinized by taking the absorbance between 240-270 nm.
Validation of Proposed method
Recovery studies
The accuracy studies were evaluated by the recovered amount percentage of the standard added to the earlier analysed sample. The optimised method was validated based on the International Conference on Harmonization (ICH) guidelines (Table 3).
| Mixture added | % Recovered | % Recovered by proposed method | |||
|---|---|---|---|---|---|
| PRN | LRN | PRN | LRN | PRN | LRN |
| 2 | 10 | 100.61 | 99.11 | 100.61 | 99.96 |
| 3 | 10 | 101.21 | 104.34 | 101.21 | 101.46 |
| 4 | 10 | 100.34 | 101.23 | 100.34 | 104.21 |
| 2 | 12 | 100.78 | 98.34 | 100.78 | 100.32 |
| 3 | 14 | 99.32 | 102.67 | 99.32 | 101.45 |
| 4 | 16 | 99.99 | 100.35 | 99.99 | 102.56 |
| 2 | 18 | 97.56 | 98.67 | 97.56 | 99.64 |
| 3 | 18 | 99.49 | 99.12 | 99.49 | 99.75 |
| 4 | 20 | 98.34 | 98.53 | 98.34 | 97.34 |
| 2 | 25 | 100.04 | 99.68 | 100.04 | 98.32 |
| 3 | 12 | 100.68 | 100.63 | 100.68 | 99.45 |
| 4 | 12 | 100.12 | 97.45 | 100.12 | 97.34 |
| 2 | 16 | 98.32 | 99.36 | 98.32 | 103.21 |
| 3 | 12 | 100.91 | 97.29 | 100.91 | 100.32 |
| 4 | 18 | 99.63 | 101.99 | 99.63 | 100.45 |
| 2 | 14 | 100.64 | 102.99 | 100.65 | |
The absorbance at several wavelengths is often used to make wavelength selection unnecessary. So, chemo metric techniques are named as full spectral computational procedures. Moreover, studies from non-informative wavelengths in a model will degenerate the performance. Thus, absorbance beyond 290 nm was not used as PRN has no absorbance at the concentration used in this region. Any absorbance data from 290 nm to 400 nm would have caused a significant level of noise thereby minimising the predictive ability of the model and hence the precision of estimation. The reconstructed spectra of the calibration matrix was compared with the original spectra to find the range of selected wavelengths. The range, which is best, reconstructed, was also considered. The spectrum was digitised at 1 nm interval with 40 experimental points per spectrum.
Precision
Precision of the method was assessed as intra- and inter day precision. Percent (%) RSD obtained from PCR and PLS study were <2%, pertaining to the high precision of the method (Table 4).
| Component | Interday precision (% RSD) | Intraday precision (%RSD) | |||
|---|---|---|---|---|---|
| Conc. | PCR | PLS | PCR | PLS | |
| PRN | 18 | 0.94 | 0.99 | 0.84 | 0.79 |
| 20 | 1.12 | 0.96 | 1.32 | 0.86 | |
| 22 | 0.98 | 1.15 | 0.88 | 0.95 | |
| LRN | 16 | 0.87 | 1.29 | 0.86 | 0.99 |
| 18 | 0.92 | 0.99 | 1.24 | 1.12 | |
| 20 | 1.19 | 1.25 | 1.32 | 1.15 | |
Statistical Parameters
The examinations of the standard variation of the chemometric calibrations in the case of the studied mixtures were done. The SEC and SEP were calculated (Table 5,6).
| Component | PCR | PLS | ||||
|---|---|---|---|---|---|---|
| SEC | PRESS | RSE* (%) | SEC | PRESS | RSE* (%) | |
| PRN | 0.0002 | 0.0009 | 0.00114 | 0.00021 | 0.00089 | 0.00114 |
| LRN | 0.000098 | 0.00086 | 0.00078 | 0.000098 | 0.000079 | 0.000784 |
| *Relative standard error of calibration of single component | ||||||
| Component | PCR | PLS | ||||||
|---|---|---|---|---|---|---|---|---|
| SEP | a | b | r | SEP | a | b | r | |
| PRN | 0.0114 | 0.002 | 0.012 | 0.999 | 0.0114 | 0.002 | 0.01 | 0.999 |
| LRN | 0.0784 | 0.003 | 0.013 | 0.998 | 0.0784 | 0.001 | 0.02 | 0.998 |
| *a-intercept, b-slope, r-correlation | ||||||||
Assay of bulk drug and Marketed Preparation
DISCUSSION
The PCR and PLS models were developed for estimation of PRN and LRN. Models were prepared by using calibration standards. CV was followed for validation of the PCR and PLS models in development process to obtain optimum latent variables of the model. To choose the selective latent variables in the PLS/PCR algorithms, CV procedure was adopted. The predicted strengths of the components in every sample was compared with the actual strength of the molecules in each of the validation samples, and the RMSECV was calculated for both methods individually (Figures 2,3). The RMSECV was used as a diagnostic tool for finding the error in the anticipated concentrations. The proper model is the key to get the correct quantitation in PLS and PCR calibrations. All the specifications of the optimum selected models are put down in Table 3. The obtained models were further validated by prediction of the strength of the samples in another validation set which was not used earlier. The outcomes of both prediction and the % recoveries are placed in Table 4. As observed, there was mutual agreement between the aimed and actual concentration of the drugs. The mean recoveries of our proposed methods along with the relative standard deviations were computed and are placed in Table 6 for PRN and LRN, respectively. Satisfactory r2 values were obtained for PRN&LRN in the validation set by PLS and PCR optimised models stating good predictive abilities of the models. The results for drug assay (Tables 7, 8) showed good concurred with the label claims.

Figure 2: RMSECV plots for LRN and PRN by PCR method.

Figure 3: RMSECV plots of LRN and PRN by PLS method.
| PCR Conc. (µg/ml) | PLS Conc. (µg/ml) | |||||
|---|---|---|---|---|---|---|
| Actual | Predicted | %Assay | Actual | Predicted | %Assay | |
| PRN | 25 | 25.23 | 100.92 | 25 | 24.98 | 99.92 |
| LRN | 20 | 19.86 | 99.3 | 20 | 20.24 | 101.21 |
| Formulation | Method | Actual Conc. mg/tablet | Amount obtained | %PRN±S.D | %LRN±S.D |
|---|---|---|---|---|---|
| PRN LRN | PRN LRN | (N=3) | (N=3) | ||
| ADPACE | PCR | 2 50 | 1.99 49.95 | 99.95±0.03 | 99.99±0.04 |
| PLS | 2 50 | 1.97 49.89 | 98.5±0.024 | 99.78±0.29 | |
| *(n=3) | |||||
CONCLUSION
The developed computational UV spectrophotometric methods of PCR and PLS can be used for the simultaneous determination of LRN and PRN in laboratory-prepared mixtures of their API forms or pharmaceutical preparations. These techniques do not need any sample pre-treatment, and they are rapid, specific, precise, and accurate. Moreover, chemometric spectrophotometric methods were cost effective, less time-consuming and highly sensitive. The results of validation study proved that the proposed methods could be used for routine analysis during quantitation of PRN and LRN in tablet formulation.
Availability of data and Material
All the information in the manuscript has been referred from the included references.
Abbreviations
PRN- Perindopril
LRN-Losartan
RMSECV- Root Mean Square Error of Cross Validation
CV-Cross validation
PCR- Principle Component Regression
PLS-Partial Least Square
ICH- International Conference on Harmonisation
MLR-multiple linear regression
RSD-Relative Standard Deviation
r2 - Correlation coefficient
REFERENCES
- Abdellatef HE. J Pharm Biomed Anal. 1998, 17(8): p. 1267-1271.
- Ahmed MA, Edrah S, Kahal F. Int J Sci Eng Res. 2017, 5(4): p. 61-66.
- De Luca M, Oliverio F, Ioele G, et al., Chemometr Intell Lab Syst. 2009, 96: p. 14-21.
- Dinç E, Baleanu D. J Pharm Biomed Anal. 2002, 30(3): p. 715-723.
- El-Gindy A, Emara S, Mostafa A. J Pharm Biomed Anal. 2006, 41(2): p. 421-430.
- Elshanawane AA, Mostafa SM, Elgawish MS. Chromatogr. 2008, 67: p. 837–840.
- Eticha T, Kahsay G, Asefa F, et al., J Anal Meth Chem. 2018, p. 9538435.
- Farthing D, Sica D, Fakhry I, et al., J Chromatogr B Biomed Sci Appl. 1997, 704: pp. 374-378.
- Gandhi SV, Waghmare AD, Nandwani YS, et al., J Pharm Sci. 2017, 3(1): p. 1925.
- Hadad GM, El-Gindy A, Mahmoud WMM. Spectro Chimica Acta Part A, Mol Biomol Spect. 2008, 70(3): p. 655–663.
- Lalaouna AE, Djalil Dalia F. Spectro chimica Acta Part A: Mol. Biomol Spectr. 2022, 266: p. 120422.
- Latifa L. Chem Africa. 2022, 5: p. 437-458.
- Lee H, Shim HO, Lee HS. Chromatographia. 1996, 42: p. 39-42.
- Lin SJ, Wu HL, Chen SH, et al., Anal Lett. 1996, 29(10): p. 1751-1762.
- Mathew C, Varma S. Asian J Pharm Anal. 2022, 12(1).
- Maurer HH, Kraemer T, Arlt JW. Ther Drug Monit. 1998, 20(6): p. 706-713.
- McCarthy KE, Wang Q, Tsai EW, et al., J Pharm Biomed Analysis. 1998, 17: p. 671-677.
- Polinko M, Riffel K, Song H, et al., J Pharm Biomed Anal, 2003, 33(1): p. 73-84.
- Stefan RI, Van Staden JK. Chirality. 1999, 11(8): p. 631-634.
- Rahman A. Indonesian J Pharm. 2012, 23(1): p. 1-8.
- Rahman N, Anwar N, Kashif M. Chem Pharm Bull. 2006, 54(1): p. 33-36.
- Ritter MA, Furtek CI, Lo MW. J Pharm Biomed Anal. 1997, 15(7): p. 1021-1029.
- Sarrafi AHM, Konoz E, Feyzbakhsh A. E-J Chem. 2010, 7(3): p. 997-1002.
- Simončič Z, Roškar R, Gartner A, et al., Int J Pharmaceut. 2008, 356: p. 200-205.
- Soldner A, Spahn-Langguth H, Mutschler E. J Pharm Biomed Anal. 1998, 16(5): p. 863-873.
- Stefan RI, Van Staden JF, Mulaudzi LV, et al., Analytica Chimica Acta. 2002, 467: p. 189-195.
- The Merck Index Online - chemicals, drugs and biologicals. (n.d.). Retrieved March 19, 2022.
- Vijayalakshmi R, Archana S, Dhanaraju MD. Asian J Res Chem. 2010, 3(3): p. 571-573.
- Westad F, Marini F. Anal Chim Acta. 2015, 893: p. 14-24.
- Williams RC, Alasandro MS, Fasone VL, et al., J Pharm Biomed Anal. 1996, 14(11): p. 1539-1546.
- Zheng X, Gao H, Cui X, et al., Chromatogr B Anal Tech Biomed Life Sci. 2021, 1169.
Indexed at, Google Scholar, Crossref
Indexed at, Google Scholar, Crossref
Indexed at, Google Scholar, Crossref
Indexed at, Google Scholar, Crossref
Indexed at, Google Scholar, Crossref
Indexed at, Google Scholar, Crossref
Indexed at, Google Scholar, Crossref
Indexed at, Google Scholar, Crossref


