Research Article - Der Pharma Chemica ( 2018) Volume 10, Issue 9
Computational Analysis of Physico Chemical Properties of Beta Asarone
Linu Sam1, Amrutha R2* and Chandran P3
1Manonmaniam Sundaranar University, Tirunelveli-627012, Tamil Nadu, India
2Department of Physics, KCG College of Technology, Karappakam-600097, Chennai, Tamil Nadu, India
3Department of Physics, Madras Christian College, Tambaram-600059, Chennai, Tamil Nadu, India
- *Corresponding Author:
- Amrutha R
Department of Physics
KCG College of Technology
Karappakam-600097, Chennai, Tamil Nadu, India
Abstract
The variation in the Physico Chemical properties of Beta Asarone when the temperature is raised is studied here. The Solvent effect has also been calculated with 2 solvents-water and ethanol by (Polarizable continuum Model (PCM) method where a solute cavity is created by a set of over lapping spheres and computes the energy in solution. The electrostatic interactions of molecules are studied using their Mulliken charge distribution. SCF Energy, Molecular electrostatic Potential mapping, Dipole moment, Ionization Potential and Thermal properties are also studied. Beta Asarone which is the reported toxic constituent of Acorus calamus might undergo variations with higher temperature and also when it is in solution. The study of variations in solution is challenging and here the quantum mechanical calculations are performed in two different solutions to test for any variations of Beta Asarone in solution.
Keywords
Acorus calamus, Beta Asarone, Temperature, Solvent.
Introduction
Acorus calamus more commonly known as Vacha has been used in ayurvedic medicine since long especially for infants. But the toxicity of A. calamus is a subject for debate as one of its major constituents Beta Asarone is reported to be toxic by many sources including the Food and Drug Administration (FDA) of the United States [1]. However several studies have also reported the medical potential and healing ability of Beta Asarone including a few more recent reports [2,3]. The significant properties involved in characterising a molecule involve a study of molecular structure, electron density, ionisation potential and the thermal parameters.
Theoretical Calculations provide an idea regarding the structural parameters, charge distribution, dipole moment and thermal parameters. Computational analysis of medicinal plants has been recently carried out by Manimaran et al. [4] where Curcumin was analysed.
The properties such as Ionization Potential, Electron Affinity, Electronegativity and Electrophilic Index give an idea about the radical scavenging ability of the molecule.
Generally Acorus calamus is used either for medicinal purpose when carbonized (heated) or when it is in solution-generally honey. It is hence relevant to study the variation of its most toxic constituent -Beta Asarone with temperature and also in solution [5,6].
Heating will in all probabilities alter the electron distribution and would also influence the energy gap. Solvation alters the electrostatic properties of a solute by changing its geometry and polarizing its charge distribution [7,8].
Materials and Methods
Computational details
The structure of Beta Asarone was generated using Gaussview 5.0 [9] and the computation was done using Gaussian 09 [10]. DFT (Density Function Theory) method B3LYP(Becke 3-Parameter (Exchange), Lee, Yang and Parr ) was used with the basis set of 6-31G** as done by the authors earlier [11]. DFT methods are reported to give accurate results and the computational time is not much compromised either. The output parameters were again analysed using Gaussview 5.0. Graphs were plotted using Origin 8.5.1 [12]. Beta Asarone was optimised at room temperature (298 K) and re-optimized at temperatures of 323 K and 573 K. It was then analysed in the solvation model first with water as solvent and subsequently Ethanol as solvent.
Results and Discussions
The Molecular Structure of Beta Asarone is given in Figure 1. There are three methyl groups attached to the Benzene ring which we can label as Attachment 1 (O10) with C4, attachment 2 (O12) with C2 and attachment 3(O14) to C1. The fourth group is labelled as attachment 4.
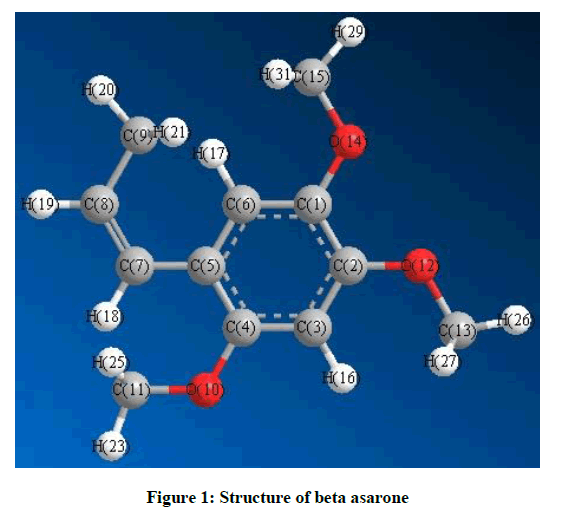
Figure 1: Structure of beta asarone
Mulliken’s atomic charges
In Quantum mechanics, the atomic charge is not an observable quantity. Hence mathematical treatments are used to assign electron densities to atoms. The Mulliken Population Analysis is used here. Though not very robust it is more commonly used. Calculation of atomic charges is of importance in quantum chemical calculations as it affects other properties such as dipole moment, molecular polarizability, structural parameters etc. The atomic charge distribution assigned to various atoms showed variations with rise in temperature and also in solution. The charge distribution is altered when the molecule was analysed at a higher temperature as compared to the room temperature. Any further increase till the observed value of 573 K did not produce change in the charge distribution. Graphs are presented here to compare the charge distribution of Carbon atoms, hydrogen atoms and oxygen atoms in each case.
Carbon atoms
The highest charges are observed on the ring atoms C1 and C2 that have a methyl group attached to them. C4 atom also has a methyl group attached to it. But the negative charge on it though positive is of a lesser magnitude. The proximity of the group attached to C5 seems to influence the charge on C4. C5 has a negligible positive charge on it. The other carbon atoms of the ring C3 and C6 have a negative charge as a result of inductive effect. In all cases the charges are lowered when the molecule is analysed under higher temperature. C7 and C8 have an almost equal charge distribution with charge on C8 being just marginally higher. C9 has the highest magnitude of negative charge.C11 which possesses a negative charge at room temperature goes into the positive region at higher temperatures.C13 and C15 have identical charges (Figure 2). The relative variation in the charges on the carbon atoms is given in Figure 3. It can be observed that maximum variation is observed for C11 and to a certain level C4. All the other Carbon atoms do not display much of variations
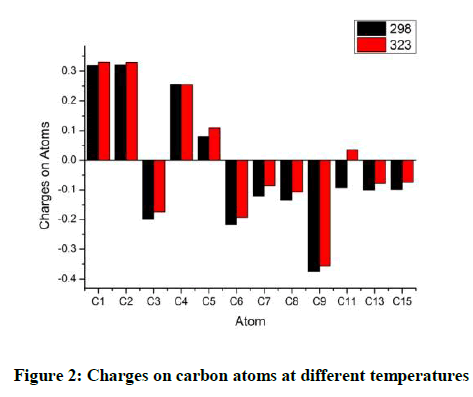
Figure 2: Charges on carbon atoms at different temperatures
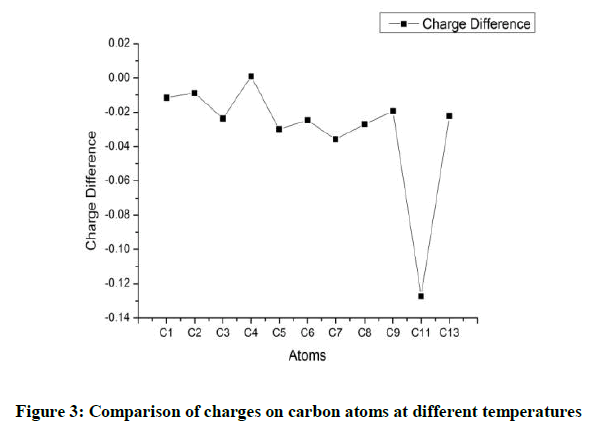
Figure 3: Comparison of charges on carbon atoms at different temperatures
The hydrogen atoms H16 and H17 have a lower hydrogen charge and that can be attributed to inductive effect. The hydrogen atoms attached to the double bonded carbon atoms have the lowest charge. All the hydrogen atoms in the methyl group have more positive charge on them as the oxygen atom is withdrawing electrons. With increasing temperature the charges on all the hydrogen atoms decrease (Figure 4). However the difference between the charges on hydrogen atoms at higher temperatures is not a constant. It is observed that the charge on H17 varies the most when heated. On the contrary H20, H21 and H22 show the lowest variations. In all the methyl groups the variation for any one hydrogen atom is lower than the other two hydrogen atoms (Figure 5).
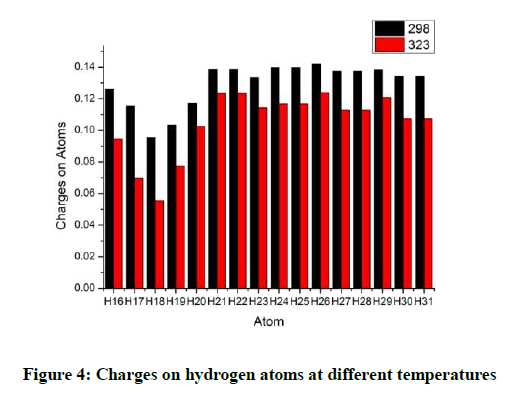
Figure 4: Charges on hydrogen atoms at different temperatures
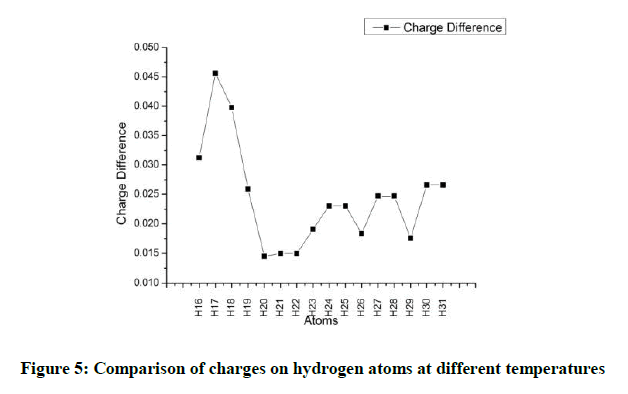
Figure 5: Comparison of charges on hydrogen atoms at different temperatures
The charges on the oxygen atoms are almost identical and it is found that the oxygen atoms lose their charges marginally when heated (Figure 6). The oxygen atom O14 possess a more negative charge. The maximum variation with temperature is observed for O10. This change in O10 and C11 as discussed earlier seem to be influenced to the group near them (Figure 7).
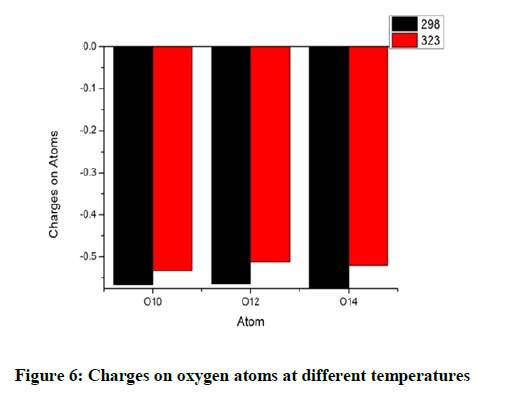
Figure 6: Charges on oxygen atoms at different temperatures
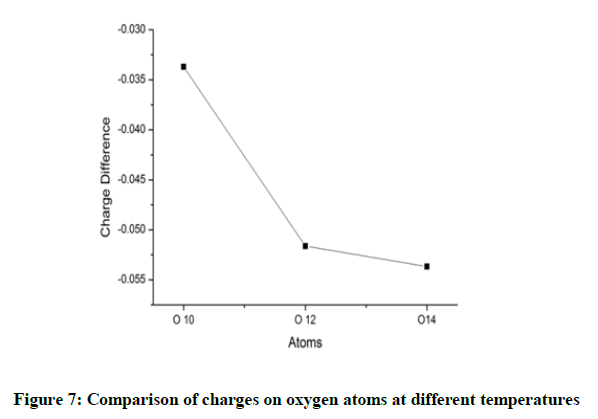
Figure 7: Comparison of charges on oxygen atoms at different temperatures
In solvation of both water and ethanol C1 loses its charge marginally while C2 and C4 with identical groups attached to them as C1 seems to show a marginal increase in the charges. The negative charge on C3 increases and that on C6 decreases (Figure 8).
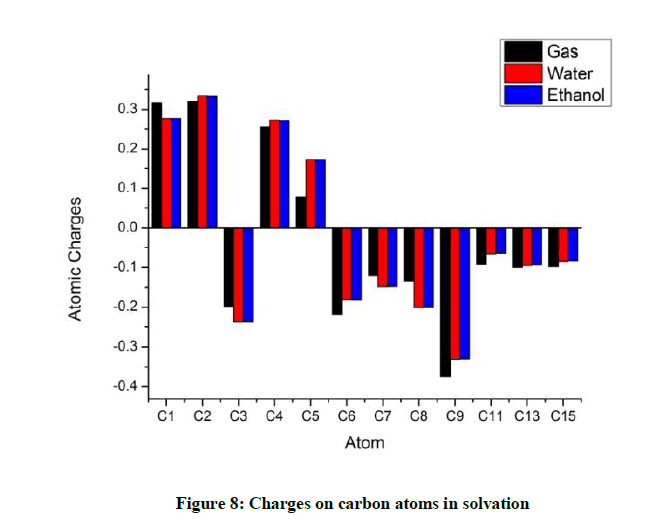
Figure 8: Charges on carbon atoms in solvation
In both the solvation models C5 has gained a considerable amount positive charge. The negative charge is drawn by the double bonded C8 (Figure 9).
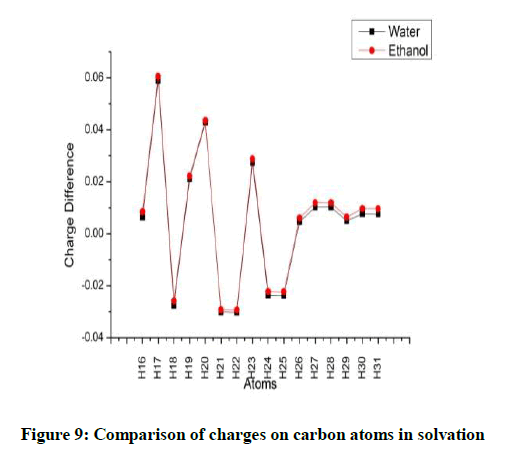
Figure 9: Comparison of charges on carbon atoms in solvation
Considering the hydrogen atoms H17 shows the maximum variation for both the solvents. In the methyl group, one hydrogen atom loses more charge as compared to the other two (Figures 10 and 11). The charges on the oxygen atoms do not show much variation with solvation (Figures 12 and 13).
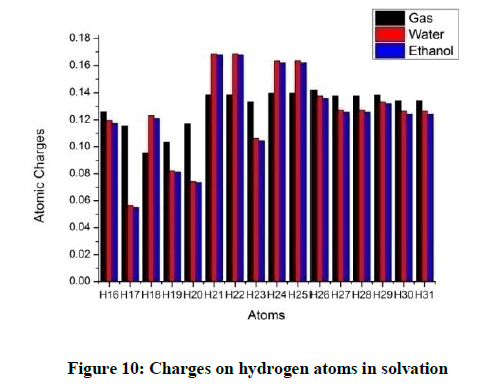
Figure 10: Charges on hydrogen atoms in solvation
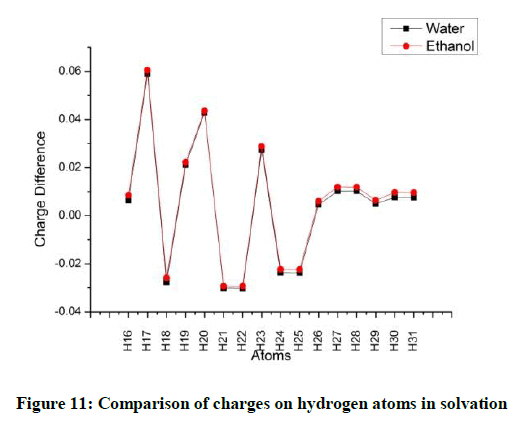
Figure 11: Comparison of charges on hydrogen atoms in solvation
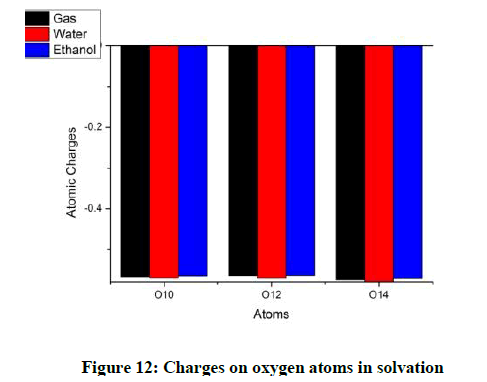
Figure 12: Charges on oxygen atoms in solvation
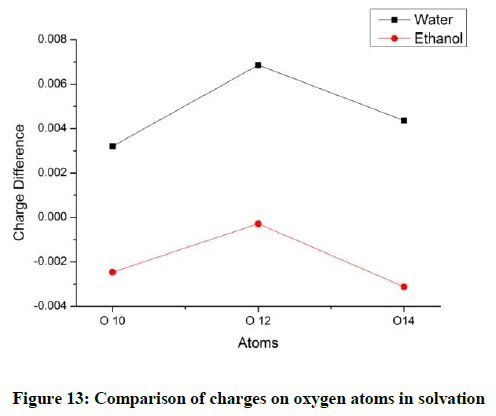
Figure 13: Comparison of charges on oxygen atoms in solvation
SCF energy
Considering the SCF (Self Consistent Field) energy variations with temperature, the energy is lowered when the temperature is raised from the room temperature and remains constant thereafter (Figure 14).
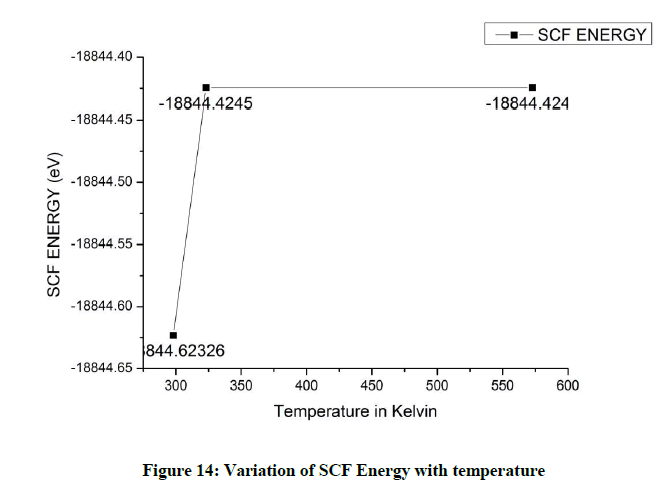
Figure 14: Variation of SCF Energy with temperature
Solution of Beta Asarone in water does not show much variation in the SCF energy value. But the solution of Beta Asarone in Ethanol significantly lowers the SCF energy indicating a better stability (Figure 15).
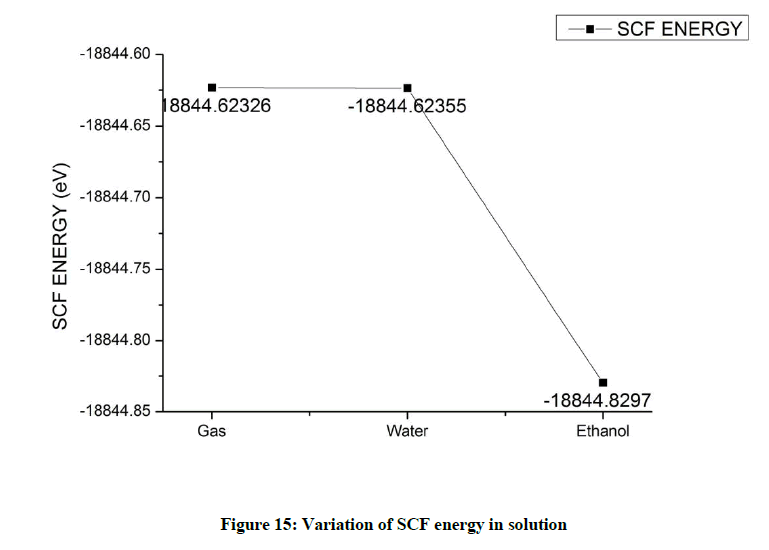
Figure 15: Variation of SCF energy in solution
Ionisation potential
The Frontier Orbitals HOMO (Highest Occupied Molecular Orbital)-LUMO (Lowest Unoccupied Molecular Orbital) give an idea about the transport properties of the molecule. It is observed that the Ionisation Potential changes when the temperature is raised from that of the room temperature (Figure 16). Any further increase in the temperature does not induce a change in the Ionisation Potential (Figure 17).
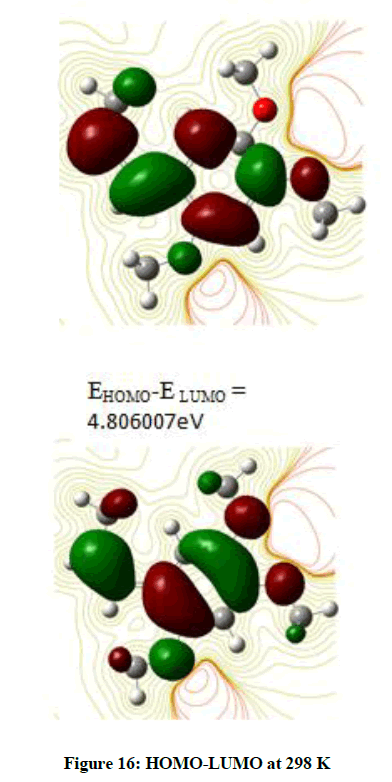
Figure 16: HOMO-LUMO at 298 K
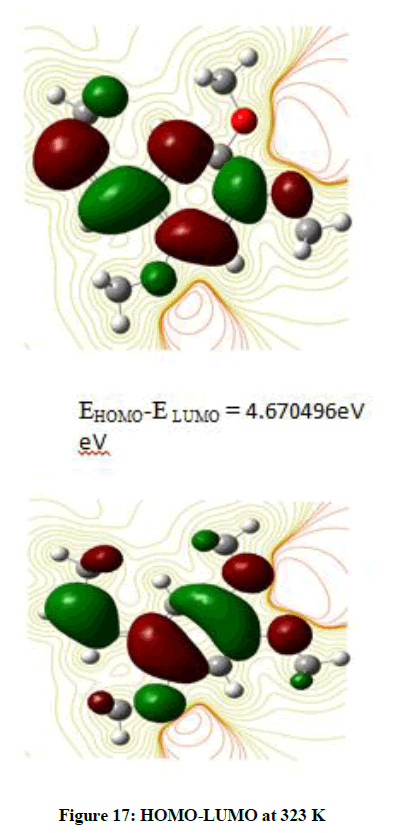
Figure 17: HOMO-LUMO at 323 K
Radical Scavenging ability increases with IP value. The value of Ionization potential decreases with increase in temperature indicating a cling in of the band gap. The LUMO energy value changes to a positive value on raising the temperature indicating that the orbital is changing to a nonbonding orbital with less stability.
These Frontier orbitals are the sites of exchange of charge density leading to interaction between molecules. The calculations are performed based on Koopman’s approximation. Looking at Figure 16, it is observed that HOMO is localized more on the benzene ring. There is an electron density on the carbons outside the ring. Very little distribution is found except for a few Hydrogen atoms.
The ionisation potential does not vary with solvent indicating that there is no change in the band gap or a change in the conductivity when in solution.
Molecular electrostatic potential
The Map of Molecular Electrostatic Potential (MEP) which maps the sites of electrophilic and nucleophilic reactions and the hydrogen bonding interactions is a very useful descriptor. This map also provides insights into actions of drug molecules and their analogues and also predicts molecular interactive sites. In MEP (Figure 18) surfaces negative region pertains to electrophilic reactivity. This is denoted by blue colour. Increasing order of electron density red>orange>yellow>green>blue. Blue is strongest attraction and red strongest repulsion.
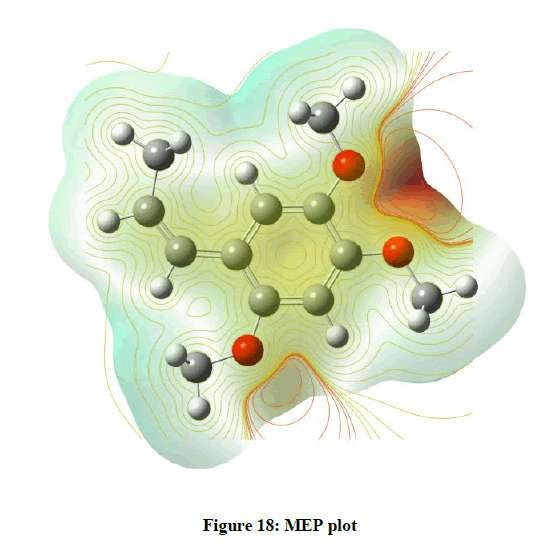
Figure 18: MEP plot
All the four plots indicate that the electron concentration is more where there are 2 ethyl groups indicating electrophilic reaction centres [4] and the third ethyl group also shows the same behaviour and this behaviour is due to the electron withdrawing nature of Oxygen atom present in all three positions. The regions around the hydrogen atoms are in an electron accepting behaviour.
Dipole moment
Dipole moment varies significantly along the x axis with temperature resulting in a net dipole moment. The dipole moment along the z axis is almost 0 indicating a near planar conformer. There is not much variation observed along y (Figure 19).
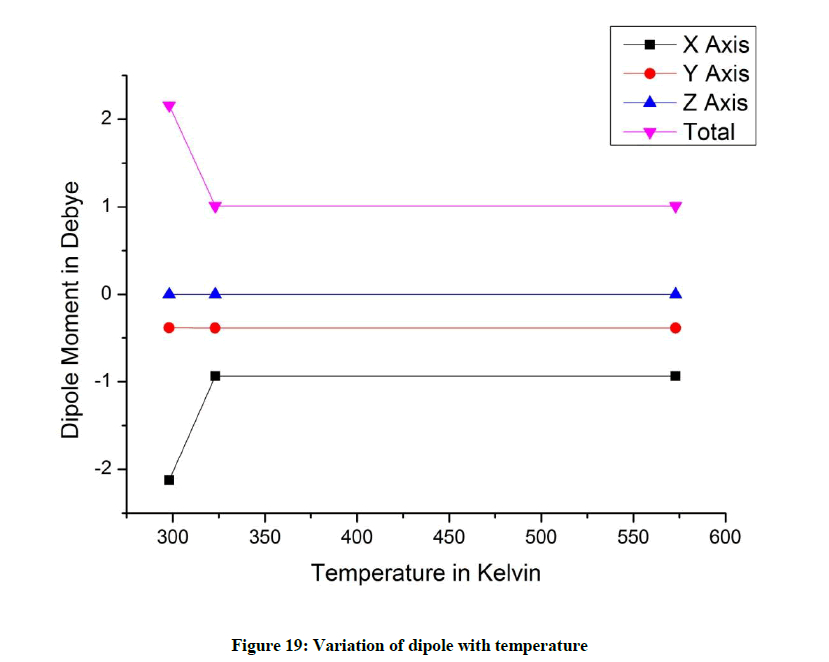
Figure 19: Variation of dipole with temperature
The dipole value is 0 along the z axis for all conformers indicating that the molecules are planar.
The dipole value along the x axis is more for the gas phase as compared to the values in solution (Figure 20). The value along y axis for gas phase is comparatively lesser. The total dipole is higher for ethanol indicating a greater level of distortion.
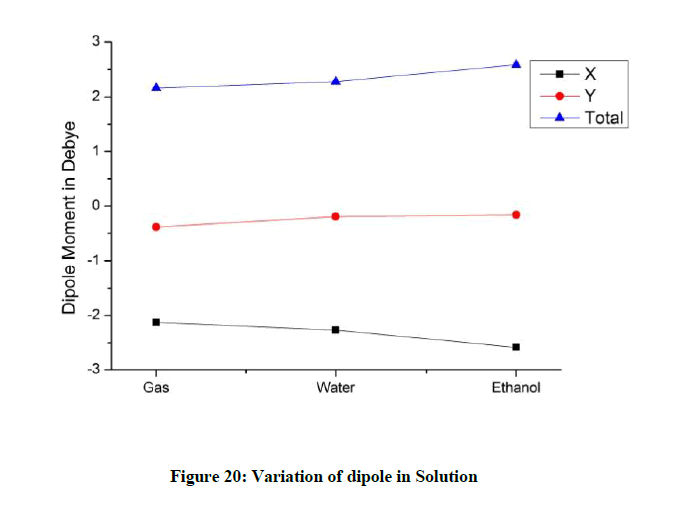
Figure 20: Variation of dipole in Solution
Thermodynamic properties
Knowledge of the thermochemistry of molecules is of key importance in chemical sciences. Thermochemical data provide information on stabilities and reactivities of molecules. This data is a key factor in the safe and successful scale-up of chemical processes in the chemical industry.
Study of thermodynamics and determination of equilibrium properties such as enthalpy, Gibbs energy, and thermal energy could be carried out using computational methods to substantiate the experimental results.
Despite compilations of experimental thermochemical data for many molecules, there are numerous species for which there are no data. In addition, the data in the compilations are sometimes incorrect. Experimental measurements of thermochemical processes are often expensive and difficult, so it is highly desirable to have computational methods that can make reliable predictions.
In the case of temperature variation Enthalpy and Energy increase with increase in temperature. Gibbs free energy sees a steady decline in its value (Figure 21).
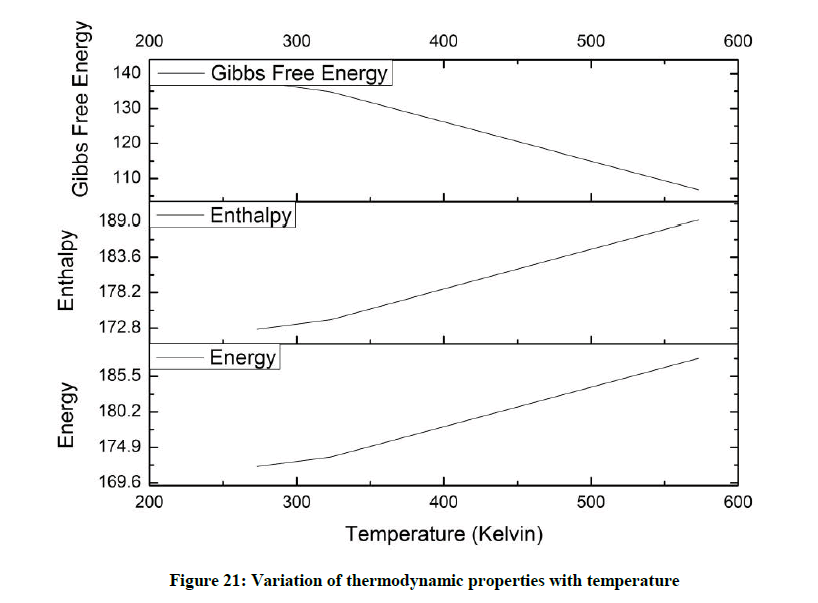
Figure 21: Variation of thermodynamic properties with temperature
The variation in thermodynamic properties in solution (Figure 22) throws up an interesting scenario. Both energy and enthalpy dip considerably for water and the value rises marginally for ethanol solution. As for Gibbs Free energy it drops drastically for water and shoots up for ethanol solution.
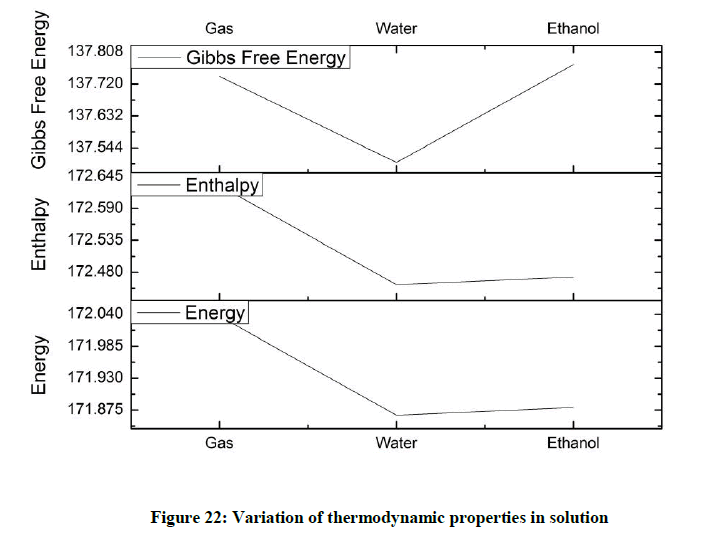
Figure 22: Variation of thermodynamic properties in solution
Zero point vibrational energy (ZPVE) (Figure 23)
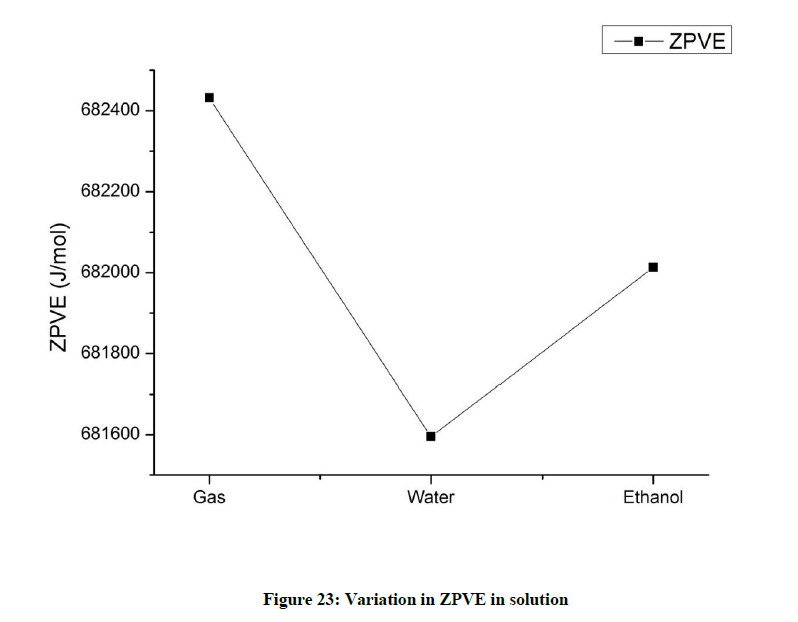
Figure 23: Variation in ZPVE in solution
The zero point vibrational energy is lowered in both water and ethanol solutions indicating that Beta Asarone gets stabilized in solvent field.
Conclusion
Almost all the data show variation either with the raise in temperature on when in solution. A definite change is observed when there is a change from the room temperature though there is no observed variation after that. The properties except Ionization Potential were found to vary with solvent. These observable changes may have a definite say on the properties and applications of Acorus calamus. Further docking studies are planned to be carried out.
References
- R. Mitchell, Acorus calamus, Beaver, Spring, 1968, 24-26.
- Z. Xue, Y. Guo, S. Zhang, L. Huang, Y. He, R. Fang, Y. Fang, Eur. J. Phamacol., 2013, 741, 195.
- V. Sharma, I. Singh, P. Chaudhary, Nat. Prod. Res., 2014, 28(18), 1454.
- S. Manimaran, K. Sambath Kumar, R. Gayathri, N. Rajkamal, M. Venkatachalapathy, G. Ravichandran, C. LourduEdisonRaj, Nat. Prod. Bioprospect., 2018, 1.
- S. Pokharia, R. Joshi, M. Pokharia, S.K. Yadhv, H. Mishra, Ind. J. Chem. A., 2016, 55A, 938.
- J. Tomasi, B. Mennucci, R. Cammi, Chem. Revs., 2005, 105, 2999.
- P. Vidhya, V. Kannappan, V. Sathaynarayanamoorthi, Ind. J. Chem. Section A., 2015, 54A, 179.
- E. Cuhero, J. Lugne, M. Orozco, J. Gao, J. Phys. Chem. B., 2003, 107, 1664.
- D. Roy, A.K. Todd Millam, J.M. Semichem, Inc., Shawnee Mission, KS, 2009.
- M.J. Frisch, G.W. Trucks, H.B. Schlegel, G.E. Scuseria, M.A. Robb, J.R. Cheeseman, G. Scalmani, V. Barone, B. Mennucci, G.A. Petersson, H. Nakatsuji, M. Caricato, X. Li, H.P. Hratchian, A.F. Izmaylov, J. Bloino, G. Zheng, J.L. Sonnenberg, M. Hada, M. Ehara, K. Toyota, R. Fukuda, J. Hasegawa, M. Ishida, T. Nakajima, Y. Honda, O. Kitao, H. Nakai, T. Vreven, J.A. Montgomery Jr, J.E. Peralta, F. Ogliaro, M. Bearpark, J.J. Heyd, E. Brothers, K.N. Kudin, V.N. Staroverov, R. Kobayashi, J. Normand, K. Raghavachari, A. Rendell, J.C. Burant, S.S. Iyengar, J. Tomasi, M. Cossi, N. Rega, J.M. Millam, M. Klene, J.E. Knox, J.B. Cross, V. Bakken, C. Adamo, J. Jaramillo, R. Gomperts, R.E. Stratmann, O. Yazyev, A.J. Austin, R. Cammi, C. Pomelli, J.W. Ochterski, R.L. Martin, K. Morokuma, V.G. Zakrzewski, G.A. Voth, P. Salvador, J.J. Dannenberg, S. Dapprich, A.D. Daniels, Ö. Farkas, J.B. Foresman, J.V. Ortiz, J. Cioslowski, D.J. Fox, Gaussian, Inc., Wallingford CT, 2009.
- R. Amrutha, P. Haripriya, S. Lakshmi, P. Chandran, Ind. J. Chem. Sec A., 2007, 46A, 729.
- Origin (OriginLab, Northampton, MA).


