Research Article - Der Pharma Chemica ( 2018) Volume 10, Issue 3
Development and Validation of Stability-Indicating Spectrophotometric and Spectrofluorimetric Methods for the Determination of Asenapine Maleate
Nesrin K Ramadan1, Taghreed A Mohamed2, Rowayda M Fouad2* and Azza A Moustafa1
1Department Analytical Chemistry, Faculty of Pharmacy, Cairo University, Egypt
2Department of Pharmaceutical Chemistry, National Organization for Drug Control and Research, 9Abou-Hazemstr, Giza, Egypt
- *Corresponding Author:
- Rowayda M Fouad
Department of Pharmaceutical Chemistry
National Organization for Drug Control and Research
9Abou-Hazemstr, Giza, Egypt
Abstract
Four sensitive and selective spectrophotometric and spectrofluorimetric methods were developed for the quantitative determination of Asenapine maleate (AS) in presence of its oxidative degradate. The first method derivative spectrophotometry depending on the measuring the peak of amplitudes of second and third derivative curves at 250,275 and 294 nm in case of 2D and at 259, 284 and 301 nm in case of 3D. The second method ratio Difference Spectrophotometry (RD) measuring the difference in absorbance between 261 and 291 nm. The third method Derivative Ratio (1DD) measuring the first derivative of ratio spectra at 272, 303 and 318 nm where no contribution of the degradate. The fourth method was depending on measuring the native florescence at λem 314 when exited at 270 nm. The linearity was obtained in concentration range 20-200 μg/ml for the 3 spectrophotometric methods while from 1-10 μg/ml for fluorimetric method. The 4 suggested methods can be applied for purity testing, stability studies, quality control and routine analysis of the proposed drug in pure and dosage form.
Keywords
Asenapine; Second derivative (2D), Third derivative (3D), Ratio difference (RD), Derivative ratio (1DD)
Introduction
Asenapine maleate (AS) (3aRS,12bRS)-rel-5-Chloro-2,3,3a,12b-tetrahydro-2-methyl-1H-dibenz[2,3:6,7]oxepino-4,5-c]pyrrole maleate [1]. AS is atypical antipsychotic drug developed for the treatment of acute mania with bipolar disorder and schizophrenia [2]. AS is non-official drug, several methods where used for its determination involving titrimetric method using 0.1 N sodium hydroxide and 0.1 N potassium hydroxide [3], spectrophotometric method at 220 nm [4] and at 270 nm [5-7]. It also determined by gas-liquid chromatography-mass spectrometry in human and animal plasma [8,9]. High sensitive Liquid Chromatography-Tandem Mass Spectrometry (LC-MS/MS) techniques were used for its analysis in human plasma [10,11]. Determination of AS in pharmaceutical dosage forms were reported using different HPLC methods, different mobile phases and columns [12-18]. Determination of AS in plasma and urine was done using several HPLC methods [19,20].
A different stability-indicating Reversed-Phase High-Performance Liquid Chromatography (RP-HPLC) method for determination of AS in tablet dosage form and in serum was reported [21-23] and only one stability-indicating High Performance Thin Layer Chromatography (HPTLC) method for its determination in both marketed tablets and in-house developed formulations [24]. One stability-indicating High Performance Liquid Chromatography (HPLC) and TLC chromatographic methods was developed by [25]. The 4 suggested methods are validated according to International Conference on Harmonization (ICH) guidelines [26] for the determination of AS in presence of its degradation product (Figure 1).
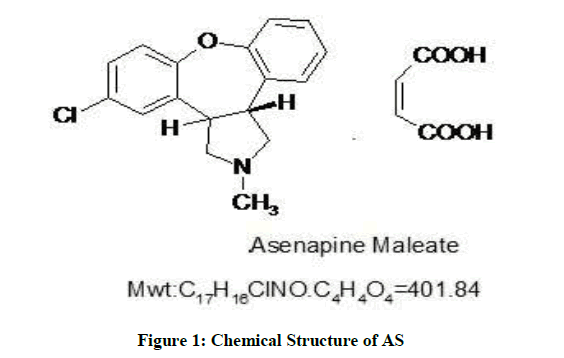
Figure 1: Chemical Structure of AS
Experimental Section
Instrumental
(a) UV-Visible spectrophotometer (Unicam UV 300, Kyoto, Japan); (b) Spectrofluroimeter (Agilant Technologies, Cary Eclipse Fluroscence Spectroflurometer, Australia).
Pure sample
Pure samples AS was kindly supplied by Hikma Pharma S.A.E, 6th October City, Egypt (Batch No.AOLM0040514). According to the manufacturer’s method [27] its purity was found to be 100.1 ± 0.310%.
Pharmaceutical formulation
Asenapine-Hikma Pharma tablets, (Batch No 003) were claimed to contain 10 mg AS manufactured by Hikma Pharma S.A.E Company and were purchased from a local market.
Degraded sample
An accurately 50 mg of AS was transferred into 50-ml round-bottom flask and 50 ml 30% H2O2 solution was added then refluxed for 3 h. The refluxed solution was evaporated to dryness, the residue was left to cool, then washed 5 times with methanol. The pure residue was accurately transferred into a 50 ml volumetric flask. The volume was completed to the mark with methanol and finally filtered to get final concentration equivalent to (1 mg/ml AS deg) [25].
Reagents
(a) Methanol of analytical grade (Fischer scientific-UK), (b) Methanol, ethanol and dichloromethane were of HPLC grade (Fischer Scientific, UK), (c) Acetone (Sigma Aldrich, St. Louis, USA), (d) 1,4-Dioxane (Fischer Scientific, UK), (e) Sulphuric acid (0.1 M, aqueous solution: Loba- Chime industrial Co., India). (f) Sodium hydroxide (0.1 M, aqueous solution: BDH Chemicals Ltd., England), Stock and working solutions.
(a) AS stock and working solutions
The stock standard solution of AS (1 mg/ml) was prepared for the four suggested methods by dissolving 50 mg of AS in a 50 ml volumetric flask then completing volume with methanol. Aliquot of 2.5 ml of the prepared stock solution was transferred to 25 ml volumetric flask further diluted with methanol to get working solution with final concentration (0.1 mg/ml) for the fluorimetric method.
(b) Stock and working solutions of (AS deg) (Degradation product of AS)
A stock solution equivalent to (1 mg/ml) of AS was prepared as the previously mentioned procedure under Degraded sample. Aliquot of the prepared stock solution was further diluted with methanol to get working solution with final concentration (0.1 mg/ml) for method D.
(c) Preparation of laboratory mixtures containing different ratios of AS and AS deg
For spectrophotometric methods
Into a series of 10 ml volumetric flasks aliquots (1.8-0.2 ml) of AS were accurately transferred from AS standard solution (1 mg/ml) equivalent to (1800-200 μg). Aliquots (0.2-1.8 ml) of AS deg stock solution (1 mg/ml) equivalent to (200-1800 μg) were added, and then volume was completed with methanol.
For fluorimetric method
Into a series of 10 ml volumetric flasks aliquots (0.9-0.1 ml) of AS were transferred accurately from its AS working solution (0.1 mg/ml) equivalent to (90-10 μg). Aliquots (0.1-0.9 ml) of AS deg working solution (0.1 mg/ml) equivalent to (10-90 μg) were added, and then volume was completed with methanol.
Procedures
(a) Preparation of the calibration graphs for derivative spectrophotometry methods [2D and 3D].
Into a series of 10 ml volumetric flasks aliquots (0.2, 0.4, 0.8, 1.2, 1.6 and 2 ml) of the AS stock standard solution (1 mg/ml) were transferred then completed to mark with methanol. The zero-order spectra of AS solutions in methanol were recorded over the range of 200-400 nm, against methanol as blank. Then the second derivative spectra 2D of each solution were recorded with Δλ=2 nm and scaling factor 10. The peak amplitudes at 250, 275 and 294 nm were measured. The calibration curve represents the peak amplitudes at the selected wavelengths, respectively to the corresponding concentration of AS was plotted and the corresponding regression equations were calculated.
The third derivative spectra 3D of the recorded zero-order spectra of the prepared solution were also obtained with Δλ=2 nm and scaling factor 100. The peak amplitudes at 259, 284 and 301 nm were measured. The calibration curve represents the peak amplitudes at the selected wavelengths, respectively to the corresponding concentration of AS was plotted and the corresponding regression equations were calculated.
(b) Preparation of the calibration graph for ratio difference spectrophotometry method [RD]
The recorded zero order spectra of the prepared solutions were divided by the spectrum of 20 μg/ml of AS deg (its degradation product) and the ratio spectra were obtained. The peak amplitudes of the ratio spectra were measured at 261 and 291 nm. Then the calibration curve represents the differences in amplitude of ratio spectra (ΔP=261, 291), respectively to the corresponding concentration of AS was plotted and the corresponding regression equation was calculated.
(c) Preparation of the calibration graph for first derivative ratio spectrophotometry method [1DD]
After the recorded ratio spectra were obtained the first derivative of the ratio spectra were measured with scaling factor 10 and Δλ=2. The peak amplitudes of the first derivative of the ratio spectra at 272, 303 and 318 nm were measured. Then the calibration curve represents the peak amplitude of the first derivative of the ratio spectra at the specified wavelengths, respectively to the corresponding concentration of AS was plotted and the corresponding regression equations were calculated.
(d) Preparation of the calibration graph for fluorimetric method
Into a series of 10 ml volumetric flasks aliquots (0.1, 0.2, 0.4, 0.6, 0.8 and 1 ml) of AS working solution (0.1 mg/ml) were transferred, and then completed to mark with methanol. Using λexit=270 nm the fluorescence intensity was measured and at λemi=314 nm against methanol as blank. Then the calibration curve represents the fluorescence intensity at 314 nm to the corresponding concentration of AS was plotted and the corresponding regression equation was calculated.
(e) Analysis of laboratory prepared mixtures of AS and AS deg (specificity)
(1) For spectrophotometric methods: The absorption spectra of the prepared laboratory prepared mixtures were recorded. Then the procedures were completed as described in subsection of Preparation of the calibration graphs. The concentrations of AS were calculated from the corresponding regression equations.
(2) For fluorimetric method: The fluorescence intensity of the previously prepared laboratory prepared mixtures was recorded. Then the procedures were completed as described in subsection of preparation of the calibration graphs. The concentrations of AS were calculated from the regression equation.
(f) Analysis of AS in pharmaceutical preparation using the proposed methods
(1) For spectrophotometric methods: An accurately five asenapine tablets was weighted and finally powdered, drug equivalent to 50 mg of AS was weighed and transferred into a50-ml volumetric flask dissolved in 25-ml methanol using an ultrasonic bath for 20 min, diluted to volume with methanol to obtain final concentration 1 mg/ml and finally filtered.
(2) For fluorimetric method: From the previous solution 2.5 ml of the solution was transferred accurately to a 25 ml volumetric flask and the final volume was made up with methanol to prepare tablet solution containing 0.1 mg/ml. The analysis procedures were completed as described under preparation of the calibration graphs.
Results and Discussion
Asenapine was subjected to different stress condition according to International Conference on Hormonization (ICH) [26] guidelines for: stress acidic and alkaline condition, oxidative condition, thermal degradation and photo degradation. Complete degradation was only achieved using oxidative condition as previously described; the degradation product was subjected to IR and MS [25].
Derivative spectrophotometry
Derivative spectrophotometry has found significant application in analytical, clinical, forensic and biomedical analysis [28]. The derivative method tends to emphasize spectral features by presenting them in a new and visually more accessible way. This method is generally applicable in analytical chemistry and can be used for resolution enhancement of electrochemical, chromatographic or thermal analysis data [29,30].
For the determination of pure drug in presence of any interference substances the first, second and third derivative techniques can be applied [31], by choosing a wavelength where the drug to be determined has a reasonable value while the interference substance is zero (or almost zero) while [32-36].
Figure 2 showing severe overlap between the zero-order spectra of AS (drug) and AS deg (its degradation product), that direct spectrophotometric analysis cannot be applied for determination the drug in the presence of its degradate. Derivative method was applied to resolve this overlap. The 1D failed to be determined AS, as shown in Figure 3. While the 2D spectra of AS and AS deg showed that AS could be determined by measuring the amplitude of peak at 250, 275 and 294 nm, where AS deg has no contribution and showed zero reading, Figure 4.
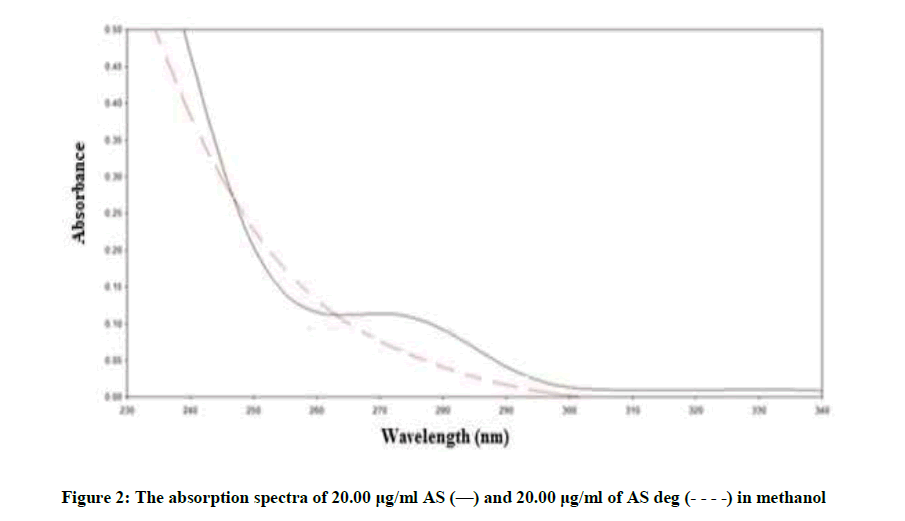
Figure 2: The absorption spectra of 20.00 μg/ml AS (—) and 20.00 μg/ml of AS deg (- - - -) in methanol
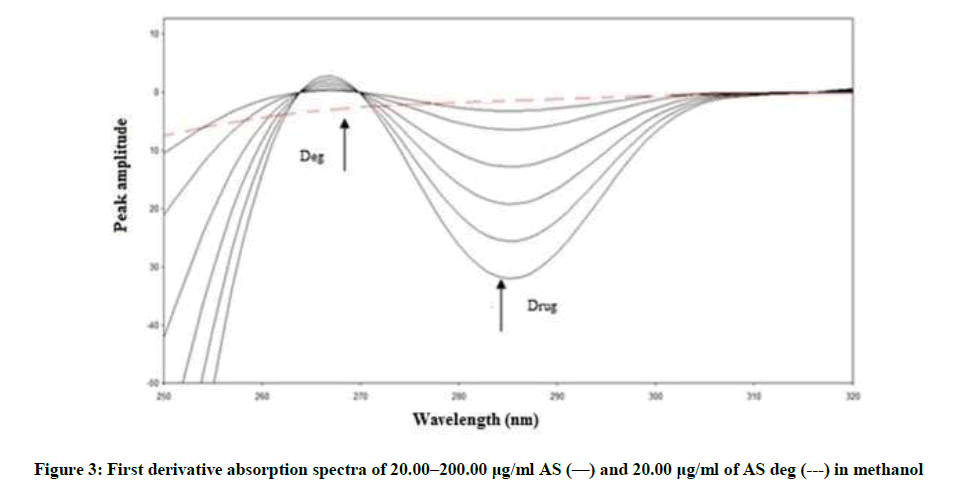
Figure 3: First derivative absorption spectra of 20.00–200.00 μg/ml AS (—) and 20.00 μg/ml of AS deg (---) in methanol
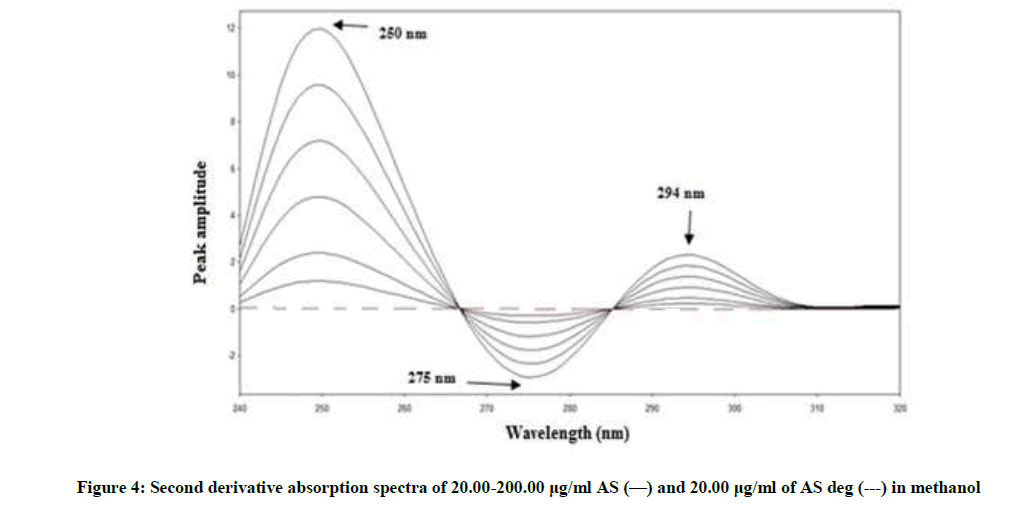
Figure 4: Second derivative absorption spectra of 20.00-200.00 μg/ml AS (—) and 20.00 μg/ml of AS deg (---) in methanol
By applying the third-derivative on the spectra of AS and AS deg it was noticed that AS can be determined at 259, 284 and 301 nm where AS deg has no contribution and showed zero crossing, Figure 5.
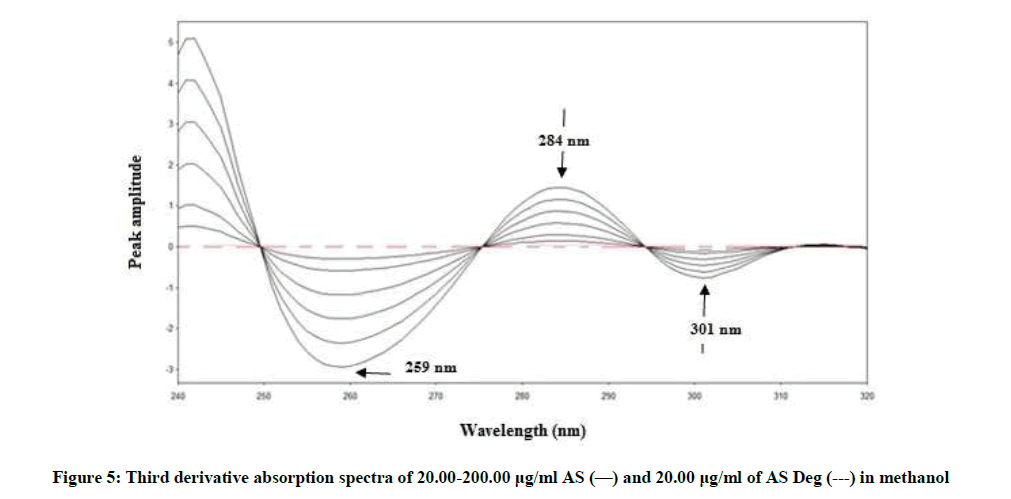
Figure 5: Third derivative absorption spectra of 20.00-200.00 μg/ml AS (—) and 20.00 μg/ml of AS Deg (---) in methanol
The proposed 2D and 3D methods were linear in the range of 20-200 μg/ml, Figures 6 and 7. The regression equations representing the linear relationship between the peak amplitudes at the selected wavelengths versus the different concentration of drug were computed. For second derivative:
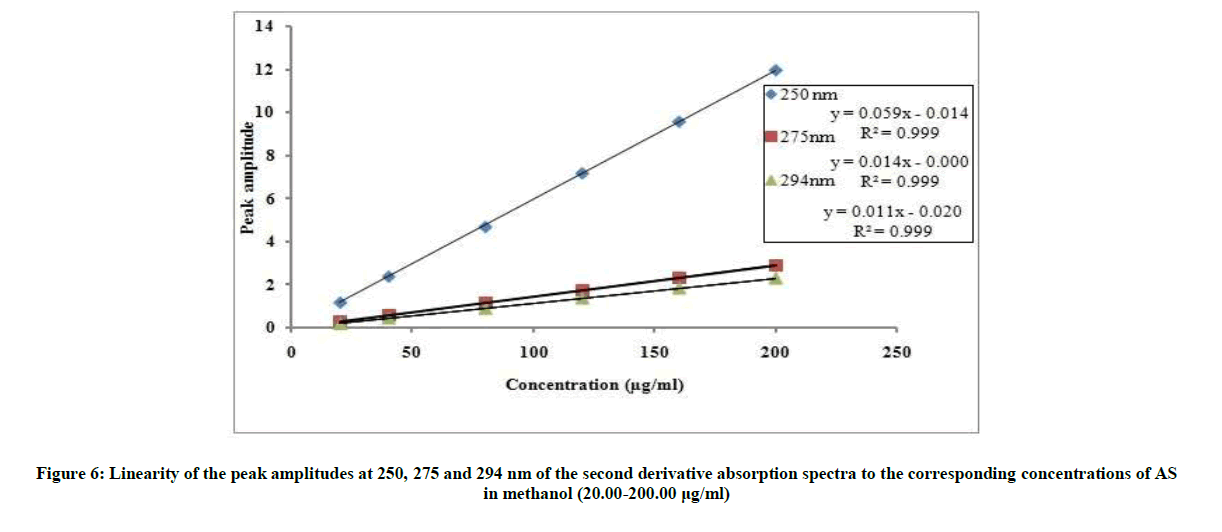
Figure 6: Linearity of the peak amplitudes at 250, 275 and 294 nm of the second derivative absorption spectra to the corresponding concentrations of AS in methanol (20.00-200.00 μg/ml)
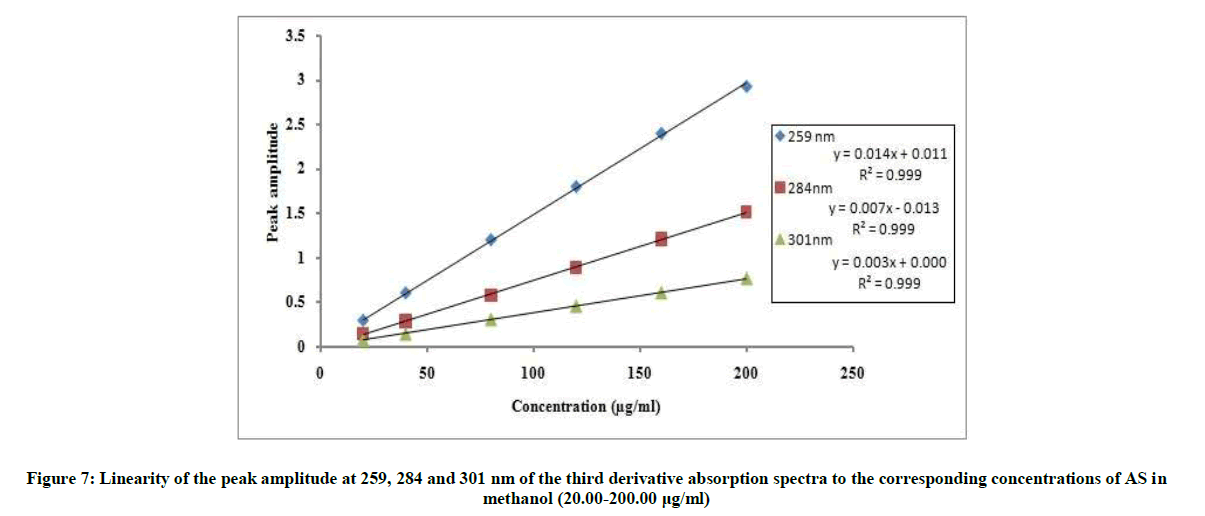
Figure 7: Linearity of the peak amplitude at 259, 284 and 301 nm of the third derivative absorption spectra to the corresponding concentrations of AS in methanol (20.00-200.00 μg/ml)
2D250=0.0598C-0.0141, r=0.9999
2D275=0.0146C-0.0003, r=0.9999
2D294=0.0110C-0.0210, r=0.9999
For third derivative:
3D259=0.0148C + 0.0119, r=0.9995
3D284=0.0076C + 0.0139, r=0.9997
3D301=0.0038C + 0.0006, r=0.9998
Where, (2D250, 2D275 and 2D294)=The peak amplitudes at 250,275 and 294 nm; (3D259, 3D284 and 3D301)=The peak amplitudes at 259, 284 and 301 nm; C=Concentration of AS in μg/ml and r=The correlation coefficient.
Ratio difference (RD)
RD method is novel method that has the advantages of minimal data processing and wider range of application. This method which depends on the difference in amplitude between two points on the ratio spectra of a mixture independence of the interfering component where the difference equal zero. This difference is directly proportional to the concentration of the drug [37-41]. Critical measurements were not needed in this method leading to highly reproducible and robust results. AS can be determined by this method, as the difference between the two selected wavelengths (261 and 291 nm) on the ratio spectra of the drug has significant contribution where the ratio spectra of the degradation product showed the same amplitudes (constant), (Figure 8).
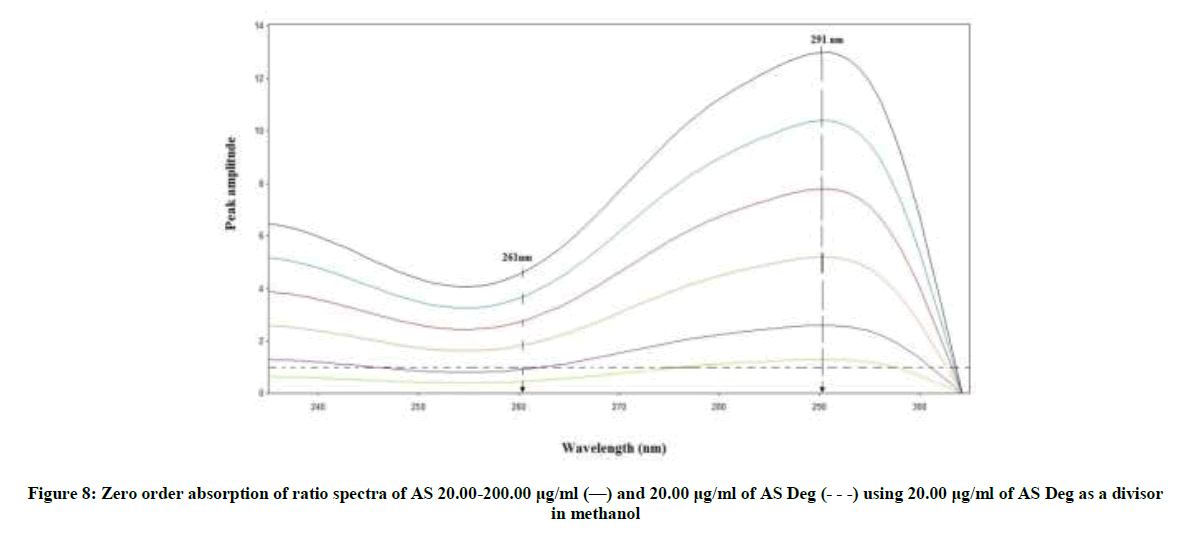
Figure 8: Zero order absorption of ratio spectra of AS 20.00-200.00 μg/ml (—) and 20.00 μg/ml of AS Deg (- - -) using 20.00 μg/ml of AS Deg as a divisor in methanol
The divisor was selected carefully as it gives maximum sensitivity and minimal noise. The zero spectra of AS (20-200 μg/ml) were divided by the spectrum of AS deg (20 μg/ml) and the concentration of AS was calculated using the regression equation. The linear relationship between the differences of amplitudes of the ratio spectra at the two selected wavelengths (261-291) versus the corresponding concentration of drug was constructed. The proposed RD method was linear in the range of 20-200 μg/ml, (Figure 9).
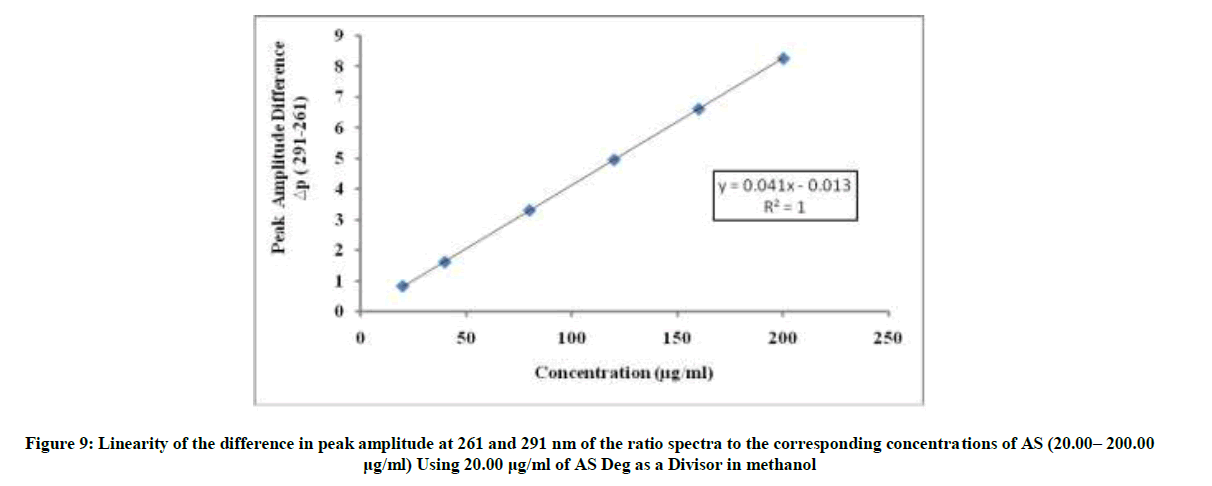
Figure 9: Linearity of the difference in peak amplitude at 261 and 291 nm of the ratio spectra to the corresponding concentrations of AS (20.00– 200.00 μg/ml) Using 20.00 μg/ml of AS Deg as a Divisor in methanol
ΔP(261-291)=0.0414C + 0.0132, r=0.9999
Where ΔP (261– 291)=Peak amplitudes difference at 261 and 291 nm, C=Concentration of AS in μg/ml and r=Correlation coefficient.
Derivative ratio (1DD)
1DD was investigated to determine AS with the main advantage that the whole spectrum of its degradation (AS deg) is cancelled [42-46]. After the ratio spectra were obtained, the first derivative of ratio spectra were calculated for AS and AS deg. AS can be determined at 272, 303 and 318 nm where AS deg showing zero crossing using scaling factor 10 and Δλ=2 nm, (Figure 10).
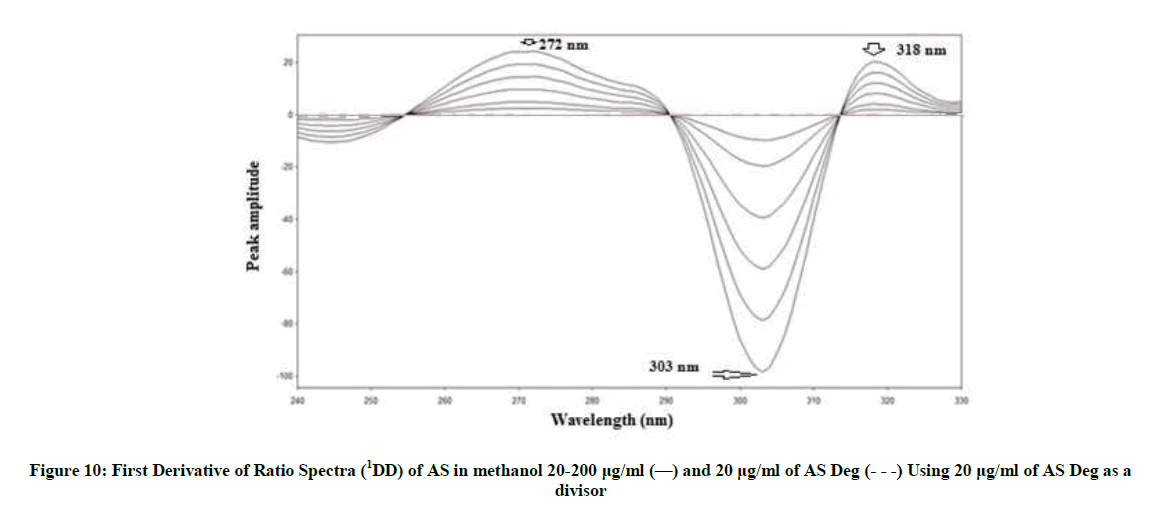
Figure 10: First Derivative of Ratio Spectra (1DD) of AS in methanol 20-200 μg/ml (—) and 20 μg/ml of AS Deg (- - -) Using 20 μg/ml of AS Deg as a divisor
The linear relationships between the peak amplitudes at the selected wavelengths versus the corresponding concentration of drug were constructed. The proposed 1DD method was linear in the range of 20-200 μg/ml, Figure 11.
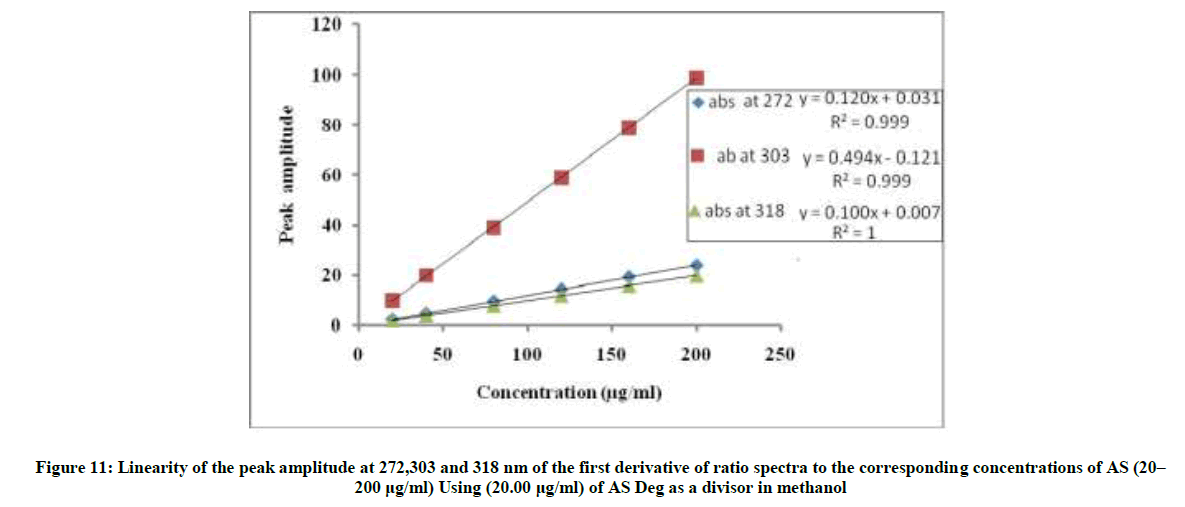
Figure 11: Linearity of the peak amplitude at 272,303 and 318 nm of the first derivative of ratio spectra to the corresponding concentrations of AS (20– 200 μg/ml) Using (20.00 μg/ml) of AS Deg as a divisor in methanol
1DD272=0.1204C + 0.0318, r=0.9999
1DD303=0.4945C-0.1219, r=0.9999
1DD318=0.1008C + 0.0074, r=1
Where, 1DD272, 1DD303 and 1DD318=Peak amplitudes at 272, 303 and 318 nm, C=Concentration of AS in μg/ml and r=Correlation coefficient.
Fluorimetric method
Spectrofluorimetric techniques offer much greater sensitivity than spectrophotometric ones. Fluorescence should be considered as a measuring technique for analysis of trace impurities in drug or in unit dose assays of alkaloids and steroids, which are administered at very low dose [47]. The proposed spectrofluorimetric determination of AS was depending on the measuring its native fluorescence in methanol.
Figure 12 showed that the methanolic solution of AS when excited at 270 nm it has maximum emission at 314 nm, while AS deg showed different λemi at 392 nm and λexit at 335 nm, Figure 13, so AS can be determined in presence its degradation product. The fluorescence intensity at λemi 314 nm of the mentioned concentrations of AS in methanol was recorded using λexit 270 nm against methanol (blank).
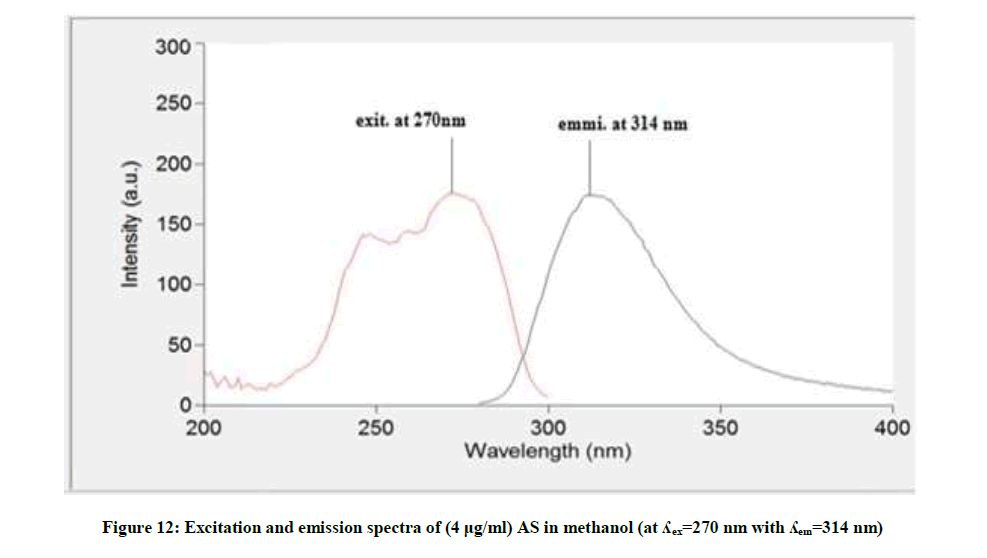
Figure 12: Excitation and emission spectra of (4 μg/ml) AS in methanol (at λex=270 nm with λem=314 nm)
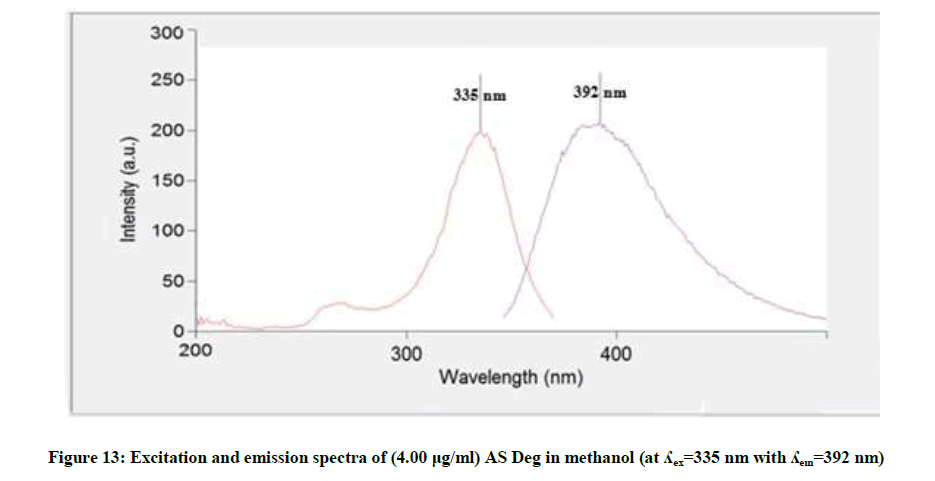
Figure 13: Excitation and emission spectra of (4.00 μg/ml) AS Deg in methanol (at λex=335 nm with λem=392 nm)
The linear relationship between the fluorescence intensity at 314 nm versus the corresponding concentration of drug was constructed. The proposed fluorimetric method was linear in the range of 1-10 μg/ml, (Figure 13).
If=23.6329C + 73.2301, r=0.9996
Where, If=Fluorescence intensity, C=Concentration of AS in μg/ml and r=Correlation coefficient.
Different factors affecting the fluorescence intensity were studied as type of diluting solvent, surfactant, heat and time. Methanol was the best solvent, removal of the surfactant and room temperature give maximum fluorescence intensity, Figures 14 and 15. The fluorescence intensity was stable up to 60 min (Figures 16 and 17).
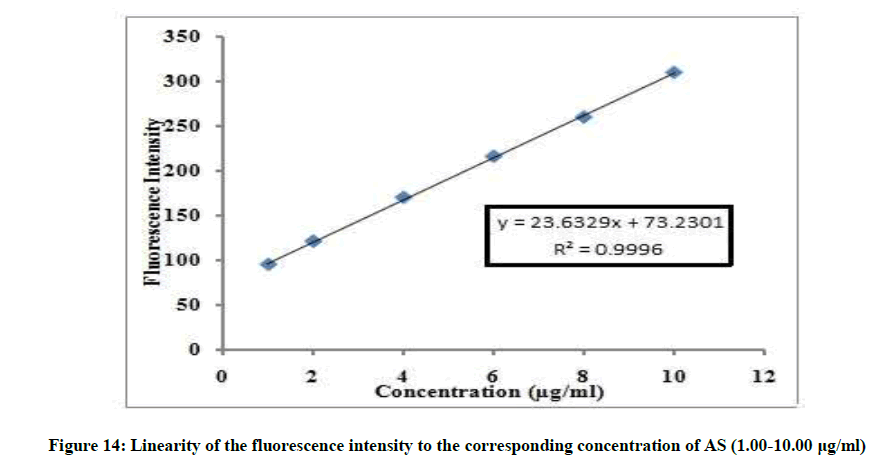
Figure 14: Linearity of the fluorescence intensity to the corresponding concentration of AS (1.00-10.00 μg/ml)
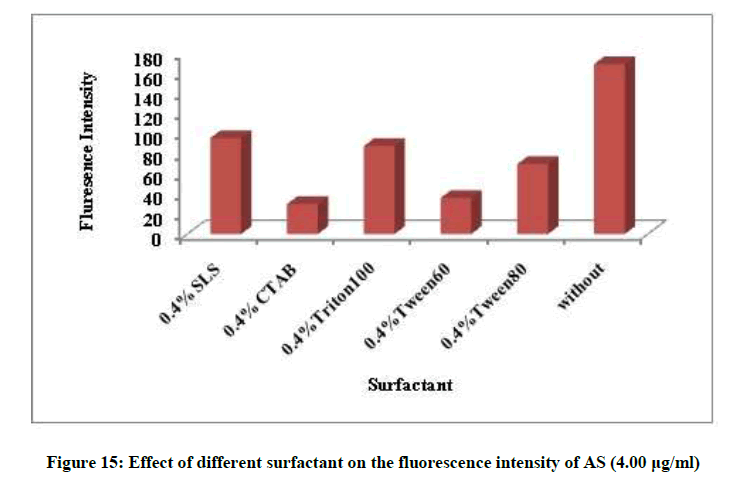
Figure 15: Effect of different surfactant on the fluorescence intensity of AS (4.00 μg/ml)
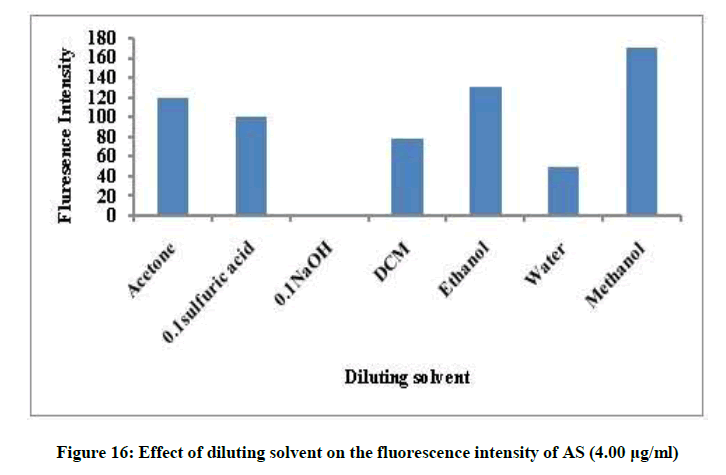
Figure 16: Effect of diluting solvent on the fluorescence intensity of AS (4.00 μg/ml)
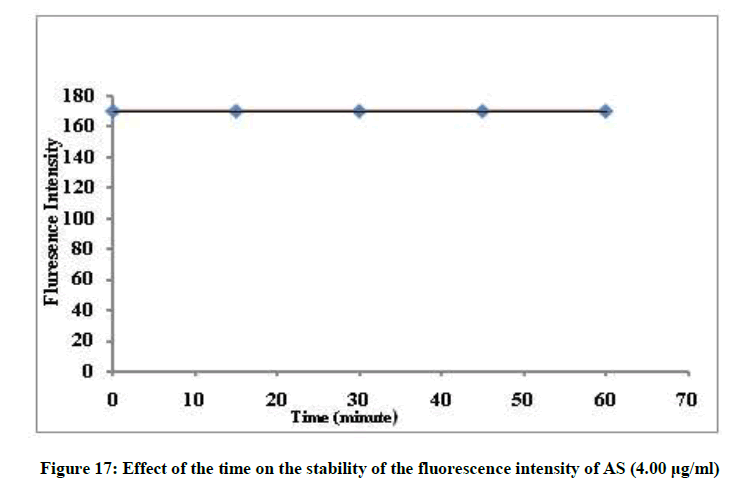
Figure 17: Effect of the time on the stability of the fluorescence intensity of AS (4.00 μg/ml)
Methods validation
Validation of the proposed methods was assessed according to ICH guidelines for:
Linearity
Different concentration of AS were analyzed on three different days using the proposed methods. Each concentration was repeated triplicate.
The linear regression equations and the validation parameter for all methods are listed in Table 1.
| Parameters | Method A | Method B | Method C | Method D | |||||||
|---|---|---|---|---|---|---|---|---|---|---|---|
| 2D | 3D | RD | 1DD | Fluorometry | |||||||
| At 250 nm | At 275 nm | At 294 nm | At 259 nm | At 284 nm | At 301 nm | At 272 nm | At 303 nm | At 318 nm | |||
| Concentration range (µg/ml) | 20-200 | 20-200 | 20-200 | 20-200 | 20-200 | 20-200 | 20-200 | 20-200 | 20-200 | 20-200 | 1-10 |
| Slopea | 0.06 | 0.015 | 0.011 | 0.015 | 0.008 | 0.004 | 0.041 | 0.120 | 0.495 | 0.101 | 23.633 |
| Intercepta | 0.014 | 0.0003 | 0.021 | 0.012 | 0.014 | 0.001 | 0.013 | 0.032 | 0.122 | 0.007 | 73.230 |
| Correlation coefficients | 0.9999 | 0.9995 | 0.9999 | 0.9995 | 0.9997 | 0.9998 | 1 | 0.9999 | 0.9999 | 1 | 0.9996 |
| Average accuracy (%) | 99.76 | 100.11 | 100.24 | 99.74 | 99.78 | 100.32 | 99.90 | 99.59 | 100.15 | 100.18 | 100.21 |
| Standard deviation | 0.451 | 0.663 | 0.289 | 0.602 | 0.717 | 0.497 | 0.596 | 0.389 | 0.497 | 0.664 | 0.466 |
| Relative standard deviation % | 0.452 | 0.662 | 0.288 | 0.604 | 0.719 | 0.495 | 0.597 | 0.391 | 0.496 | 0.663 | 0.465 |
| LOD (µg/ml) | 5.60 | 5.42 | 4.76 | 5.57 | 4.95 | 5.50 | 3.00 | 3.43 | 2.80 | 3.86 | 0.25 |
| LOQ (µg/ml) | 16.97 | 16.43 | 14.42 | 17.14 | 15 .00 | 16.67 | 9.09 | 10.39 | 8.49 | 11.70 | 0.76 |
| Precision | |||||||||||
| Repeatabilityb (%) | 0.827 | 0.721 | 0.321 | 0.673 | 0.871 | 0.273 | 0.657 | 0.427 | 0.321 | 0.424 | 0.856 |
| Intermediate precisionc (%) | 0.672 | 0.634 | 0.465 | 0.856 | 0.163 | 0.553 | 0.121 | 0.362 | 0.534 | 0.705 | 0.543 |
aResults of five determinations; bn=3 × 3; cn=3 × 3
Table 1: Results of assay validation obtained by applying the four proposed methods for the determination of AS in its pure powdered form
Accuracy
The accuracy of the results was checked by applying the proposed method for the determination of different samples of AS. The concentrations were obtained from the corresponding regression equations, as shown in Table 1.
Precision
Three concentrations of AS were analyzed three times each, on one day and on three consecutive days using the previously mentioned procedure under linearity. The results are presented in Table 1.
Specificity and selectivity
Analyzing laboratory prepared mixtures containing different percentage of the drug with its oxidative degradate proved the specificity of the proposed methods. From the data obtained 2D was specific for AS up to 30% at 275 and 294 nm and up to 50% at 250 nm in presence of AS deg, while the specificity was achieved by 3D method till 70% at 259 nm and 50% at 284 and 301 nm. RD and 1DD were most specific for AS up to 90%. The fluorimetric method was specific to As up to 50% in presence of As deg, Table 2.
| Deg % |
Methods (A), (B) and (C) | Method (D)Fluorimetry | |||||||||||||
|---|---|---|---|---|---|---|---|---|---|---|---|---|---|---|---|
| AS (mg/ml) |
As deg (mg/ml) |
Recovery % of 2D method | Recovery % of 3D method | Recovery % of RD method | Recovery % of 1DD method |
AS | As deg | Recovery % at 314 nm | |||||||
| (mg/ml) | (mg/ml) | ||||||||||||||
| At 250 nm | At 275 nm | At 294 nm | At 259 nm | At 284 nm | At 301 nm | (ΔP=261-291) | At 272 nm | At 303 nm | At 318 nm | ||||||
| 10 | 180 | 20 | 100.3 | 99.45 | 99.13 | 100.3 | 99.45 | 99.85 | 100.62 | 99.45 | 99.35 | 99.77 | 9 | 1 | 99.87 |
| 30 | 140 | 60 | 100.5 | 99.73 | 99.64 | 100.5 | 99.73 | 100.63 | 100.43 | 99.76 | 99.37 | 99.94 | 7 | 3 | 100.53 |
| 50 | 100 | 100 | 101 | 109.23* | 105.17* | 100.7 | 100.12 | 100.12 | 100.32 | 99.88 | 99.59 | 99.31 | 5 | 5 | 101.06 |
| 70 | 60 | 140 | 105.34* | - | - | 101 | 106.06* | 106.56* | 100.11 | 100.28 | 100.19 | 99.45 | 3 | 7 | 112.66* |
| 90 | 20 | 180 | - | - | - | 107.32* | - | - | 99.76 | 100.43 | 100.33 | 100.57 | 1 | 9 | - |
| Mean | 100.6 | 99.59 | 99.39 | 100.63 | 99.77 | 100.2 | 100.25 | 99.96 | 99.77 | 99.81 | 100.49 | ||||
| RSD | 0.359 | 0.199 | 0.363 | 0.297 | 0.338 | 0.395 | 0.328 | 0.397 | 0.464 | 0.495 | 0.465 | ||||
Average of three determinations
Table 2: Specificity of the four proposed methods for the determination of AS in laboratory prepared mixtures containing different concentration of AS and AS deg
Detection and quantification limits
The LOD and LOQ of AS were calculated using the proposed methods with a ratio of 3.3 and 10 standard deviations of the blank and the slope of the calibration line, as shown in Table 1.
Robustness and ruggedness
Small deliberate variations of the experimental conditions for UV and fluorometry were applied in order to determine the robustness of the methods. Using methanol from different company, different temperature have not a significant change on the spectra of AS, demonstrated sufficient stability.
The ruggedness of the proposed methods was studied using three concentrations of AS that analyzed in a different laboratory using different UV apparatus (Shimadzu 1260) and different Shimadzu RF spectrofluorimeter apparatus did not have a significant effect on the UV spectra and fluorescence spectra which proved good stability upon change the laboratory or even the instrument.
The suggested methods were applied for the analysis of AS in its dosage form (asenapine tablet) Furthermore, the validity of the all methods were assessed by applying the standard addition technique, as represented in Table 3, mean percentage recoveries revealed that any excipients have no interference effect, that may be found in the tablet forms. The results obtained by applying the 4 proposed methods for the analysis of AS in pure form were statistically compared with the method supplied by the manufacturer. The values of the calculated t and F are less than the tabulated ones which reveal that no significant difference as shown in Table 4.
| Pharmaceutical formulation | Method A | |||||||
|---|---|---|---|---|---|---|---|---|
| 2D | 3D | |||||||
| Asenapine-Hikma Pharma (AS) tablets, BN:003 | Standard added (µg/ml) | Recovery** % of Standard added at 250 nm | Recovery** % of Standard added at 275 nm | Recovery** % of Standard added at 294 nm | Standard added (µg/ml) | Recovery** % of Standard added at 259 nm | Recovery** % of Standard added at 284 nm | Recovery** % of Standard added at 301 nm |
| 20 | 99.18 | 99.61 | 99.96 | 20 | 99.8 | 99.1 | 99.26 | |
| 40 | 99.73 | 99.79 | 99.26 | 40 | 99.3 | 99.7 | 99.86 | |
| 80 | 100.41 | 98.15 | 100.74 | 80 | 100.1 | 98.1 | 100.54 | |
| Mean ± SD | 99.77 ± 0.618 | 99.18 ± 0.907 | 99.99 ± 0.741 | Mean ± SD | 99.73 ± 0.405 | 98.97 ± 0.817 | 99.89 ± 0.641 | |
| Found% * of Claimed amount ± S.D | 99.88 ± 0.619 | 100.30 ± 0.147 | 100.17 ± 0.618 | 100.16 ± 0.606 | 100.62 ± 0.285 | 100.18 ± 0.481 | ||
| Method B (RD) | Method C (1DD) | Method D | ||||||
| Standard added (µg/ml) | Recovery** % of Standard added |
Standard added (µg/ml) | Recovery** % of Standard added at 272 nm |
Recovery** % of Standard added at 302 nm |
Recovery** % of Standard added at 318 nm |
Standard added (µg/ml) | Recovery** % of Standard added at 314 nm |
|
| 20 | 99.76 | 20 | 99.53 | 99.31 | 99.16 | 2 | 100.22 | |
| 40 | 99.54 | 40 | 99.93 | 99.89 | 99.28 | 4 | 99.76 | |
| 80 | 99.45 | 80 | 100.61 | 99.15 | 100.34 | 6 | 99.78 | |
| Mean ± SD | 99.58 ± 0.160 | Mean ± SD | 100.02 ± 0.545 | 99.45 ± 0.391 | 99.59 ± 0.652 | Mean ± SD | 99.92 ± 0.260 | |
| Found% * of Claimed amount ± S.D | 100.63 ± 0.296 | 99.75 ± 0.471 | 100.47 ± 0.220 | 100.31 ± 791 | 100.21 ± 0.466 | |||
Claimed amount 40 (μg/ml) in method A, B and C while 4 (μg/ml) in method D - *average of five determination - **average of three determination
Table 3: Determination of AS in pharmaceutical formulation by the four proposed methods and application of standard addition technique
| Item | Method (A) | Method (B) RD |
Method (C) | Method (D) Fluorimetry |
Reported *Method (14) | |||||||
|---|---|---|---|---|---|---|---|---|---|---|---|---|
| 2D | 3D | 1DD | ||||||||||
| At 250 nm | At 275 nm | At 294 nm | At 259 nm | At 284 nm | At 301 nm | (ΔP=261-291) | At 272 nm | At 303 nm | At 318 nm | |||
| Mean | 99.76 | 100.11 | 100.24 | 99.74 | 99.78 | 100.32 | 99.90 | 99.59 | 100.15 | 100.18 | 100.21 | 100.10 |
| S.D. | 0.451 | 0.663 | 0.289 | 0.602 | 0.717 | 0.497 | 0.596 | 0.389 | 0.497 | 0.664 | 0.466 | 0.310 |
| R.S.D.% | 0.452 | 0.662 | 0.288 | 0.604 | 0.719 | 0.495 | 0.597 | 0.391 | 0.496 | 0.663 | 0.465 | 0.310 |
| Variance | 0.203 | 0.440 | 0.084 | 0.362 | 0.432 | 0.247 | 0.355 | 0.151 | 0.247 | 0.441 | 0.217 | 0.096 |
| n | 6 | 6 | 6 | 6 | 6 | 6 | 6 | 6 | 6 | 6 | 6 | 6 |
| Student’s t (2.228) | 1.093 | 0.025 | 0.571 | 0.965 | 0.762 | 0.667 | 0.541 | 1.783 | 0.152 | 0.201 | 0.347 | _ |
| F-test (6.260) | 2.110 | 4.580 | 1.143 | 3.771 | 4.500 | 2.573 | 3.698 | 1.573 | 2.573 | 4.594 | 2.260 | _ |
Figures in parentheses are the corresponding tabulated values at p = 0.05;*HPLC method
Table 4: Statistical comparison between results obtained of the four proposed methods and the manufacturer method for determination of AS in pure powdered form
Conclusion
The presented spectrophotometric and fluorimetric methods have many advantages of being accurate, precise, sensitive and inexpensive. These methods could be applied for the quantitative determination of Asenapine in pure powdered form, in dosage form and also in presence of its oxidative degradate in quality control laboratories where economy and time are essential. From the data obtained it is proved that the presented fluorimetric method was more sensitive than the other spectrophotometric methods for the determination of AS even though the RD and 1DD methods are more specific for determination of AS in presence of its oxidative degradate.
References
- J.E.M. Van Der Sterren, D.J.M. Van Den Heuvel, Intranasal administration of asenapine and pharmaceutical compositions therefore, 2008, US 2008/0306133 A1.
- M. Shahid, G.B. Walker, S.H. Zorn, E.H. Wong, J. Psychol. Pharmacol., 2009, 23(1), 65-73.
- A. Kiran, K.T. Manish, N. Raghunandan, JAPS., 2012, 2(8), 141-145.
- Y. Mrudulesh, P. Ravisankar, Ch. Devadasu, B.P. Srinivasa, JPCS., 2013, 6(4), 227-230.
- O.A. Halima, T.P. Aneesh, G. Reshma, R.T. Nathasha, Der Pharma Chemica., 2012, 4(2), 644-649.
- A.A. Borkar, N.J. Gaikwad, IJPSR., 2016, 7(7),3080-3084.
- M.L. Surekha, M. Swapna, G.K. Swamy, Indo Am. J. Pharm. Res., 2013, 3, 4637-44.
- M. Caitlin, P. Oscar, A. Dan, M.M. Diane, W. Norman, J. Anal. Toxicol., 2013, 7, 559-64.
- V. Ambavaram, R. Bhaskar, V. Nandigam, M.S. Gajulapalle, J Pharm. Anal., 2013, 3(6), 394-401.
- B. Theo, M. Erik, M. Henri, W. Jaap, D. Peter, L. Holger, Biomed. Chromatogr., 2012, 26(2), 156-165.
- G. Nagarajan, K. Shirisha, M. Archana, P. Sravanthi, B.V. Ramana, DPL.,2012.
- P. Chander, T. Mehta, Thermo. Fisher Sci. Inc. Appl. Note.,2013, 20, 739.
- A. Kiran, K.T. Manish, N. Raghunandan, J. Chem. Pharm. Res., 2012, 4(5), 2580-2584.
- T.R. Parthasarathi, T.S. Srinivas, Sri. M.S. Vanitha, S. Ram, M.M. Basha, P. Rajesh, Int. J. Pharm. Bio. Sci., 2012, 3, 360-366.
- Y. Geetharam, G.V. Ramamohan, P.P. Srikumar, G.V. Rusyendra, N. Lavanya, Asian J. Pharm. Anal. Med. Chem., 2013, 1, 132-139.
- G. Kumaraswamy, M.L. Surekha, M. Swapna, Contemp. Invest. Obser. Pharm., 2013, 2(3), 79-84.
- V.W. Krebbers, S.F. Jacobs, M.P.L. Kemperman, G.J. Spaans, E. Peters, P.A.M. Delbressine, Drug Metabol. Dispos.,2011, 39, 580-590.
- B. Theo, M. Erik, M. Henri, W. Jaap, D. Peter, L. Holger, Bio. Chromatogr., 2012, 26, 1461-1463.
- U.K. Chhalotiya, K.K. Bhatt, D.S. Shah, J.R. Patel, Sci. Pharm., 2012, 80, 407-417.
- R. Narke, S. Mandlik, S. Kapure, Invent. Impact. Bio. Anal., 2015, 1, 5-8.
- T.P. Aneesh, A. Rajasekaran, J. Int. Pharm. Pharm. Sci., 2012, 4(4), 448-451.
- G.L. Kalpana, G. Devalarao, M.B. Raju, T. Praveenkumar, J. Int. Pharm. Pharm. Sci., 2015, 7(11), 61-65.
- B.K. Yadav, N.K. Sathish, M. Lamichhane, A. Acharya, Der Pharma. Lett.,2015, 7(6), 214-219.
- B.R. Patel, S.N. Naregalkar, R.M. Patel, J. Liq. Chromatogr. Related Technol., 2015, 38(19), 1731-1739.
- N.K. Ramadan, T.A. Mohamed, R.M. Fouad, A.A. Moustafa, JPC., 2017, 30(4), 313-322.
- The European Agency for the Evaluation of Medical Products ICH Topic, Q2B Note for Guidance on Validation of Analytical Procedures; Methodology, CPMP/ICH/281/95, 1985.
- Manufacturer’s procedure, supplied by Hikma pharma Co. (Cairo, Egypt) by personal communication.
- R.J. Smith, M.L. Webb, Analysis of Drug Impurities, Blackwell, USA, 2007, 2-3.
- G.H. Jeffery, J. Bassett, J. Mendham, R.C. Denney, Vogel’s Textbook of Quantitative Chemical Analysis 5th Edi., Longman Scientific and Technical, USA, 1996, 668-670.
- A.M. Gillespie, Manual of Spectrophotometric and Spectrofluorimetric Derivative Experiment, CRC Press, USA, 1993, 47.
- M. Thomas, Ultraviolet and Visible Spectroscopy 2nd Edi., John Wiley & Sons Inc., USA, 1996, 143-145.
- S. Altinoz, D. Tekeli, J. Pharm. Biomed. Anal., 2001, 24(3), 507-515.
- D. Bonazzi, R. Gotti, V. Andrisano, V. Cavrini, J. Pharma. Biomed. Anal., 1997, 16(3), 431-438.
- H. Hopkala, D.Kowalczuk, Acta Poloniae Pharmaceutica., 2000, 57(1), 3-13.
- D. Castro, M.A. Moreno, S. Torrado, J.L. Lastres, J. Pharm. Biomed. Anal., 1999, 21(2), 291-298.
- A. El-Gindy, B. El-Zeany, T. Awad, M.M. Shabana, J. Pharm. Biomed. Anal., 2002, 27(1-2), 9-18.
- H.M. Lotfy, S.S. Saleh, N.Y. Hassan, S.M. Elgizawy, Am. J. Anal. Chem., 2012, 3, 761-769.
- A. Samir, H. Salem, M. Abdelkawy, Bull. Faculty of Pharm. Cairo University., 2012, 50, 121-126.
- S.S. Saleh, H.M. Lotfy, N.Y. Hassan, S.M. Elgizawy, Saud. Pharm. J., 2013, 21(4), 411-421.
- P. Shakya, P.K. Jain, A. Gajbhiye, S.P. Shrivastava, Int. J. Pharm. Pharm. Sci., 2015, 7(6), 386-388.
- E.S. Elzanfaly, A.S. Saad, A.E.B. Abd Elaleem, J. Pharm. Anal., 2012,2(5), 382-385.
- E.S. Elzanfaly, A.S. Saad, A.E.B. Abd-Elaleem, Saud. Pharm. J., 2012, 20, 249-253.
- E.S. Elzanfaly, A.S. Saad, A.E.B. Abd-Elaleem, Pharm. Anal. Acta., 2012, 3(3), 153-156.
- H.M. Lotfy, M.A. Hagazy, Spectrochim. Acta Part A: Mol. Biol. Spectrosc., 2012, 96, 259-270.
- H.M. Lotfy, M.A. Hegazy, S. Mowaka, E.H. Mohamed, Spectrochim. Acta Part A: Mol. Biol. Spectrosc., 2015, 140, 495-508.
- A. Samir, H.M. Lotfy, H. Salem, M. Abdelkawy, Spectrochim. Acta Part A: Mol. Biol. Spectrosc., 2014, 128, 127-136.
- W.R.G. Baeyens, Ed. S.G. Schulman; Molecular Luminescence Spectroscopy, Methods and Application, Part 1. Willey, New York, 1985.


