Research Article - Der Pharma Chemica ( 2020) Volume 12, Issue 5
Gaussian Mixture Models, Monte Carlo-and Model Selection for Fluorodeoxyglucose (18F) Positron Emission Tomography
Mohamed S Nasr Eldin1, Diana Abass1 and Hala M Ahmed2*2Medical Biophysics - Biomedical Equipment, Faculty of Applied Medical Sciences-October 6 University, Egypt
Hala M Ahmed, Medical Biophysics - Biomedical Equipment, Faculty of Applied Medical Sciences-October 6 University, Egypt, Email: bakar_tarek_76@hotmail.com
Received: 31-Jul-2020 Accepted Date: Aug 23, 2020 ; Published: 31-Aug-2020
Abstract
In recent years, medical image registration has gained considerable attention to gather as much information as possible for the diagnosis of the disease. The purpose of this study was to apply positron emission tomographic (PET) detector technology for simultaneous PET imaging of the human brain and skull base. Following phantom studies, five patients were simultaneously examined by using fluorine 18 fluorodeoxyglucose (FDG) PET imaging. We simulated spheroid geometry with a radius of (199 mm), patient bore with of radius of (185 mm), which is compatible with brain size. Positron emission tomography with 2- fluorine-18] fluoro-2-deoxy-d-glucose allows detection of neurodegenerative disorders earlier than is otherwise possible. PET data enabled accurate registration of morphologic and multifunctional information. Simultaneous PET imaging is feasible in humans; opening up new possibilities for the emerging field of molecular imaging. The evaluation study indicates that the spheroid geometry delivers better axial resolution whereas.
Keywords
PET, Spheroid design, Monte Carlo Simulation, Gaussian model
Introduction
The human brain is the most complex organ in the human body, having a complicated anatomy and physiology, which is working with almost all other organs through trillions of synapses [1]. Positron Emission Tomography (PET) amyloid imaging has a profound effect on ageing and dementia research. The first publication of an amyloid- selective imaging agent, carbon-11 labelled Pittsburgh compound-B opened the door to in vivo detection of a core aspect of Alzheimer’s disease pathology [2]. Soon afterwards, 18F-labelled amyloid imaging agents were developed and commercialized, widely increasing the availability of this technology. The ability to detect and quantify febrile brain amyloid in vivo has helped to establish models of disease pathophysiology and biomarker progression and guide the design of clinical trials [3-5].
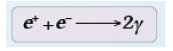
Physical principles of PET imaging include several steps which begin with choosing the molecule of interest. This molecule has to be located radioactively and the product of this step is called tracer [6]. PET imaging is based on detecting pairs of gamma rays which are indirectly emitted by the positron-emitting radionuclide (tracer) - which will play the role of an active molecule in the body [7]. The basic of image acquisition is similar to all computed-tomography techniques. The radiation caused by the annihilation step will be detectable in the output. The next step is image reconstruction [8]. The Monte Carlo method has been widely used for solving problems involving statistical processes in medical physics. In nuclear medical imaging, this method has been applied to detector modeling, imaging systems and collimator design, image reconstruction algorithm, etc [9].
Aim of the Work
The purpose of this study was to apply positron emission tomographic (PET) detector technology for simultaneous PET imaging of the human brain. Following phantom studies, two patients were simultaneously examined by using fluorine 18 fluorodeoxyglucose (FDG) PET. Functional imaging of the brain is one of the most rapidly advancing areas of neuroscience and Positron Emission Tomography (PET) plays a major role in this progress. Simultaneous PET imaging is feasible in humans, opening up new possibilities for the emerging field of molecular imaging. PET data enabled accurate Eco registration of morphologic and multi-functional information.
Materials and Methods
Patient Preparation and Technique
Five patients were obtained for PET examinations of patients with a history of cancer who had undergone routine clinical fluor ine 18 fluorodeoxyglucose (FDG) PET imaging for follow-up. Patients is asked to avoid any caloric intake for at least 4–6 hours before the study [10]. Serum glucose is measured before the injection of FDG injection, and fasting levels are typically 70–110 ng/dl, which are ideal for an FDG-PET scan. patient’s serum glucose levels greater than 200 ng/dl are usually not scanned, because this may lead to hyperglycemia which leads to competitive inhibition of FDG uptake into patients’ cells.
After administration of FDG, patients are waited in a quiet room in a comfortable and relaxes position to avoid distractions, and asked to decrease their movements and talking, for 45 minutes prior to scanning. This period is considered the uptake phase for biodistribution and transportation of FDG into patient’s cells diabetics patients with is instructed to take the insulin at least 4–6 hours before starting the procedure. The patients are placed in supine position on the machine table and the venous access is determined for injecting the FDA, patients are injected by 140 μCi/kg of FDG with a minimum of 10mCi and a maximum of 20 mCi. Fixed doses of 20 mCi is used. Therefore, FDG uptake is reduced in whole brain noise is increased [11]. The PET examinations were performed in October 2019 (Dar Elfwad-6October, Giza, Egypt). Compounds with positron emitting Radioisotopes probes as molecular probes. FDG is injected into the body (stay for 50 min). FDG spreads via blood stream till it enter organs. Positron wills travels a short distance (0.5 mm in water) before it annihilates with an electron.
Mass is converted into Energy (2 photons of 511 KeV). An electronic signal (Resolving time 6-15 ns). Reconstruction of images.
Fluorine-18 (18F) Radionuclide Preparation
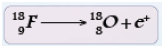
Short enough to minimize the radiation exposure to the patients. Fluorine is lies in Group 7 of periodic tables. In patients takes 370 MBq. Fluorine- 18 (18F) is a fluorine radioisotope which is an important source of positrons. It has a mass of 18.0009380 (6) u and its half -life is 109.771(20) minutes. It decays by positron emission 97% of the time and electron capture 3% of the time. Both modes of decay yield stable oxygen-18.
Gaussian Mixture Models Analysis
A Gaussian mixture model is a probabilistic model assuming that the overall data distribution can be estimated from a mixture of Gaussian distributions. We fit from 1 to 11 Gaussian distributions to our data and used a Bayesian information criterion (BIC) to assess the optimal number of Gaussian distributions represented in our data. We found that the best fit for our data was two Gaussian distributions, which is consistent with a previous report using different data sets [12]. PET works by using a scanning device. The machine with a large hole at its center to detect photons subatomic particles emitted by a radionuclide in the organ being examined. The lattice parameters of LSO were investigated by [13]. If no refraction or diffraction the photon beams travel along straight lines that are not bent by the objects they pass through. Gamma rays with energies of (88, 202, & 307 keV) are emitted and produce an intrinsic background of about 40 counts/sec per gram of LSO crystal. To image the annihilation radiation, one should profit from its unique properties
Two Collinear photons at angle (180o) and the energy of each photon (511 keV).
Time-Of-Flight (TOF) PET
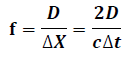
Measurement of the time at which each γ-ray arrives at the detector localization within the collimator is designed to partially mask detector crystals to detect lines of response (LORs) within fractional crystals. Time difference between signals from two crystals measured. Annihilation point along LOR directly calculated Technology for Time-Of-Flight (TOF) PET fast scintillating materials. Signal shape of a PET detector based on LSO (Ce) material. LSO (Ce) is the only scintillator available at this time that offers a density greater than 7, an atomic number above 60, decay time less than 50 ns, and light yield in excess of 30,000 ph/MeV. The timing resolution of commercial scanners 500 ps for a system with timing resolution Δ��, the position resolution Δx along LOR is given by:

cis the speed of the light c=3x10⁸m/sec Length of LOR constrained down to =7.5 cm from that of conventional scanners (>> 7.5 cm). Statistical noise in the measurement reduced SNR improved Noise variance1 reduction factor f for patient of size D is given by:
Field-of-view (FOV) is the sensitive volume inside the detector cylinder that a patient can occupy. The cylindrical model has ring radius of (175 mm) and therefore patient bore radius and trans axial FOV in this scanner is (185 mm). Design characteristics of spheroid scanner has diameter (397mm), patient bore (350 mm), crystal size (2.3x2.3x20 mm), axial FOV (210 mm) and block detector size (70x70x20 mm).
Scintillation Properties
The incident photon creates tens of thousands visible wavelength photons (about 1 eV energy each (1 eV=1.6 x10¹⁹J). For PET imaging, units of kilo electron volts (1 keV=103 eV) and mega electron volts (1 MeV=106 eV) are commonly used. The number of scintillation photons produced in the crystal is proportional to the energy deposited by the annihilation photon. Large number of small scintillation crystals placed in circular ring surrounding patient with diameter 85 cm for abdominal scanner 45 cm for head scanner. Large block of scintillating material equal (50 × 50 × 30 cm3). Inorganic scintillator with high density, high Z, and quick decay time has been the dominant detector technology for PET. The scintillation mechanism depends on the energy states of the crystal lattice of the material. The (511 keV) gamma rays interact with the scintillation crystal and produce photoelectrons or Compton electrons. These energetic electrons produce a large number of electron-hole pairs that can drop into the impurity sites within the crystal lattice. Electrons at the excited states release energy through fluorescence to produce light photons, which are then detected by secondary photon detectors [14].
Photon Detection efficiency (PDE)
The scintillation material for use in Photon detection efficiency (PET) has the stopping power dependent on atomic number of material Z and density. The inverse of the mean distance traveled by photons before depositing energy in the crystal .High detection efficiency for (511 kev) γ-rays. Scintillator materials for PET LSO (Ce) has short decay time (40 ns) to allow for short coincidence resolving time .High light yield 0.75 to reduce the complexity and cost of the system and efficiency about 0.69. Emission wavelength (λ=420 nm) that corresponds to maximum sensitivity for a good energy resolution and the refractive index about (n=1.82).The energy resolution depends on the intrinsic energy resolution of the crystal and the light output. Photon detection efficiency was measured by a (1 MBq) gamma back to back photon source stepped at (2.5 cm) increments in axial and radial direction. We analytically calculated PDE of scanner caused by the point source placed in center of FOV. The PDE of a PET scanner is given by:
Photon detection efficiency (PDE) = Ei × Eg
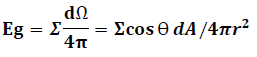
Geometric efficiency (Eg), intrinsic efficiency (Ei). The total geometric efficiency is given as follows [15,16].
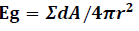
Where r is the distance from the point source to the detector surface and n is normal vector of detector surface, dA is finite detector element area which is seen by point source. We estimate the differential solid angle (dΩ) and integrate the entire interior detector surface area of the cylindrical PET systems as follows:
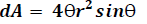
Where θ1 (0 ≤ θ1 <π/2) and θ′1 (0 ≤ θ′1 < π/2) are the angle in X and Z direction respectively. Because we used square block detector so we would have θ1=θ′1.
Image acquisition
For image quality evaluation, we simulated phantom composed of spheres with different diameter of (1.5, 2 & 2.5 mm) with activity of (9, 10 &12.5 MBq) in 5 segments. After simulation, we used STIR3.0 framework to reconstruct obtained projections [17]. A (180 x 180 image) matrix was used with (1.2 mm) pixel size. The spheres in obtained image were analyzed to evaluate spheres resolving by 1D line intensity profile as contrast criteria. Three-dimensional filtered back projection (FBP3D) algorithm using a ramp filter with a cut-off frequency of (0.5 cm-1) used to reconstruct the image and then trans axial, radial and axial spatial resolution were calculated based on fitting Gaussian function to the plotted profiles and measuring of their Full width at half maximum (FWHM).
Monte Carlo Simulations
Monte Carlo methods are numerical calculation methods based on random variable sampling. The technique of random sampling to solve mathematical problems has been known since 1770.We used Monte Carlo simulation to generate realistic PET data acquisition process is not a perfect one [18]. Interactions in the patient attenuate the emitted photons, detector elements vary in their detection efficiency, and random and scattered coincidences are recorded along with the true coincidence events. These effects need to be corrected to obtain clinically useful images and accurate quantitative information from PET studies. Monte Carlo Simulation the overall spatial resolution is expressed as the Full-Width-Half-Maximum of the spread function. Allocating values to segmented regions based on realistic clinical distributions of 18F–FDG and 18F labeled amyloid tracers. Most regions were allocated uniform activity; however, variability was introduced in some regions to reflect departures from the assumption that all regions could be considered uniform.
Results
In Figure 1 we observe that PDE is highly significantly reduced by axial displacement of point source for spheroid scanner has diameter (397mm). The detection efficiency for scanners was measured with a 1 MBq gamma back to back point source, which stepped at (2.5 cm) steps in axial and radial direction in two energy windows (250-750 keV). (a) Axial direction detection efficiency and radial direction detection efficiency (250-750 keV). (b) Axial direction detection efficiency and radial direction detection efficiency (410-613 keV).

Figure 1: The detection efficiency for spheroid scanners were measured with (1 MBq gamma)
The two Gaussian distributions are presented in Figure 2. Based on the model, each subject was assigned a probability of belonging to either distribution.

Figure 2: Gaussian mixture model containing two mixtures (high and low distribution)
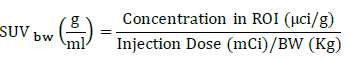
In Figures 3 & 4 we measurements from the PET/CT were collected on images reconstructed with both TOF and Q. Clear®, as well as without TOF and Q. Clear®. Images were reviewed and analyzed by (Radiant DICOM Viewer) which is used on the specified region of interest (ROI) by applying the interest circle on the detected lesions and on the normal tissues to measure the maximum and mean standardized uptake values (SUV max (g/ml) - SUV mean (g/ml)) which represents the semiquantitative measurement of degree of F-18 FDG accumulation in the ROI to the total injected dose and the patient body weight (BW) [19]. Maximum and mean standardized uptake values were recorded (SUV max (g/ml) - SUV mean (g/ml)); lesion-to-blood pool SUV max (g/ml) and lesion-to brain SUV max (g/ml) were also used as relative measure of contrast. The SUV bw (g/ml) is given by:

Figure 3: A PET CT examination of 35 years old patient with sever headach concentrated on the left side of the brain, the images A,B,C and D are a PET CT images shows a well-defined focal lesion located medially in the left hemisphere of the brain

Figure 4: The ROI circle is located to the focal lesion on the left hemisphere and on the right hemisphere to a normal tissue with the same area to measure the area, mean, SUV max, SUV min and SD
In Figure 3 measuring the ROI area, maximum and mean standardized uptake values were recorded (SUV max(g/ml) -SUV mean (g/ml)) in the conventional PET images in different windows on the Radiant DICOM Viewer , A. CT image, the normal measured area=2.052 cm2, SUV mean (g/ml)=35.45 (g/ml), SUV max(g/ml)=50 (g/ml), SUV min (g/ml)=24 (g/ml) and SD=5.416 while the lesion measured area=2.04 cm2, SUV mean(g/ml)=45 (g/ml), SUV max(g/ml)=67(g/ml) , SUV min (g/ml)=25 (g/ml) and SD=9.258. B. after up taking the FDG, the normal measured area = 2.052 cm2, SUV mean(g/ml)=15210.44(g/ml) , SUV max(g/ml) =19014.47(g/ml) , SUV min(g/ml)=13245.09 (g/ml) and SD=1804.50 while the lesion measured area=2.065 cm2, SUV mean(g/ml)=19151.55 (g/ml), SUV max(g/ml) =22791.47(g/ml) , SUV min (g/ml) = 16368.67(g/ml) and SD=191.19. C. The normal measured area=2.052 cm2, SUV mean (g/ml=1017.93 (g/ml), SUV max(g/ml) =4054.20 (g/ml) , SUV min(g/ml)= 2321.43 (g/ml) and SD=485.27 while the lesion measured area=2.052 cm2, SUV mean (g/ml)=1724.90(g/ml), SUV max(g/ml)=4952.98(g/ml) , SUV min(g/ml)=3004.16 (g/ml) and SD= 612.55.D. The normal measured area=2.052 cm2, SUV mean(g/ml)=14446.02(g/ml) , SUV max(g/ml) =20372.69(g/ml) , SUV min(g/ml)=11508.96 (g/ml) and SD=2556.40 while the lesion measured area =2.052, SUV mean(g/ml)=19182.77 (g/ml), SUV max (g/ml)=27218.85(g/ml) , SUV min(g/ml)=13963.77 and SD=3593.57.
In Figure (4) measuring the ROI area, maximum and mean standardized uptake values were recorded (SUV max—SUV mean) in different windows on the Radiant DICOM Viewer, A. The normal measured area=2.052cm2, SUV mean (g/ml) = 5.193(g/ml) , SUV max(g/ml) =6.41(g/ml) and SUV min(g/ml)=4.56(g/ml) while the lesion measured area=2.04 cm2, SUV mean(g/ml)=6.477(g/ml) , SUV max(g/ml)=7.723 (g/ml) and SUV min (g/ml)=6.664(g/ml) . B. The normal measured area=2.023 cm2, SUV mean (g/ml)=35.97 (g/ml), SUV max (g/ml)=51 (g/ml) and SUV min=24 while the lesion measured area =2.065, SUV mean(g/ml) = 46.62 (g/ml) , SUV max (g/ml)=75 (g/ml) and SUV min=25.C. The normal measured area=2.052 cm2, SUV mean(g/ml)=35.45(g/ml) , SUV max (g/ml)=50(g/ml) and SUV min(g/ml)=24(g/ml) while the lesion measured area=2.052 cm2, SUV mean (g/ml)=44.51(g/ml) , SUV max (g/ml)=69(g/ml) and SUV min(g/ml)=25(g/ml) .D. The normal measured area=2.052 cm2, SUV mean (g/ml)=35.45(g/ml) , SUV max(g/ml)=50(g/ml) and SUV min (g/ml)=24 (g/ml) while the lesion measured area=2.052 cm2, SUV mean (g/ml)=44.51(g/ml) , SUV max (g/ml)=69 (g/ml) and SUV min(g/ml)=25(g/ml) .
We observe that PDE is highly significantly in the reconstructed images for spheroid design. The results showed spheroid design provides good axial resolution. The angled Θ detector in axial direction in spheroid design provides relatively perpendicular angle for emitted photons. The perpendicular angle between detector and emitted photons causes minimal deflection inside of the crystals and deposit their energy by crystals interaction, therefore parallax error would be reduced and axial spatial resolution would be improved.
Discussion
PET is a highly useful imaging modality for the diagnosis of primary neurodegenerative disorders. Patterns of altered cerebral glucose metabolism seen at FDG PET are useful as imaging biomarkers to assist in making the clinical diagnosis of neurodegenerative diseases causing dementia. In this study, first of all, photon detection efficiency of point source in axial and radial position in tight and loose energy window were measured by GATE simulation toolkit. The results of analytical calculation showed us the cylindrical design provides 10 % efficiency Difference in improvement of percentage between analytical and simulation results is due to analytical geometrical efficiency an estimation which were calculated without considering energy and coincidence time window does not explicitly consider scatter and random events [20].
The use of Monte Carlo methods was advantage by the possibility of using general purpose codes developed for high energy physics or dosimeter Monte Carlo simulation and indicated that when we want to design a head size compatible spheroid PET based on block detector configuration, we inevitably must increase scanner radius for proper placement of detectors on spheroid surface so this diameter increase degrades the detection efficiency. Several SPECT/PET dedicated Monte Carlo software packages were developed for simulating a variety of emission tomography studies. Among them, public domain codes have been made available in last years, allowing the use of the Monte Carlo method by the whole scientific community and even in the clinical environment.
The Gaussian mixture model analyses suggested a similar DVR cut-off of 1.09. Based on an independent longitudinal study using a similar processing method [21]. These results showed spheroid design provides good axial resolution than radial resolution. This is because angled detector in axial direction in spheroid design provides relatively perpendicular angle for emitted photons. The perpendicular angle between detector and emitted photons causes minimal deflection inside of the crystals and deposit their energy by crystals interaction. This paper is performance evaluation of spheroid design which was not considered as block detector placement drawbacks and the resulted gaps effects in previous studies [22].
Conclusion
The interpreting radiologist also needs to be aware of the terminology used by our neurology colleagues when reporting brain images. We concluded that cylindrical PET scanner has relatively better performance than spheroid design with block detector configuration.
References
[1] Christopher G Goetz. Textbook of clinical neurology. Elsevier Health Sciences, 3rd ed. 2007.
[2] WE Klunk, RA Koeppe, JC Price et al., Alzheimers. Dement., 2015, 11: p. 1-15.
[3] CR Jack, DS Knopman, WJ Jagust et al., Lancet. Neurol., 2013, 12: p. 207-16.
[4] CR Jack, DS Knopman, WJ Jagust et al., Ann. Neurol., 2012, 71: p. 765-75.
[5] S. Salloway, R. Sperling, NC Fox et al., N Engl J Med., 2014, 370: p. 322-33.
[6] P. Sheikhzadeh, H. Sabet, H. Ghadiri et al., Phys. Med., 2017, 40: p. 59-65.
[7] AM Alessio, CW Stearns, S Tong et al. IEEE Trans Med Imaging., 2010, 29: p. 938-49.
[8] E. Peter Valk, Dominique Delbeke, Dale L Bailey et al., Springer Science & Business Media 2006.
[9] H. Zaidi, Med. Phys., 1999, 26: p. 574-608.
[10] K. Kawasaki, K. Ishii, Y. Saito et al., Ann. Nucl,. Med., 2008, 22: p. 191-200.
[11] Urszula Kiendys, Hamphrey Ham, Wouter Bauters et al., Rep. Med. Imaging., 2009, 2: p. 1-6.
[12] EC Mormino, RA Betensky, T. Hedden et al., Neurology., 2014, 82: p. 1760-7.
[13] AJ González, S. Majewski, F. Sánchez et al., Nucl. Instrum. Methods. Phys. Res. A., 2016, 818: p. 82-90.
[14] SC. Strother, ME. Casey and EJ. Hoffman. IEEE Trans. Nucl. Sci., 1990, 37: p. 783-88.
[15] F. Habte, AM. Foudray, PD. Olcott PD et al., Phys Med Biol., 2007, 52: p. 3753-72.
[16] H. Tashima and T. Yamaya. Phys Med Biol., 2016, 61: p. 7205-20.
[17] K. Thielemans, C. Tsoumpas, S. Mustafovic et al., Phys Med Biol., 2012, 57: p. 867-83.
[18] A. Reilhac, C. Lartizien, N. Costes et al., IEEE Transactions on Nuclear Science NS-51., 2004, p. 46-52.
[19] Paul E. Kinahan and James W. Fletcher. Semin Ultrasound CT MR., 2010, 31(6): p. 496-505.
[20] Donya Rahmani, Mahesan Niranjan, Damien Fay et al., Elsiever, Pattern Recognition Letters., 2020, 131: p. 1-480.
[21] VL. Villemagne, S. Burnham, P. Bourgeat et al., Lancet. Neurol., 2013, 12: p. 357-67.
[22] NM. Moghaddam, A. Karimian, SM. Mostajaboddavati et al., Nukleonika., 2009, 54: p. 33-8.


