Research Article - Der Pharma Chemica ( 2018) Volume 10, Issue 7
Properties of Genotype and Environment on Diterpene Glycosides Content and Composition of the Sweet Herb, Stevia Rebaudiana Bertoni Cultivated in Morocco
Abdelkarim Khiraoui1,2, Abdelali Boulli1*, Fatima Zahra Amchra2, Abderrahmane Benhmimou2, Ahmed Douaik2, Aziz Hasib3, Mohamed Bakha2 and Chaouki Al Faiz2
1Equipe d’écologie et développement durable, Faculté des Sciences et Techniques, Université Sultan Moulay Slimane, Beni Mellal, Maroc
2Institut National de Recherche Agronomique "INRA", CRRA -Rabat, Rabat, Maroc
3Equipe des procédés agro-industriels et environnementaux, Faculté des Sciences et Techniques, Université Sultan Moulay Slimane, Beni Mellal, Maroc
- *Corresponding Author:
- Abdelali Boulli
Equipe d’écologie et développement durable
Faculté des Sciences et Techniques
Université Sultan Moulay Slimane
Beni Mellal, Maroc
Abstract
Stevia rebaudiana Bertoni is a perennial shrub of the Asteraceae family, native to Paraguay. This plant is in high demand by the pharmaceutical, food and beverage industries as a source of steviol glycosides (SVglys) contained in the leaves. It is an alternative source of non-caloric and high potency natural sweeteners. S. rebaudiana produces steviol glycoside sweeteners in its leaves that are up to 240 times sweeter than sugar. The two main SVglys are stevioside and rebaudioside A. As an introduced species in Morocco, it is important to elucidate the genetic variability and relatedness among stevia accessions in order to broaden the genetic basis for future stevia breeding. Along with an evaluation of the chemical variability of S. rebaudiana genotypes (SVglys content and composition), this study investigates the effect of perennial cultivation on the difference these genotypes through an experiment conducted in six locations in Morocco. HPLC (high-performance liquid chromatography) analysis of the genotypes showed a high variability in SVgly content (from 11.4% to 19.1% DM). Moreover, the stevioside content varied between 6.49% (Berkane) to 9.56% (Agadir) and rebaudioside A content varied between 2.95% (Larache) to 5.74% (Berkane), The dendrogram separated the 55 genotypes into four main groups have been identified. The different variabilities observed among of S. rebaudiana genotypes are a promising indicator towards the development of new stevia varieties. This valuable information will be able to assist parental selection in future stevia breeding programs
Keywords
Stevia rebaudiana, Genotype, Environment, Steviol glycoside variability, Morocco.
Abbreviations
SVglys: Steviol glycosides; Reb: Rebaudioside; STV: Stevioside; Dul: Dulcoside
Introduction
Stevia rebaudiana Bertoni is a branched bushy shrub of the Asteraceae family, native to the Amambay region in the north east of Paraguay. It also occurs in the neighboring parts of Brazil and Argentina [1]. Today, its cultivation has spread to other regions of the world, including Canada and some parts of Asia and Europe [2]. Among the 230 species in the genus Stevia, only the species S. rebaudiana and S. phlebophylla A. Gray produce steviol glycosides [3].
The sweetness of these glycosides compared to sucrose is dulcoside A 50-120, rebaudioside A 250-450, rebaudioside B 300-350, rebaudioside C 50-120, rebaudioside D 250-450, rebaudioside E 150-300, steviobioside 100-125, and stevioside 300 [4]. The sugar units are mainly β-glucose (glc) and to a lesser extent α-rhamnose (rhm) and β-xylose (xyl). More rarely, β-fructose units have also been identified [5].
All diterpene glycosides isolated from S. rebaudiana leaves have the same steviol backbone and differ mainly in the content of carbohydrate residues (R1 and R2), mono-, di-, and trisaccharides, containing glucose and/or rhamnose at positions C13 and C19 [6]. The best-known SVglys are Stevioside (STV), Rebaudioside A (Reb A), Dulcoside A (Dul A) and Rebaudioside C (Reb C). The chemical structures of stevioside and its related compounds are shown in Figure 1. STV is estimated to be 250-300 times sweeter than sucrose but has a bitter aftertaste. Reb A is sweeter than STV (300-350 times sweeter than sucrose) and has more pleasant sensory characteristics [7].
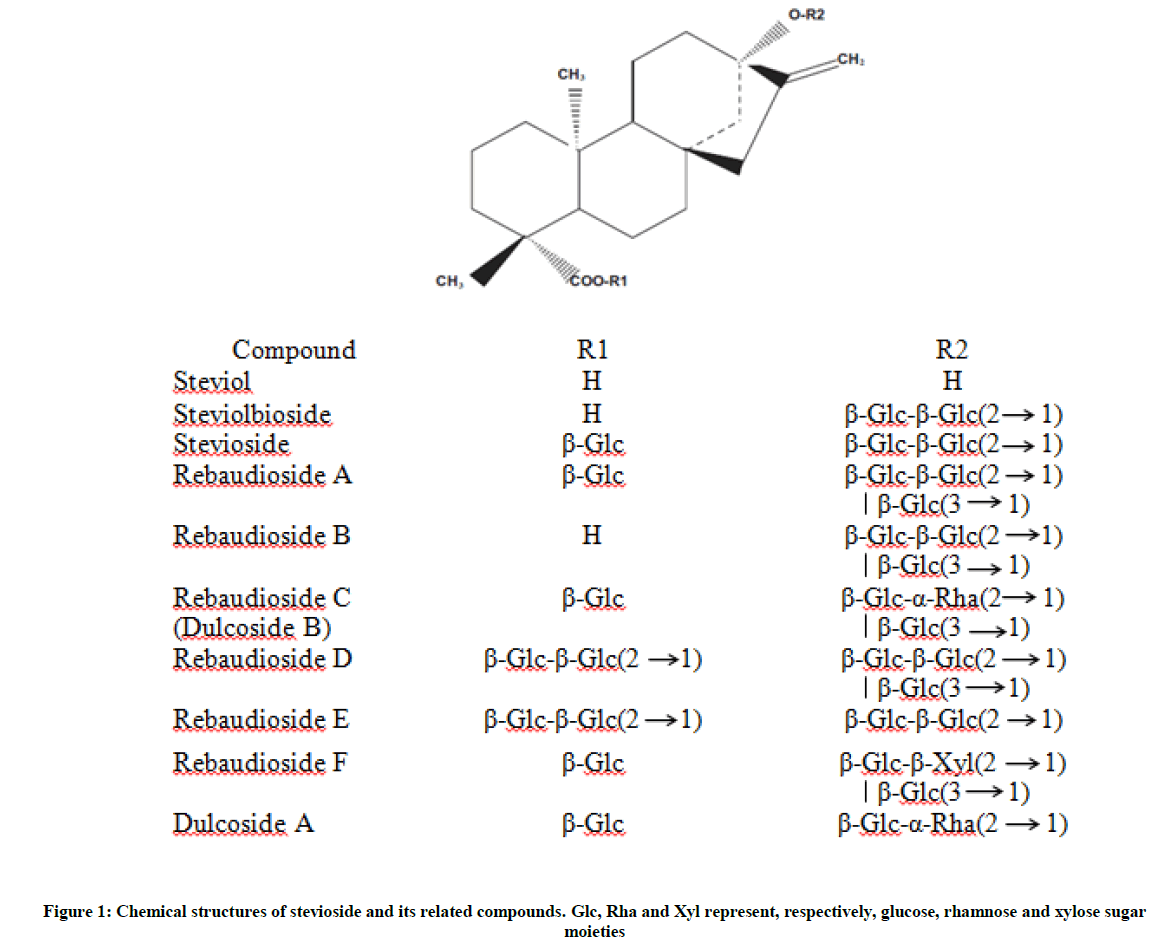
Figure 1: Chemical structures of stevioside and its related compounds. Glc, Rha and Xyl represent, respectively, glucose, rhamnose and xylose sugar moieties
Stevia and stevioside have been applied as substitutes for saccharose, for treatment of diabetes mellitus, obesity, hypertension and caries prevention [8], and a number of studies have suggested that, besides sweetness, stevioside, along with related compounds which include rebaudioside A, steviol, and isosteviol, may also offer therapeutic benefits, as they have anti-hyperglycemic, antihypertensive, anti-inflammatory, anti-tumour, anti-diarrhoeal, diuretic, and immunomodulatory effects [9,10]. Stevia is a perfect answer to the needs of consumers and constitutes a source of many substances with a nutritional effect on the human organism. It is an important ingredient in many food products due to its great benefits [11,12].
In S. rebaudiana, maximal SVgly content in the leaves is generally reached near the end of flower bud formation [13], although its spatial and temporal accumulation pattern during ontogeny is significantly influenced by photoperiod [14], intra- and inter-cultivar variations [15], temperature and available nutrients [16]. Since S. rebaudiana is an obligate short-day (SD) plant, long-days (LDs) sustain vegetative growth, thereby significantly increasing leaf biomass and SVglys content [17].
Steviol glycosides are synthesized via the plastidial methylerythritol 4-phosphate (MEP) pathway resulting in a close relationship between SVgly accumulation and chloroplast differentiation [18]. In stevia leaves, the carbon flow is mainly directed between the MEP and the shikimic acid pathways [19]. Although SVgly constitutes a large carbon pool, they have a very small turnover rate rendering them unsuitable for use as a short-term carbon reservoir [20]. The physiological function of SVgly is still unknown. Some reports suggest a role as protectants against insect herbivory [21].
The present investigation was undertaken to assess the variability in SVgly content and composition among S. rebaudiana genotypes cultivated in different regions in Morocco, and evaluate their adaptation to climate variation.
Materials and Methods
Plant material and growth conditions
A total of 55 genotypes of S. rebaudiana was randomly selected in a heterogeneous population of n. L. Chrestensen (a native population originating from Germany). These genotypes were reproduced by seedlings from greenhouse grown stock plants, during the year 2015/2016.
The 55 genotypes were transplanted in the experimental field the beginning of May 2015 in six different areas in Morocco viz., Agadir (10 genotypes), Berkane (10 genotypes), Larache (6 genotypes), Marrakech (10 genotypes), Rabat (9 genotypes) and Sefrou (10 genotypes). Field characteristics of the six sites are summarized in Table 1. All genotypes were harvested in August 2015 at the floral button.
| Latitude N | Longitude W | Bioclimat | T mean (°C) | T max (°C) | T min (°C) | Soil characteristics | |
|---|---|---|---|---|---|---|---|
| Agadir | 30°30’ | 9°33’ | Arid | 24.3 | 31 | 17.5 | Sandy |
| Berkane | 34°55’ | 2°19’ | Semi-arid | 20.9 | 27 | 13 | Silt |
| Larache | 35°09’ | 6°08’ | Sub-humid | 21.6 | 26.5 | 14 | Sandy loam |
| Marrakech | 31°37’ | 8°30’ | Semi-arid | 25.1 | 32 | 17 | Sandy clay |
| Rabat | 33°58’ | 6°51’ | Sub-humid | 22.9 | 30.5 | 16 | Sandy loam |
| Sefrou | 33°49’ | 4°51’ | Sub-humid | 22.4 | 29 | 13 | Clay loam |
Table 1: Geographical characteristics of the studied regions and climatic characteristics from transplanting to harvest are the same for the six sites
Steviol glycosides content and composition in leaves
For each sampling, the aerial part of the plants was harvested. Leaves and stems were separated by hand and dried at 40°C for 48 h.
Conventional extraction method
Conventional extraction was performed with 1 g of stevia leaves, by adding 40 ml of distilled water maintaining at 60°C for 120 min with magnetic. The crude extract containing SVgly was filtered, 20 μl of the resulting solution were injected into a high-performance liquid chromatography (HPLC).
HPLC analysis of extracts
All the extracts were diluted with deionized water and filtered through a 0.45 μm cellulose membrane filter (Xilab, Belgium) before being subjected to HPLC analysis. The HPLC system consisted of a Dionex P680 pump, a Dionex ASI-100 automated sample injector, a Dionex Ultimate 3000 Column Compartment (Thermo Scientific, France), a diode array detector (DAD) (Hewlett Packard, France) and piloted by a Chromelon chromatography data system (Thermo Scientific, France) to obtain chromatographic profiles of the extracts. Separation was performed with the mobile phase which consisted of 0.1% aqueous formic acid (solvent A) and acetonitrile (solvent B) (69: 31 v/v) as isocratic at flow rate of 1 ml/min for 30 min. Samples were injected (20 μl) onto an apolar reversed-phase C18 column (250-4.6 mm ID, 5 μ, Phenomenex, Le Pecq, France) at 40°C. Chromatograms were recorded at 200 nm. The standards used in the experiments were weighed and dissolved in deionized water. For quantification, ST was used as the external standard. Results were expressed as quantity per unit leaf dry mass (mg g-1 DM) for each SVgly and for the SVglys total content. The individual proportion of each SVgly was also expressed as the percentage of the SVglys total content.
Statistical analysis
The data were statistically analyzed using one-way analysis of variance (ANOVA), by comparing mean values of the six locations and the 55 genotypes. The significance of the F-test was estimated at P<0.05. A Duncan multiple range test was used to identify homogeneous groups among genotypes. Statistical analyses were executed after arc sinus square root transformation of percentages. Principal Component Analysis (PCA) was performed to examine the correlation between different genotypes and chemical constituents. Cluster Analysis (CA) was carried out to determine the various groups to which the different samples refer. Statistical analyses were carried out using SAS (Statistical Analysis Software).
Results and Discussion
The results of the SVgly content obtained from dried stevia plant are shown in Table 2. Differences in data showed that leaves had a Reb A ranging from 2.95% to 5.74%, in Larache and Berkane regions, respectively. These levels are higher than those reported by [22,23]. The analyzed stevia leaves contain a quite high percentage of STV compared to other regions, ranging from 6.49% to 9.56%, in Berkane and Agadir regions respectively. These findings are in agreement with those of [24-26].
| Reb A | STV | Reb F | Reb C | Dul A | SVglys tot | ||
|---|---|---|---|---|---|---|---|
| Agadir | Mean ± SE | 3.41bc ± 0.53 | 9.56a ± 0.81 | 0.30bc ± 0.02 | 1.20ab ± 0.13 | 1.21a ± 0.14 | 15.83 ± 0.80 |
| Min-Max | 0.90-5.10 | 6.10-14.40 | 0.10-0.40 | 0.60-1.90 | 0.60-2.10 | 14.03-17.62 | |
| Berkane | Mean ± SE | 5.74a ± 0.26 | 6.49b ± 0.54 | 0.33bc ± 0.02 | 1.49a ± 0.08 | 0.40c ± 0.06 | 14.59 ± 0.60 |
| Min-Max | 4.40-6.80 | 3.30-9.00 | 0.20-0.40 | 1.10-2.00 | 0.10-0.80 | 13.22-15.95 | |
| Larache | Mean ± SE | 2.95c ± 0.95 | 8.83ab ± 1.11 | 0.20d ± 0.04 | 1.08b ± 0.29 | 0.95ab ± 0.17 | 13.75 ± 0.61 |
| Min-Max | 0-5.00 | 5.20-12.90 | 0.10-0.30 | 0,10-1,70 | 0,6-1,60 | 12.16-15.33 | |
| Marrakech | Mean ± SE | 4.03ab ± 0.54 | 8.55a ± 0.67 | 0.48a ± 0.02 | 1.67a ± 0.23 | 0.68bc ± 0.19 | 15.54 ± 0,60 |
| Min-Max | 1.80-7.60 | 5.30-13.00 | 0. 40-0.60 | 1.00-3.50 | 0.30-2.30 | 14.17-16.90 | |
| Rabat | Mean ± SE | 4.05ab ± 0.27 | 8.62a ± 0.53 | 0.20c ± 0.03 | 1.44ab ± 0.80 | 0.83ab ± 0.09 | 15.4 ± 0.59 |
| Min-Max | 2.60-5.10 | 6.70-11,10 | 0.10-0.50 | 0.80-2.90 | 0.60-1.40 | 14.03-16.76 | |
| Sefrou | Mean ± SE | 4.36ab ± 0.60 | 7.35ab ± 0.51 | 0.38ab ± 0.02 | 1.46ab ± 0.13 | 0.70b ± 0.07 | 14.38 ± 0.63 |
| Min-Max | 1.30-7.20 | 4.70-10.60 | 0.30-0.50 | 1.00-2.30 | 0.70-1.10 | 14.44-15.80 |
Table 2: Average of sweet glycoside contents (%) in Stevia rebaudiana leaves cultivated in different geographical areas in Morocco. Values are expressed as the mean ± SE. The letters a,b,c and d are the groups identified by Duncan test. These letters are significantly different among regions at P0.05
The present study was carried using 55 genotypes of S. rebaudiana collected from six regions in Morocco. The analyzed stevia leaves contain Reb F, Reb C and Dul A at percentages ranging from 0.20% to 0.48%, 1.08% to 1.67% and 0.40% to 1.21%, respectively. These Reb C levels are similar to those reported by [22], and for Dul A, the percentage was equal with or higher than that of [25,27].
A total of 5 compounds were identified. An ANOVA analysis was performed to evaluate if the variation among studied locations is significant. The analysis of variance showed highly significant variation for Reb F (P<0.001), significant for Reb A, STV and Dul A (P<0.05), and insignificant for Reb C (P>0.05) among the 55 genotypes.
A high variation of SVglys content among of the 6 studied regions was revealed. Thus, the total SVgly content was not correlated with the individual SVglys proportions. This suggests that the glucosylation pathway may be less active than the rhamnosylation and xylosylation pathways in such genotypes. Further investigations are needed to validate these two assumptions [28].
In this study, significant correlations exist between the 5 compounds of SVglys (Table 3). In all the studied genotypes, the content of Reb A was negatively correlated with both STV (-0.603) and Dul A (-0.652). In contrast, different pairs of compounds: Reb C and Reb F (0.606), Reb A and Reb C (0.470), STV and Dul A (0.514), were positively related. The correlation is found positive between the total steviol glycosides and STV, Reb F.
| Reb A | STV | Reb F | Reb C | Dul A | SVglys tot | |
|---|---|---|---|---|---|---|
| Reb A | 1 | r’ = -0.6035 p= <.0001** |
0.2333 0.0864 |
0.4705 0.0003 |
-0.6529 <.0001** |
|
| STV | -0.6035 <.0001** |
1 | -0.0325 0.8137 |
-0.3870 0.0035** |
0.5147 <.0001** |
|
| Reb F | 0.2333 0.0864 |
-0.0325 0.8137 |
1 | 0.6067 <.0001** |
-0.0445 0.7468 |
|
| Reb C | 0.4705 0.0003** |
-0.3870 0.0035** |
0.6067 <.0001 |
1 | 0.0407 0.7676 |
|
| Dul A | -0.6529 <.0001** |
0.5147 <.0001 |
-0.0445 0.7468 |
0.0407 0.7676 |
1 | |
| SVglys tot | 0.1863 0.1731 |
0.6037 <.0001** |
0.3804 0.0042** |
0.2979 0.0272* |
0.2486 0.0671 |
1 |
r’=Pearson Correlation Coefficients; p= probability; **Correlation is significant at the 0.01 level, *Correlation is significant at the 0.05 level; SVglys tot: total steviol glycosides
Table 3: Correlations between the five compounds of SVglys of S. rebaudiana genotypes cultivated in different geographical areas in Morocco
It is well-known that SVgly content in leaves may range between 4% and 20% depending on environmental and agronomic factors [29]. In this study, SVgly total content varied widely over time and among different environments. Furthermore, strong Genotype x Environment interactions were emphasized and need to be taken into account in the choice of genotypes for cultivation. The positive effect of plant age on biomass accumulation is well described elsewhere [30]. This can be explained by the occurrence of genotypes devoided of Reb A and Reb C and their co-segregation is in agreement with the hypothesis of a single enzyme synthesizing both Reb A and Reb C [31]. While SVgly content varied among the different environments, SVgly composition remained stable.
The individual plants from the 55 genotypes were analyzed by HPLC for their leaves composition (Figure 2). This study showed high genotypic variability, and thus breeding potentialities, for SVgly content and composition. The STV was dominant in all the analyzed samples: 28.21%-86% and Reb A: 6.51%-58.12%; except the two genotypes G54 and G55 (Figure 2) from Larache region, characterized by the absence of this compound. Reb C amount ranged from 0.88 to 25.74%, Dul A varied from 0.85% to 16.91% and Reb F ranged between 0.66 and 4.4 1%.
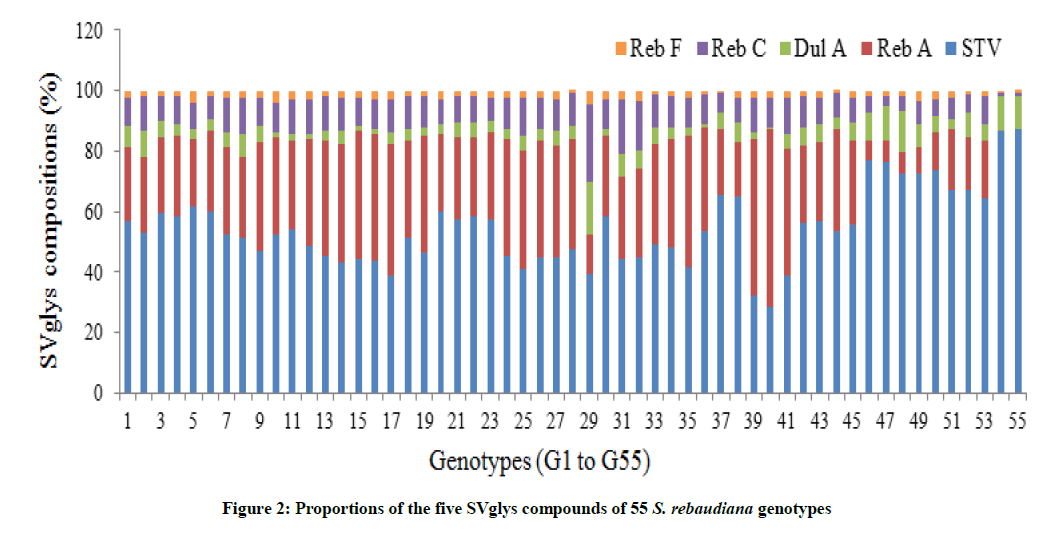
Figure 2: Proportions of the five SVglys compounds of 55 S. rebaudiana genotypes
The quantitative data obtained were subjected to principal component analysis (PCA). Five major compounds have been considered for the statistical analysis (STV, Reb A, Reb C, Reb F and Dul A). PCA reduced the five variables to two principal components with eigen values higher than 1. The first component (PC1), explaining 55.25% of the total variance, is the expression of the negative correlation between Reb A and Dul A (Figure 3). The second principal component (PC2), describing 26.63% of the data variability present the positive correlation between Reb A and Reb C. Figure 4 shows the distribution of the genotypes in the space of the first two principal components (PC1 and PC2). These latter explained cumulatively 81.88% of the total variance (Table 4). PC1 clearly separated S. rebaudiana plants rich in Dul A, observed mainly on the right side of Figure 4, from those that contain low amounts of Reb A, observed mainly on the left side.
| PC1 | PC2 | |
|---|---|---|
| RebA | -0.68* | 0.68* |
| STV | 0.34 | -0.21 |
| RebF | -0.06 | 0.29 |
| RebC | -0.05 | 0.83* |
| DulA | 0.92* | -0.06 |
| Eigen value | 2.76 | 1.33 |
| % of variance | 55.25 | 26.63 |
| Cumulative % of the variance | 55.25 | 81.88 |
Table 4: Loadings of 4 compounds on the first two PCs (The highest one (>0.5 threshold) are in bold)
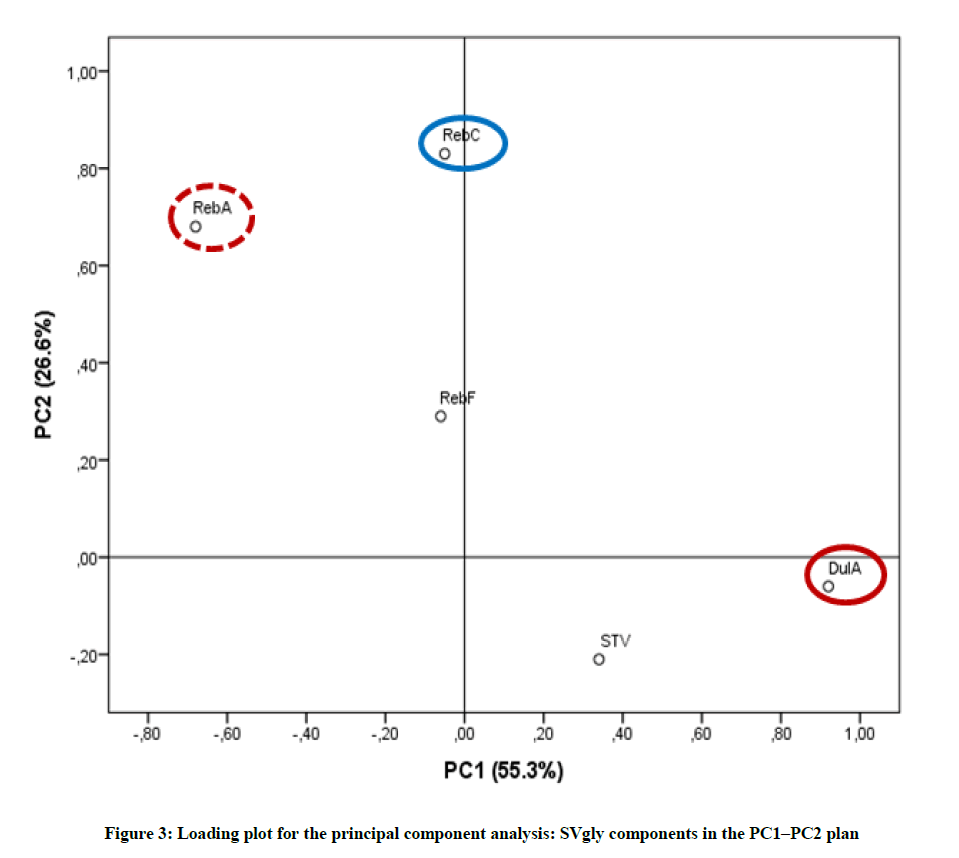
Figure 3: Loading plot for the principal component analysis: SVgly components in the PC1–PC2 plan
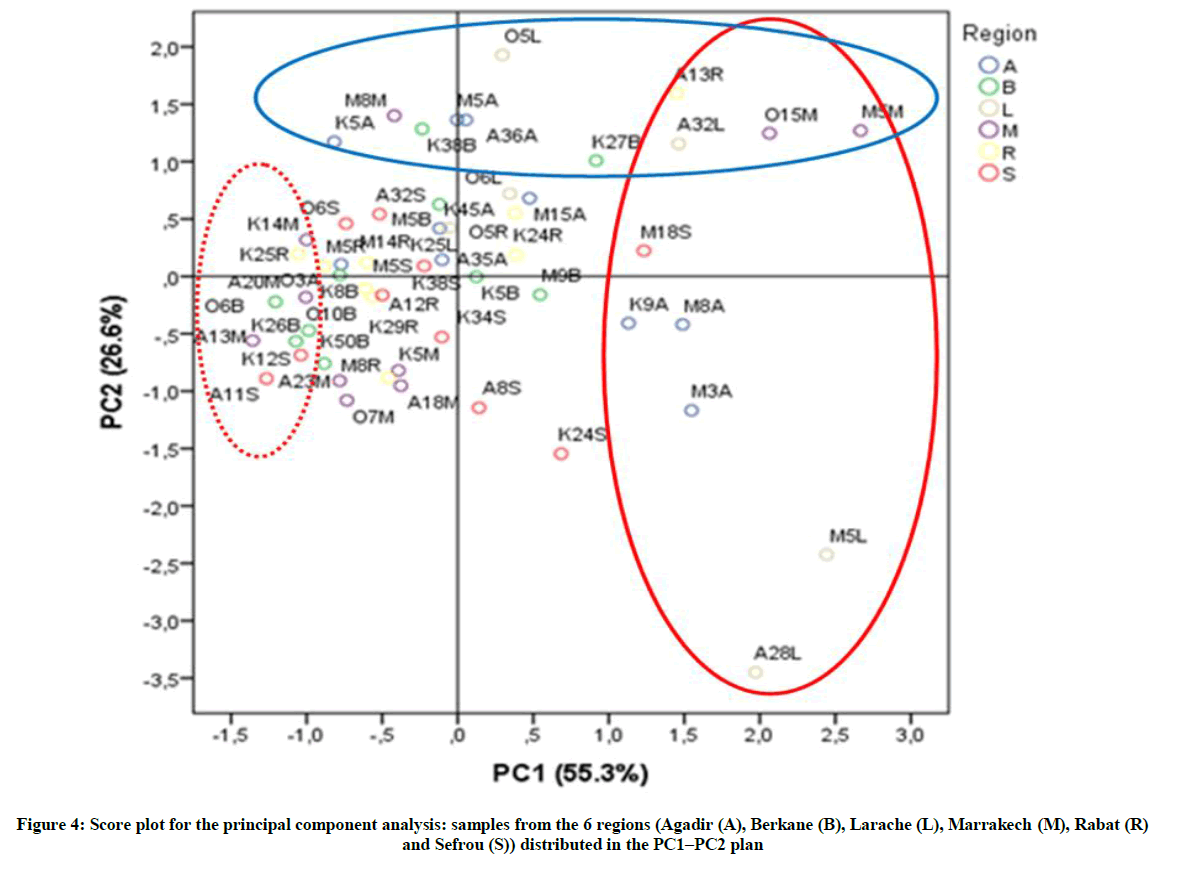
Figure 4: Score plot for the principal component analysis: samples from the 6 regions (Agadir (A), Berkane (B), Larache (L), Marrakech (M), Rabat (R) and Sefrou (S)) distributed in the PC1–PC2 plan
With regard to PC1, ten of the 55 genotypes (M5M, O15M, A32L, A13R, M18S, K9A, M8A, M3A, M5L, and A28L) have the strongest positive scores, indicating that they are characterized by high amount of Dul A and STV. Moreover, and with respect to PC1, most of studied genotypes are distributed on the left side of PC1, showing particularly high negative scores. These samples (A13M, K14M and A20M from Marrakech, K25R from Rabat, O3A from Agadir, O6B and K26B from Berkane, K12S and A11S from Sefrou) are characterized by high amount of Reb A content. Concerning PC2, samples O5L and A32L from Larache, A13R from Rabat, M5M, O15M and M8M from Marrakech, K27B and K38B from Berkane, and A36A, M5A and K5A from Agadir showed the highest positive scores and consequently, they have simultaneously the highest Reb A and Reb C content (Figure 4). From these results, it could be concluded that genotypes cultivated in the same area may present different chemical profiles. Therefore, a high presumably genetic effect may explain the observed variation of the different components, although environmental factors may possibly account for some parts of this variation. This could be of great interest for breeding program, aiming to select given desired varieties.
Figure 5 presents the dendrogram obtained from the cluster analysis using Ward method. Considering the 5 major constituents of the 55 genotypes, 4 major groups were defined, whose composition is summarized in Table 5. The resulting dendrogram reported in Figure 5 reflects the qualitative heterogeneity of S. rebaudiana grown in Morocco and showed the existence of variability within the different genotypes. The following groups have been defined:
| Content (%) | ||||
|---|---|---|---|---|
| SVglys | Group I (n=41) | Group II (n=4) | Group III (n=8) | Group IV (n=2) |
| Reb A | 4.47 ± 1.31 | 4.82 ± 0.25 | 1.96 ± 0.91 | 0 |
| STV | 7.20 ± 1.50 | 9.60 ± 1.13 | 11.40 ± 1.86 | 11.25 ± 2.33 |
| Reb C | 1.55 ± 0.49 | 1.52 ± 0.28 | 0.97 ± 0.24 | 0.15 ± 0.05 |
| Reb F | 0.35 ± 0.11 | 0.32 ± 0.15 | 0.33 ± 0.11 | 0.10 ± 0.00 |
| Dul A | 0.64 ± 0.37 | 0.95 ± 0.25 | 1.26 ± 0.53 | 1.45 ± 0.15 |
n: number of genotypes
Table 5: Composition of SVglys compounds representative of each defined group of Moroccan S. rebaudiana (main components, Contents % calculated using correction factors), based on the cluster analysis
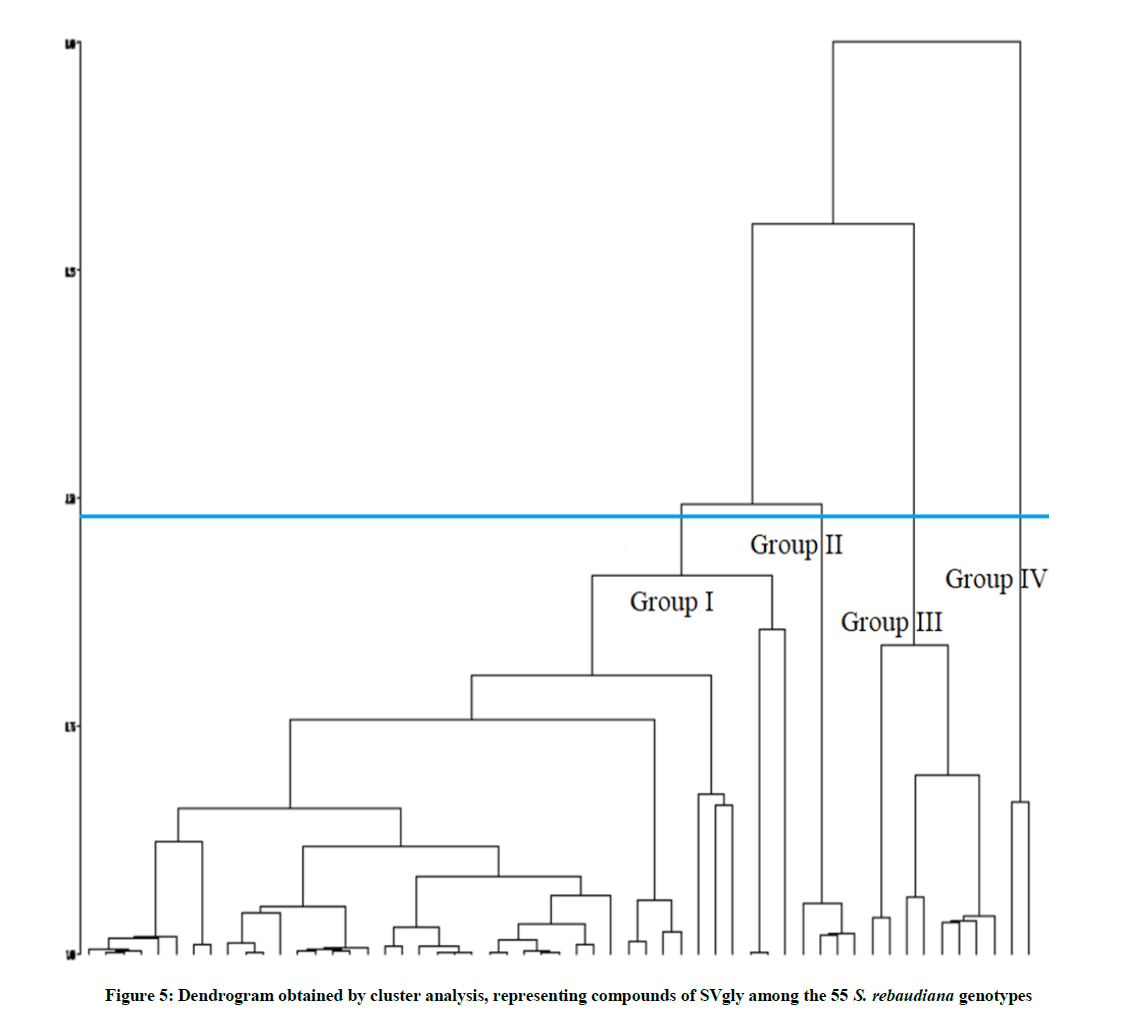
Figure 5: Dendrogram obtained by cluster analysis, representing compounds of SVgly among the 55 S. rebaudiana genotypes
Group I
This group is the largest in terms of number of samples including 41 genotypes belonging to all the studied regions. This group is characterized by STV (3.30-10.50%, M=7.20%). These levels are similar to those reported by [32] studying stevia cultivation in Argentina, and Reb A (1.80-7.60%, M=4.74%). These levels are similar to those reported by [33] working on stevia growing in Turkey. However, some genotypes showed higher Reb A content than STV, whereas others had a very high proportion of minor SVglys compounds. These levels are similar to those reported by [31] who studied the content of SVglys in French stevia genotypes. Reb A has a greater economic value than STV as an alternative sweetener [30]. Therefore, the endogenous Reb A to STV ratio in leaves is an important measure to select cultivars for commercial extraction. Although the ratio can differ hugely between cultivars, it also shows intra-cultivar variability, depending on photoperiod and ontogeny [34]. One sample from Marrakech (M5M) was the most dissimilar within the group for its considerable amount of Reb C (3.5%) and Dul A (2.3%), found at the insignificant amount in all the remaining samples belonging to this group. These values are generally higher than those reported by [25,27].
Group II
Composed of 4 samples originated from Agadir (A36A, M5A, K5A and K45A). STV (8.00%-10.70%, M=9.58%) followed by Reb A (4.50%-5.10%, M=4.83%) were the most important compounds. In this group, genotypes are richer in STV compared to Reb A. Furthermore, samples belonging to this group reached important amounts of Reb C (1.20%-1.90%, M=1.52%). These values are generally higher than those reported by [35].
Group III
Composed of 8 genotypes (K9A, M3A, M8A, A18M, K5M, K24R, K24S and K 34S) originated from Agadir, Marrakech, Rabat and Sefrou. These samples showed a dominance of STV (8.90%-14.4%, M=11.40%). These results are similar to those reported by [36] cultivated in India where Reb A (0.90%-3.20 %, M=1.96 %) was the main compound. These results are similar to those reported by [22], who emphasized that S. rebaudiana genotypes cultivated in Italy accumulated higher amounts of STV than Reb A.
Group IV
This group includes two samples, A28L and M5L, from Larache. STV (9.60%-12.90%, M=11.25%) was the most relevant component. This group is characterized by the absence of Reb A. These values are in accordance with those reported by [28], working on S. rebaudiana genotypes cultivated in France. These authors found important values of Dul A in S. rebaudiana genotypes (1.30%-1.60%, M=1.45%).
The best known SVglys are Stevioside, Rebaudioside A, Dulcoside A and Rebaudioside C. They account for more than 95% of the total SVglys found in S. rebaudiana leaves. Typical proportions found in plants from unimproved populations of S. rebaudiana are 65.9% STV, 27.5% Reb A, 4.3% Reb C and 2.1% Dul A [31]. Furthermore, SVgly total content and composition in S. rebaudiana leaves varies according to phenological stage and growth conditions [37]. Moreover, it is generally admitted that SVgly content gradually increases up to the budding phase and the onset of flowering [14], at concentrations ranging from 10% to 30% of their dry mass [38]. It is well-known that SVgly content in leaves may vary between 4% and 20% depending on environmental and agronomic factors [29]. In this study, SVgly total content varied widely over time and among different environments.
Conclusion
To conclude, this study showed high genotypic variability which is useful and valuable for any breeding program in the future towards the development of improved varieties showing specific characteristics, and thus breeding potentialities, for SVgly content and composition. Furthermore, the results of our evaluation showed that there is a substantial variability of S. rebaudiana genotypes in term of SVgly content. In fact, SVgly content varied with the environment. Therefore, SVgly total content and composition are determinant factors for S. rebaudiana productivity. SVgly productivity depends on the establishment of the best ideotype for a given location. Indeed, we observed that some plants accumulated more SVgly, underlying their interest for a perennial or semi-perennial cropping of S. rebaudiana when the climate and/or genotype adaptation allows it.
References
- D. Soejarto, Botany of Stevia and Stevia rebaudiana. In A. Kinghorn (Ed.), Stevia: The genus Stevia. London, New York: Taylor and Francis, 2002, 18-39.
- M. Amzad-Hossain, A. Siddique, S. Mizanur-Rahman, M. Amzad-Hossain, Asian. J. Tradit. Med., 2010, 5, 56-61.
- J. Brandle, P. Telmer, Phytochemistry., 2007, 68, 1855-1863.
- B. Crammer, R. Ikan, Chem Br., 1986, 22(10), 915-917.
- V.S.P. Chaturvedula, J. Rhea, D. Milanowski, U. Mocek, I. Prakash, Nat. Prod. Commun., 2011, 6, 175-178.
- V. Kochikyan, A. Markosyan, L. Abelyan, A. Balayan, V. Abelyan, Appl. Biochem. Microbiol., 2006, 42, 31-37.
- E.J. Kennelly, Sweet and non-sweet constituents of Stevia rebaudiana (Bertoni) Bertoni. Stevia, the Genus Stevia. Medicinal and Aromatic Plants-Industrial Profiles, Taylor and Francis, London., 2002, 19, 68-85.
- J. Pól, B. Hohnová, T. Hyötyläinen, J. Chromatogr. A., 2007, 1150, 85-92.
- V. Chatsudthipong, C. Muanprasat, Pharmacol. Ther, 2009, 121, 41-54.
- F.Z. Amchra, C. Al Faiz, S. Chaouqi, A. Khiraoui, A. Benhmimou, T. Guedira, J. Med. Plant., 2018, 6(1), 102-108.
- M. Kobus-Moryson, A. Gramza-Michałowska, Acta. Sci. Pol. Technol. Aliment., 2015, 14(1), 5-13.
- A. Khiraoui, A. Hasib, C. Al Faiz, F. Amchra, M. Bakha, A. Boulli, J. Nat. Sci. Res., 2017b, 7(14), 75-85.
- K.H. Kang, E.W. Lee, Korean J. Crop Sci., 1981, 26, 69-89.
- S. Ceunen, J.M.C. Geuns, Plant Sci., 2013, 198, 72-82.
- N.I. Bondarev, O.V. Reshetnyak, A.M. Nosov, Biotekhnologiya., 2007, 1, 22-28 (in Russian).
- M.M. Utumi, P.H. Monnerat, P.R.G. Pereira, P.C.R. Fontes, V.P.C. Godinho, Pesqui. Agropecu. Bras., 1999, 34, 1039-1043.
- S. Ceunen, S. Werbrouck, J.M.C. Geuns, J. Plant Physiol., 2012, 169, 749-752.
- V.G. Ladygin, N.I. Bondarev, G.A. Semenova, A.A. Smolov, O.V. Reshetnyak, A.M. Nosov, Biol. Plant., 2008, 52, 9-16.
- C.C. Teo, S.N. Tan, J.W.H. Yong, T. Ra, L. Peiling, L. Ge, Anal. Methods., 2011, 3, 2898-2908.
- M.L.L. Ferraresi, O. Ferraresi-Filho, A. Bracht, Rev. Unimar., 1985, 7, 133-146.
- J. Metivier, and A.M. Viana, J. exp. Bot., 1979, 30, 1211-1222.
- C. Gardana, M. Scaglianti, P. Simonetti, J. Chromatogr. A., 2010, 1217, 1463-1470.
- K. Jaworska, A.J. Krynitsky, J.I. Rader, J. AOAC. Int,. 2012, 95, 1588-1596.
- J. Atteh, O. Onagbesan, K. Tona, J. Buyse, E. Decuypere, J. Geuns, Archivos. De. Zootecnia., 2011, 60(229), 133-136.
- S.K. Goyal, Samsher et R.K. Goyal, Int. J. Food. Sci. Nutr., 2009, 61, 1-10.
- A. Khiraoui, M. Bakha, F. Amchra, S. Ourouadi, A. Boulli, C. Al-Faiz, A. Hasib, J. Mater. Environ. Sci., 2017, 8(3), 1015-1022.
- L. Serio, Phytothérapie, 2010, 8, 26-32.
- C. Barbet-Massin, S. Giuliano, L. Alletto, J. Daydé, M. Berger, Genet. Resour. Crop. Evol., 2016, 63(4), 685-694.
- J.M.C. Geuns, Phytochem., 2003, 64, 913-921.
- L. Andolfi, M. Macchia, L. Ceccarini, Ital. J. Agron., 2006, 1(2), 257-262.
- J. Brandle, Can. J. Plant. Sci., 1999, 79, 85-92
- N. Kolb, J.L. Herrera, D.J. Ferreyra, R.F. Uliana, J. Agric. Food. Chem., 2001, 49(10), 4538-4541.
- B. Yücesan, R. Büyükgöçmen, A. Mohammed, M. Sameeullah, C. Altuğ, S. Gürel, E. Gürel, In. Vitro. Cell. Dev. Biol. Plant., 2016, 52(3), 330-337.
- A.A. Mohamed, S. Ceunen, J.M. Geuns, W. Van den Ende, M. De Ley, J. Plant Physiol., 2011, 168(10), 1136-1141.
- H.S. Othman, M. Osman, Z. Zainuddin, J. Agric. Sci., 2018, 40(2), 267-283.
- R. Kaushik, N. Pradeep, V. Vamshi, M. Geetha, et A. Usha, J. Food. Sci. Technol., 2010, 47, 27-33.
- J.E. Brandle, A.N. Starratt, M. Gijzen, Can. J. Plant. Sci., 1998, 78, 527-536
- A.S. Richman, M. Gijzen, A.N. Starratt, Z.Y. Yang, J.E. Brandle, Plant. J., 1999, 19, 411-421.


