Research Article - Der Pharma Chemica ( 2022) Volume 14, Issue 7
RP-HPLC Method Development and Validation for Emtricitabine and Tenofovir Alafenamide fumarate in bulk drug and its degraded products using Design of Experiments
Arun M. Kashid*, Dhanshree S. Mhatre, Shraddha V. Tathe, Moreshwar P. Mahajan and Pranali P. PolshettiwarArun M. Kashid, Department of Pharmaceutical Chemistry, Sinhgad Technical Education Society, Sinhgad Institute of Pharmacy, Narhe, Pune 411041, India, Email: arunkashid2006@gmail.com
Received: 23-Jun-2022, Manuscript No. dpc-22-67541; Editor assigned: 25-Jun-2022, Pre QC No. dpc-22-67541; Reviewed: 09-Jul-2022, QC No. dpc-22-67541; Revised: 12-Jul-2022, Manuscript No. dpc-22-67541; Published: 19-Jul-2022, DOI: 10.4172/0975-413X.14.7.29-48
Abstract
RP-HPLC method development was successfully done using an innovative methodology based on the design of experiments (DoE), independent component analysis (ICA), and design space (DS). The Quantification of an HIV drug combination of Emtricitabine and Tenofovir alafenamide fumarate was done using DoE. Initially, independent variables that affect the dependent variables were analyzed and the Box Behnken design was used to study the interaction between the independent variables and dependent variables. The variables selected were % of the aqueous phase, flow rate, and wavelength. These variables were then optimized using the response surface methodology. The optimization was done using 2D contour plots and 3D response surface plots which provided a defined design space that had optimized chromatographic conditions that consist of mobile phase methanol: water (40:60 v/v) with pH adjusted to 3 with orthophosphoric acid and mobile phase flow rate of 0.9 ml/min at 252 nm. The developed method was validated according to ICH Q2 R1 guidelines for system suitability parameters, linearity, accuracy, precision, sensitivity, and robustness where all the parameters were within acceptable limits. Forced degradation studies were also carried out according to ICH Q1A (R2) guidelines under acidic, basic, oxidative, photolytic, and thermal degradation. The developed RP-HPLC method was found to be precise and robust.
Keywords
Emtricitabine; Tenofovir alafenamide fumarate; Design of Experiments (DoE); Forced degradation studies
INTRODUCTION
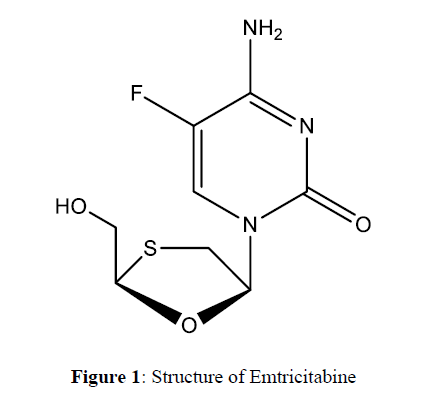
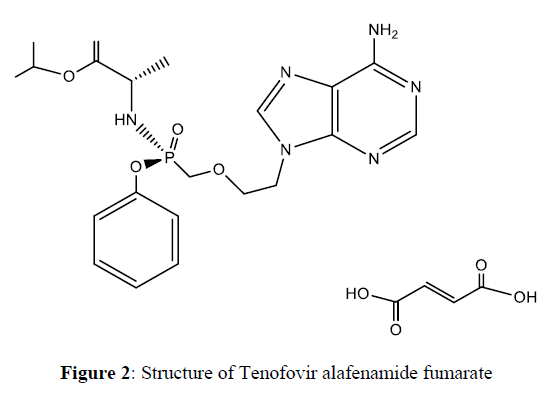
Emtricitabine (EMT) and Tenofovir alafenamide fumarate (TAF) are nucleoside reverse transcriptase inhibitors (NRTIs), used as antiviral, for the treatment of HIV patients. EMT (4-amino-5fluro-1-[(2R, 5S)-2-(hydroxymethyl)-1, 3-oxathiolan-5-yl] pyrimidin-2-oneisa cytidine analogue synthetic nucleoside (Figure 1), is phosphorylated to generate emtricitabine 5'-triphosphorylate by cellular enzymes [1]. Emtricitabine 5'- triphosphate suppresses the HIV-1 reverse transcriptase activity by competitiveness with 5'-triphosphate natural substratum deoxycytidine and incorporation into viral nascent DNA leading to chains. Mammalian DNA polymerases α, ß, γ, and mitochondrial DNA polymerase μ is a weak inhibitors of emtricitabine 5′ triphosphate [2]. TAF (E)-but-2-enedioic acid; propane-2-yl (2S)-2-[[[(2R)-1-(6-aminopurin-9-yl) propan-2-yl] oxymethyl-phenoxyphosphoryl] amino] propanoate is a tenofovir phosphoramidite prodrug. TAF exposure to plasma enables cell penetration, and TAF (Figure 2) is transformed to tenofovir by cathepsin. Hydrolysis intracellularly [3].The active metabolite tenofovir is then converted to tenofovir-diphosphate by cellular kinases. The HIV-1 replication is inhibited by the integration of HIV reverse transcriptase into viral DNA, resulting in a DNA chain end. Tenofovir is a potent anti-HIV-1 drug. The half-life of EMT is approximate 10 hours while 0.5 hours of TAF [4].
Design of Experiments (DoE) has been adopted for method development for robust experimental works. Box Behnken design has been used for the optimization of experiments and response surface methodology [5,6]. It was later validated with respect to ICH guidelines. Forced degradation studies were also performed for both the drugs. The Forced degradation of the drug substance and product will also provide the following information: determination of degradation pathways of drug substances and drug products; discernment of degradation products in formulations related to drug substances ver sus those that are related to non-drug substances (e.g., excipients); structure elucidation.
This is the first study ever to report the simultaneous estimation of EMT and TAF along with their degraded products using DoE to the best of our knowledge. For this extremely efficient synergistic combination, no other combination is available in the market till date. The developed method will be valuable for the analysis of this combination, which can be used by different research groups.
Experimental
Chemicals and Reagents
EMT and TAF were gift samples provided by Cipla Ltd. (Mumbai, India). High-performance liquid chromatography (HPLC) grade methanol and orthophosphoric acid, sodium hydroxide, hydrochloric acid of analytical (AR) grade were used.
Instrumentation
The method development was done using an HPLC binary gradient system (3000 series) of Analytical Technologies Ltd. The column used was Kromasil C18 (250mm x 4.6 ID, Particle size: 5μ). A double beam UV- Visible Spectrophotometer of Analytical Technologies Ltdwas used. A Wenser High Precision balance (PGB 100) and Wenser ultra (WUC- 4L) sonicator were also used.
Chromatographic conditions
The chromatographic conditions were achieved by using Kromasil C18 column. The mobile phase selected as methanol and water (40:60 v/v), the pH was maintained by using orthophosphoric acid as per the suggestions of experimental designs. The mobile phase was vacuum filtered through a 0.45μ membrane filter and ultrasonically degassed for 1 hour. All of the method development studies were carried out using HPLC in the isocratic mode. The injection volume was 20 μl, with a 0.9 mL/min flow rate. An ultraviolet detector (UV-3000 M) was used to monitor the elution at 252 nm.
Preparation of standard solutions
Standard solutions of EMT and TAF were prepared by using 10 mg of pure drug in 10 mL volumetric flask and solubilizing it in 10mL methanol to achieve 1000μg/mL for both the drugs. Further aliquots were prepared from this standard stock solution.
Selection of analytical wavelength
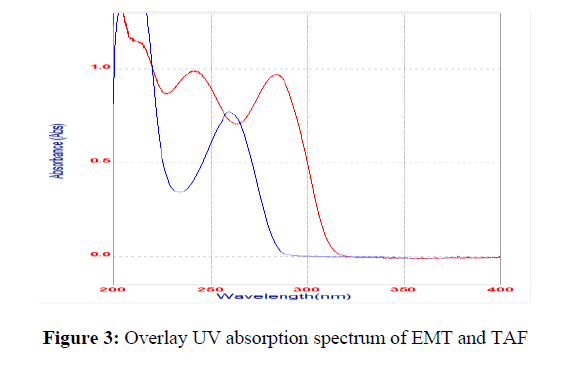
The analytical wavelength for the RP-HPLC technique was derived from the UV spectra of EMT and TAF and recorded using a UV-VIS spectrophotometer. The dilutions were prepared from stock solution to get 10 μg/mL of each drug with methanol. Solutions of both the drugs were scanned in the UV range between 200 and 400 nm against methanol as blank [7].
Method development using DoE
Selection of method variables and performing experimental design
Design expert®13.0.5.1 (Stat-Ease Inc., USA) was used for factor optimization. The HPLC method's core independent variables were % organic phase, mobile phase flow rate, and wavelength (Table 1), while the response variables were retention time, peak area, tailing factor, asymmetry for both drugs, and resolution between the two peaks were chosen. DOE approach was utilized to optimize these method variables, and an efficient and comprehensive Box-Behnken experimental design (BBD) was used for this purpose. This design is based on three factors at three levels, and it includes 12 experimental runs as well as five central point replications. Central replicates aid in the reproducibility and validity of an experiment's design.
| Variables | Levels | ||
|---|---|---|---|
| >Independent variables | Low | Intermediate | High |
| A. Amount of organic phase (%) | 40 | 50 | 60 |
| B. Mobile phase flow rate (mL/min) | 0.8 | 0.9 | 1 |
| C. Wavelength (nm) | 250 | 252 | 254 |
Analysis and optimization of experimental results
Design expert software was used to systematically review statistical analysis of the experimental results (version 13). Numerical and graphical optimization was carried out after specifying variable constraints. Each response parameter was examined using statistical tools such as 3D surface plots and 2D contour plots. A Design space was obtained.
Method validation
The method was validated in accordance with the ICH guidelines (8), for system suitability, linearity, limits of detection and quantification, accuracy, intra-day and inter-day precision, sensitivity, specificity, and robustness, to validate its suitability for its intended purpose.
● System suitability parameters
The system-suitability test was performed as part of the method development to confirm that the chromatographic system was performing properly. For six replicate injections of the drug at a concentration of 10 μg/mL, the retention time (Rt), number of theoretical plates (N), and asymmetry, resolution between two peaks was assessed.
● Linearity
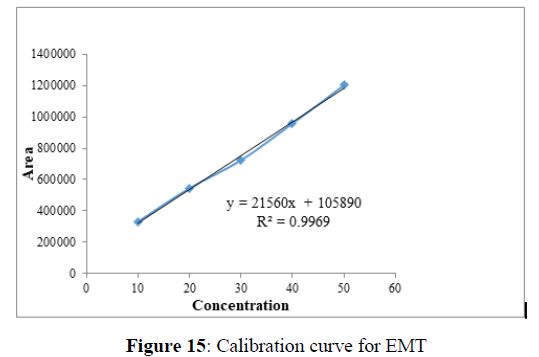
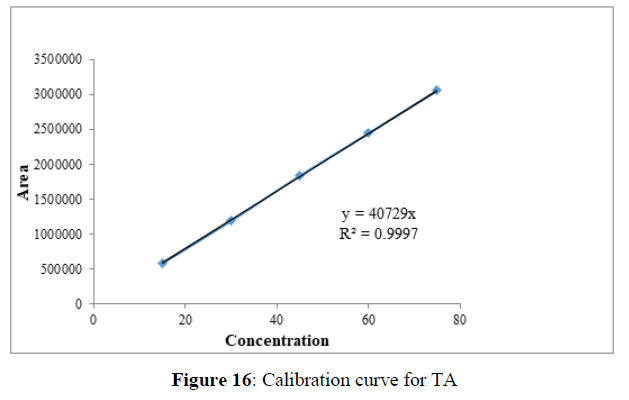
From the stock solutions of both the drugs, five concentrations for both drugs were prepared. For EMT concentration ranges was 10-50 μg/mL and for TAF 15-75 μg/mL were prepared. Calibration curve were plotted and regression coefficient for both drugs were calculated.
● Accuracy
From the standard solutions of both the drugs, three different concentration were prepared for analyses in triplicate (n= 3x3). % recovery and RSD were calculated.
● Precision
The developed method's precision was determined by calculating intra- and inter-day variation and reporting it as a percentage RSD. Three different drug concentrations were evaluated in duplicate and twice on the same day to assess the optimised method's intra-day precision. Samples were analyzed for two days in a row to assess inter-day precision.
● Specificity
Specificity studies were studies by calculating % assay results. 10μg/mL solutions of standard and sample were injected and compared.
● Sensitivity
Sensitivity was studied with the help of quantification limits. Limit of detection (DL) was established with the help of the following equation: DL = 3.3 σ/S, and limit of quantitation (QL) was determined using equation: QL=10 σ/S, where, σ is the standard deviation of the responses and S is slope of the calibration curve.
● Robustness
A few parameters were purposefully changed to test the robustness of the HPLC process. Changes in pH and wavelength were among the parameters. Three distinct pH values of 2.8, 3, and 3.2, as well as wavelength changes of 250 nm, 252 nm, and 254 nm were considered.
Forced degradation studies
According to the parameters of (9) guidelines, the forced degradation studies were carried out under acidic, basic, hydrolytic, photolytic, oxidative, and thermal conditions.
● Acid degradation
In a water bath, 10 ml of 1N HCl was added to 10 ml of stock solution and maintained at 60ºC for about 1 hour. After cooling, 100 ml of mobile phase was added. A 0.22 micron membrane filter was used to filter the solution.
● Base degradation
In a water bath, 10 ml of 0.1N NaOH was added to 10 ml of stock solution and maintained at 60ºC for about 1 hour. After cooling, 100 ml of mobile phase was added. A 0.22 micron membrane filter was used to filter the solution.
● Oxidative degradation
5 mL of 3% H2O2 was added to 10 mL of stock solution and maintained at room temperature for 24 hours; volume make up of 100 mL with mobile phase was done. A 0.22 micron membrane filter was used to filter the solution.
● Thermal degradation
A 10 ml stock solution was kept at 70ºC for about 24 hours, then cooled and made up the amount of 100 ml with the mobile phase. A 0.22 micron membrane filter was used to filter the solution.
● Photolytic degradation
A 10 ml stock solution was degraded photolytically for about 24 hours, then cooled made up the amount of 100 ml with mobile phase. A 0.22 micron membrane filter was used to filter the fluid.
RESULTS AND DISCUSSION
Method development and validation
The UV absorption spectrum was recorded, and the maximum absorption peak (ʎmax) was detected at 252 nm, as shown in Figure 3. As a result, for further analysis, the detected wavelength was selected. The method development trials were started with a C18 column and methanol: water mobile phase, taking into account the characteristics of the drugs under investigation. DoE study was adopted to improve its retention time, asymmetry, number of theoretical plates and resolution between two peaks.
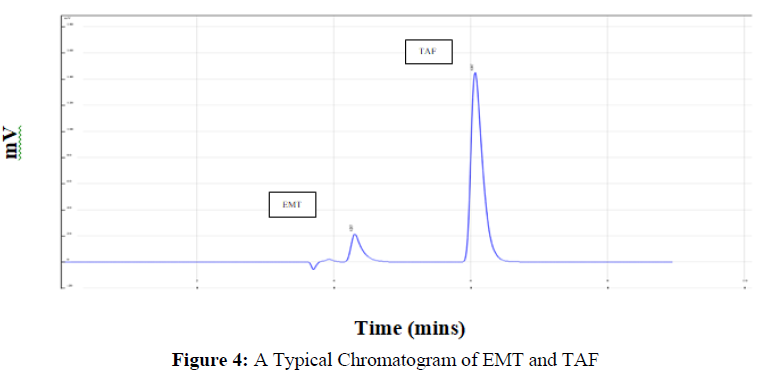
The figure 4 shows a representation of chromatogram for both the drugs which was generated over run time for 10 mins. These experimental tests were performed to determine experimental ranges for three CMAs, the percent organic phase in the mobile phase, flow rate, and wavelength. As a result, these variables were chosen as independent variables in the experiment (Figure 4).
To optimise critical method parameters, a Box Behnken experimental design with three independent variables at three levels was used. All 17 trials were carried out at random, and the chromatograms were analyzed for tailing factor, retention time, and number of theoretical plates for both drugs' peaks (Table 2). Various trials were conducted with different factor and their levels which were percentage of aqueous phase (40%, 50%,60%), mobile phase flowrate (0.8 ml/min, 0.9 ml/min, 1ml/min), wavelength (250nm,252nm,254nm).
| Factor | Factor 2 | Factor 3 | Respon-se 1 | Respon-se 2 | Respon-se 3 | Respon-se 4 | Respon-se 5 | Respon-se 6 | Respon-se 7 | Respon-se 8 | Respon-se 9 | |
|---|---|---|---|---|---|---|---|---|---|---|---|---|
| 1 | ||||||||||||
| Run | A: Composition of Methanol | B: Flowrate | C: Wavelength | RT | RT | Area EMT | Area TAF | TP | TP | Asym EMT | Asym TAF | Resolution |
| EMT | TAF | EMT | TAF | |||||||||
| % | ml/min | nm | min | min | AU | AU | Units | Units | Units | Units | Units | |
| 1 | 50 | 0.8 | 256 | 4.503 | 7.095 | 354475 | 712022 | 7747 | 8027 | 1.32 | 1.24 | 5.81 |
| 2 | 60 | 1 | 254 | 3.398 | 4.831 | 290260 | 520658 | 7066 | 8730 | 1.32 | 1.26 | 5.36 |
| 3 | 50 | 1 | 252 | 3.642 | 5.723 | 281252 | 566332 | 7853 | 8925 | 1.33 | 1.27 | 5.82 |
| 4 | 60 | 0.9 | 256 | 3.758 | 5.349 | 384871 | 646325 | 7403 | 8256 | 1.37 | 1.26 | 4.94 |
| 5 | 60 | 0.8 | 254 | 4.199 | 5.971 | 381110 | 684141 | 7843 | 8515 | 1.38 | 1.22 | 5.2 |
| 6 | 40 | 0.9 | 256 | 4.393 | 7.751 | 310236 | 639619 | 7902 | 8061 | 1.3 | 1.26 | 7.88 |
| 7 | 40 | 0.8 | 254 | 4.926 | 8.708 | 340761 | 718040 | 7976 | 8324 | 1.32 | 1.3 | 8.09 |
| 8 | 50 | 1 | 256 | 3.642 | 5.728 | 297783 | 565882 | 7670 | 8959 | 1.35 | 1.26 | 5.7 |
| 9 | 50 | 0.9 | 254 | 3.968 | 6.471 | 343149 | 678349 | 7421 | 8404 | 1.34 | 1.29 | 5.7 |
| 10 | 50 | 0.9 | 254 | 3.968 | 6.471 | 343149 | 678349 | 7421 | 8404 | 1.34 | 1.29 | 5.7 |
| 11 | 50 | 0.9 | 254 | 3.968 | 6.471 | 343149 | 678349 | 7421 | 8404 | 1.34 | 1.29 | 5.7 |
| 12 | 60 | 0.9 | 252 | 3.753 | 5.337 | 330779 | 599525 | 8137 | 8722 | 1.3 | 1.24 | 5.39 |
| 13 | 40 | 1 | 254 | 3.991 | 7.043 | 287245 | 576625 | 7815 | 8944 | 1.32 | 1.28 | 7.75 |
| 14 | 40 | 0.9 | 252 | 4.396 | 7.797 | 335527 | 661572 | 7704 | 8963 | 1.29 | 1.24 | 8.56 |
| 15 | 50 | 0.9 | 254 | 3.968 | 6.471 | 343149 | 678349 | 7421 | 8404 | 1.34 | 1.29 | 5.7 |
| 16 | 50 | 0.8 | 252 | 4.513 | 7.116 | 359272 | 709090 | 7717 | 8100 | 1.34 | 1.25 | 5.82 |
| 17 | 50 | 0.9 | 254 | 3.968 | 6.471 | 343149 | 678349 | 7421 | 8404 | 1.34 | 1.29 | 5.7 |
Statistical analysis of method response
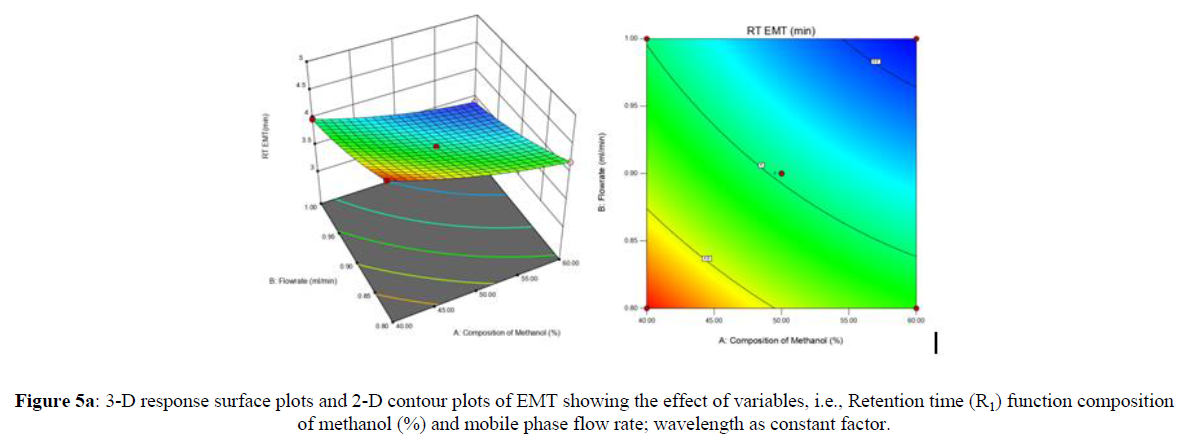
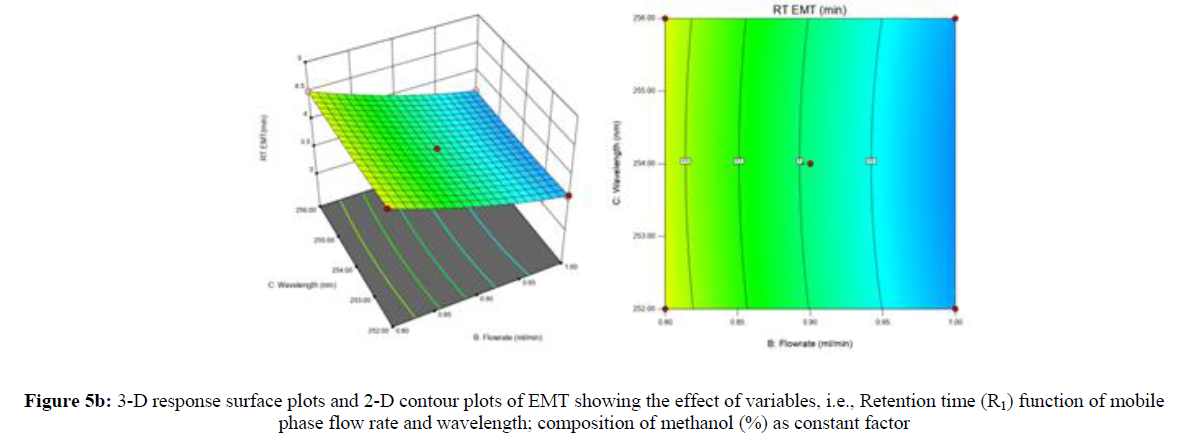
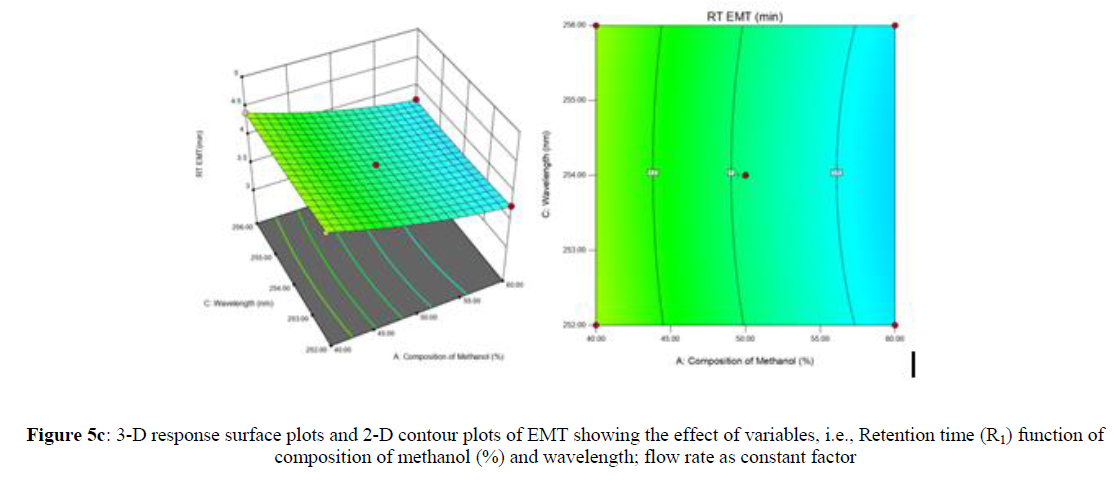
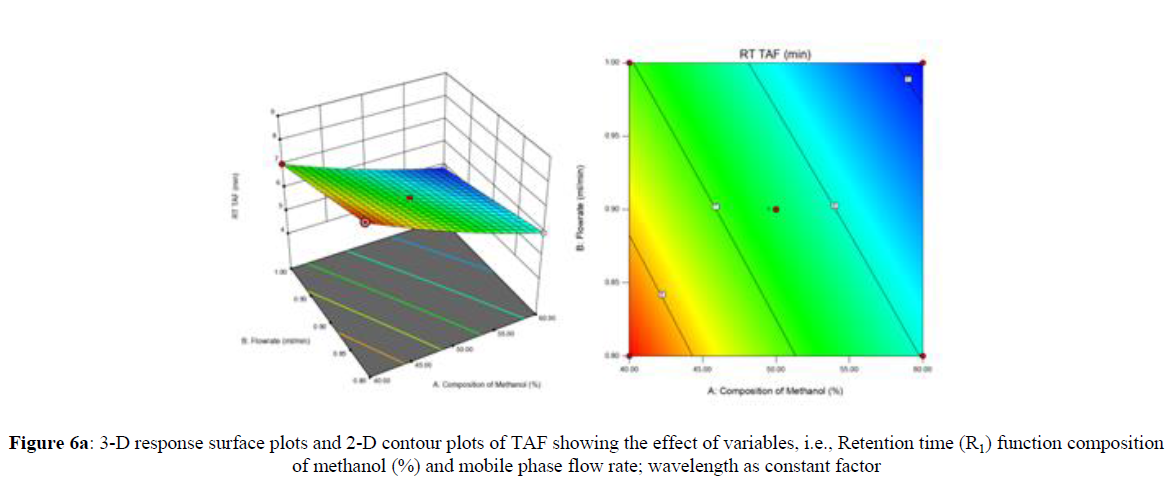
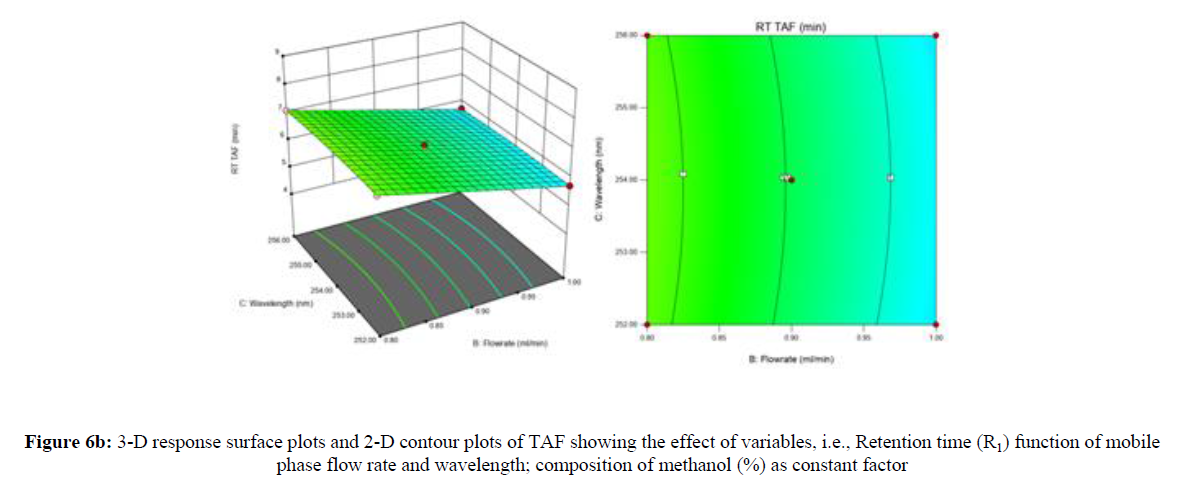
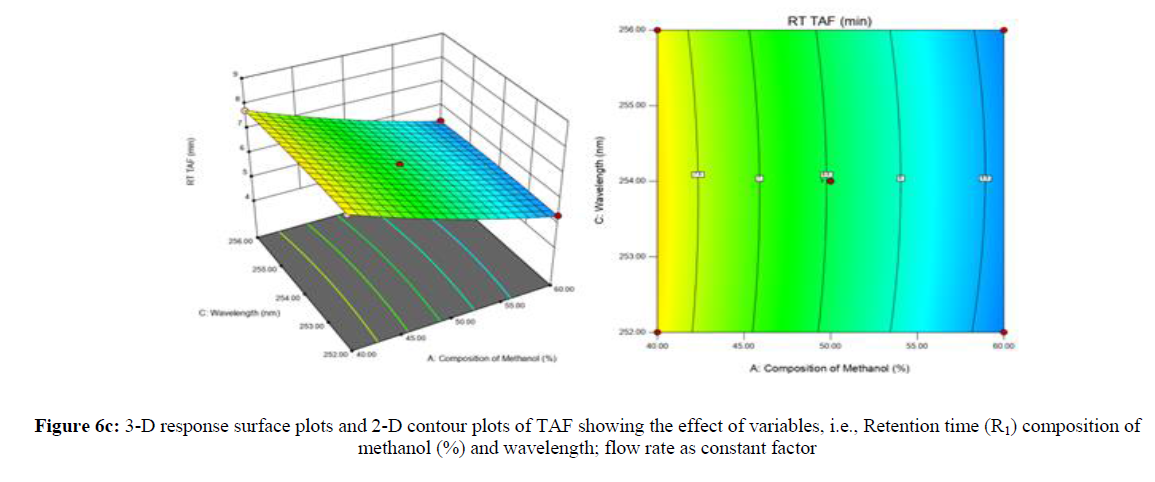
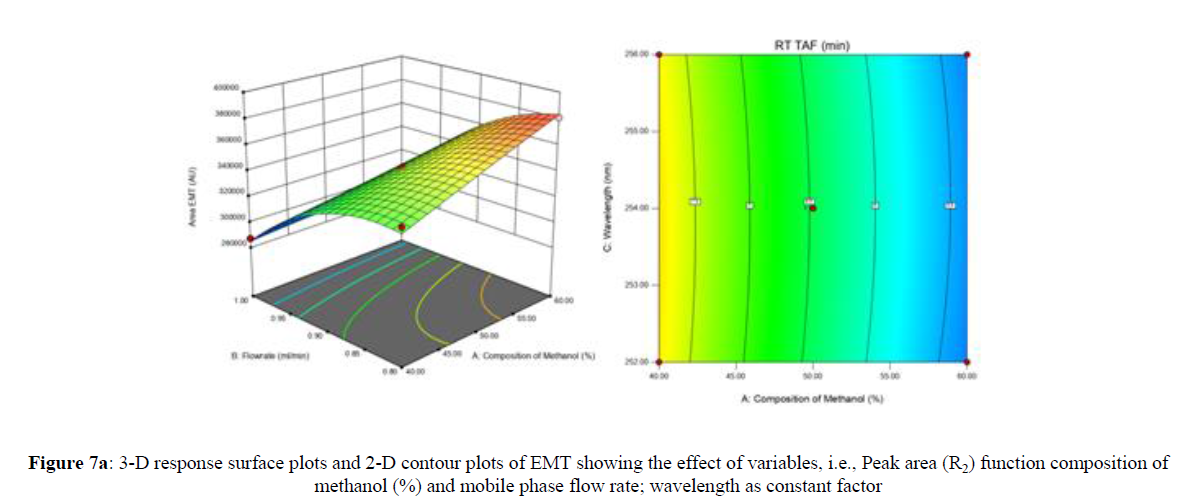
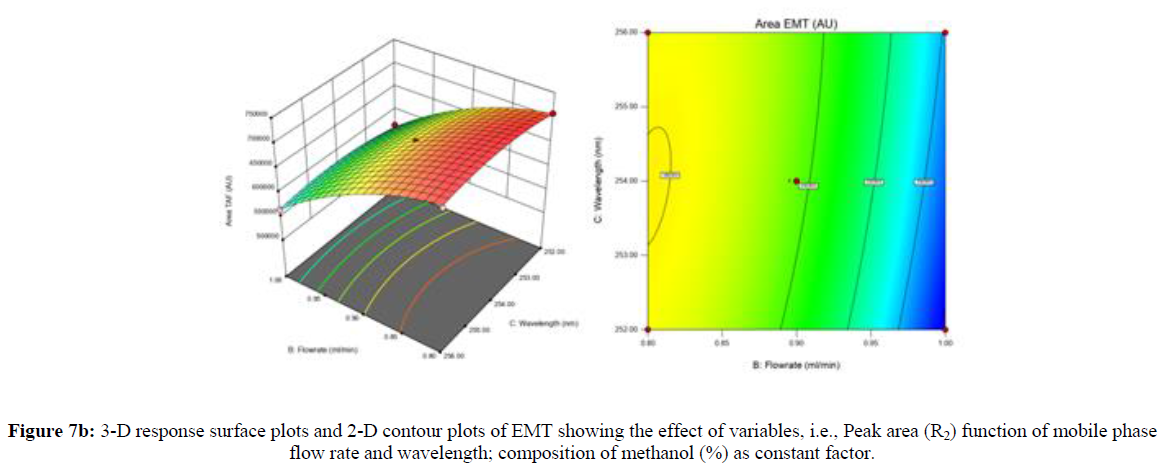
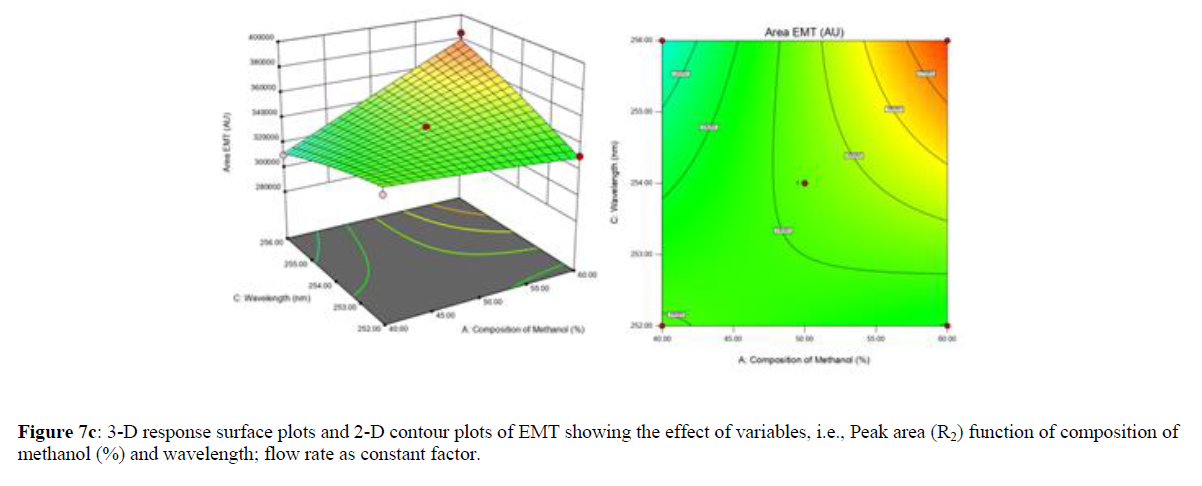
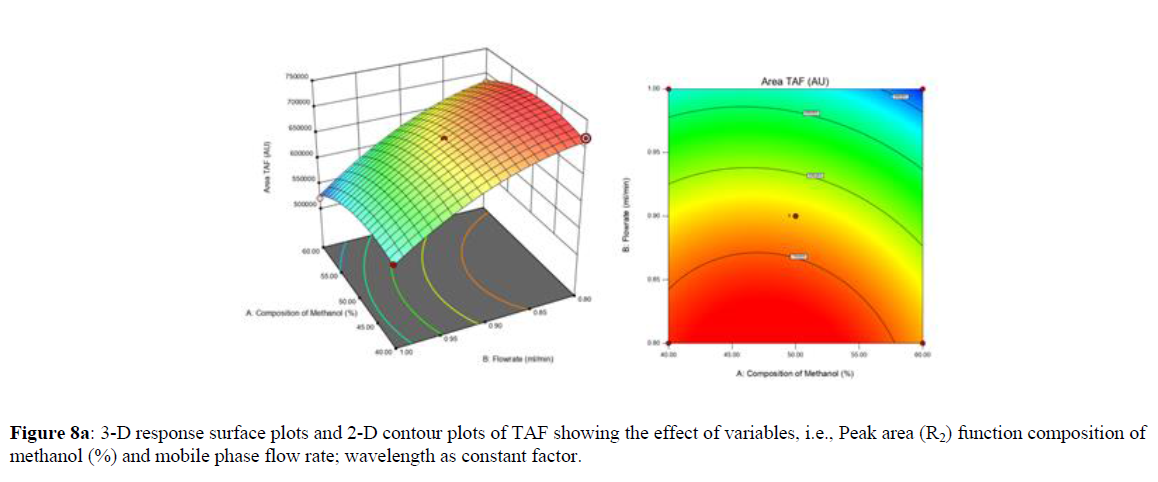
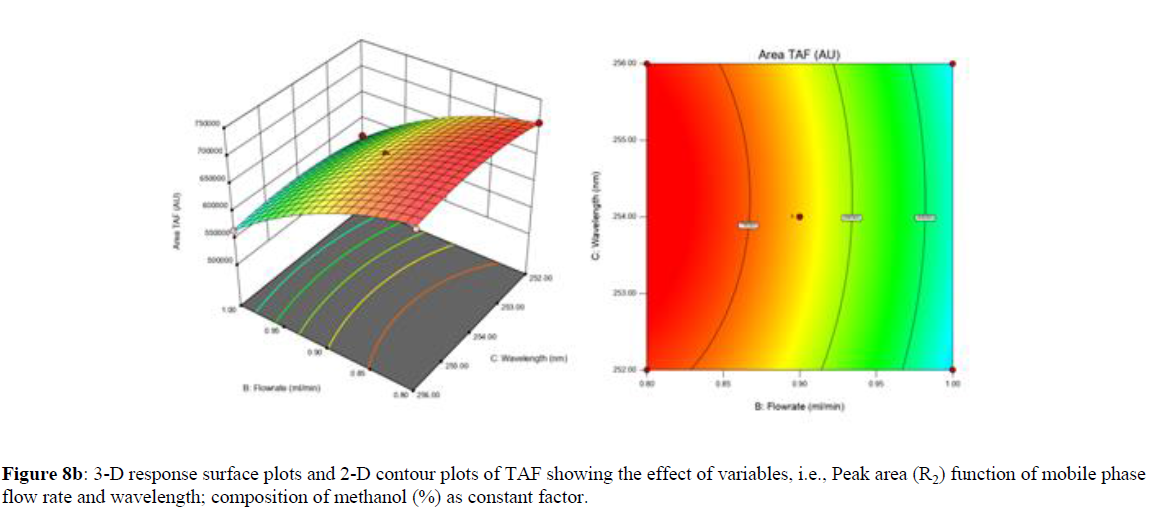
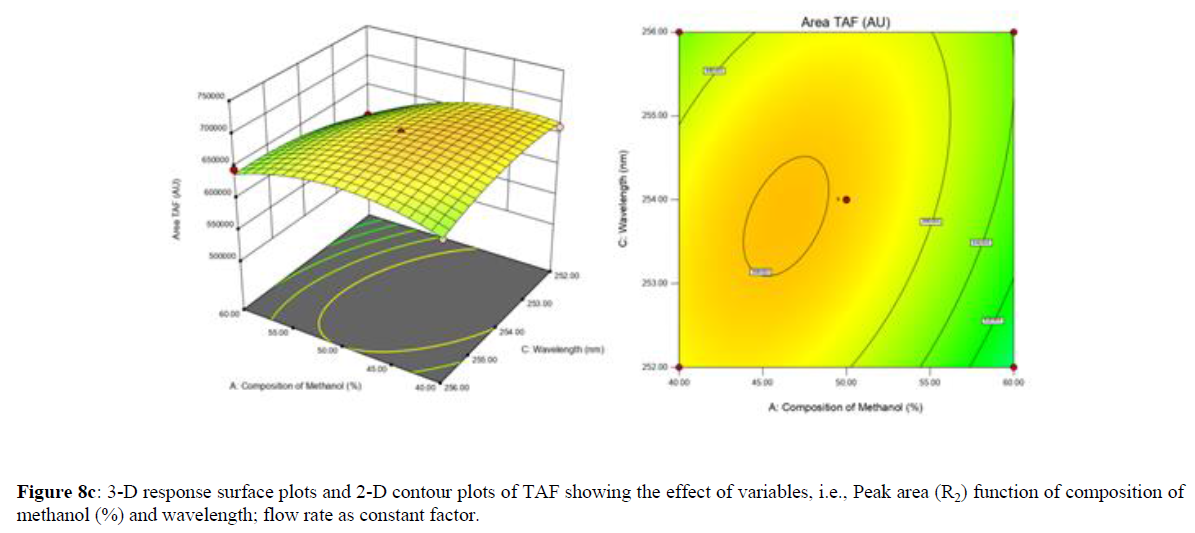
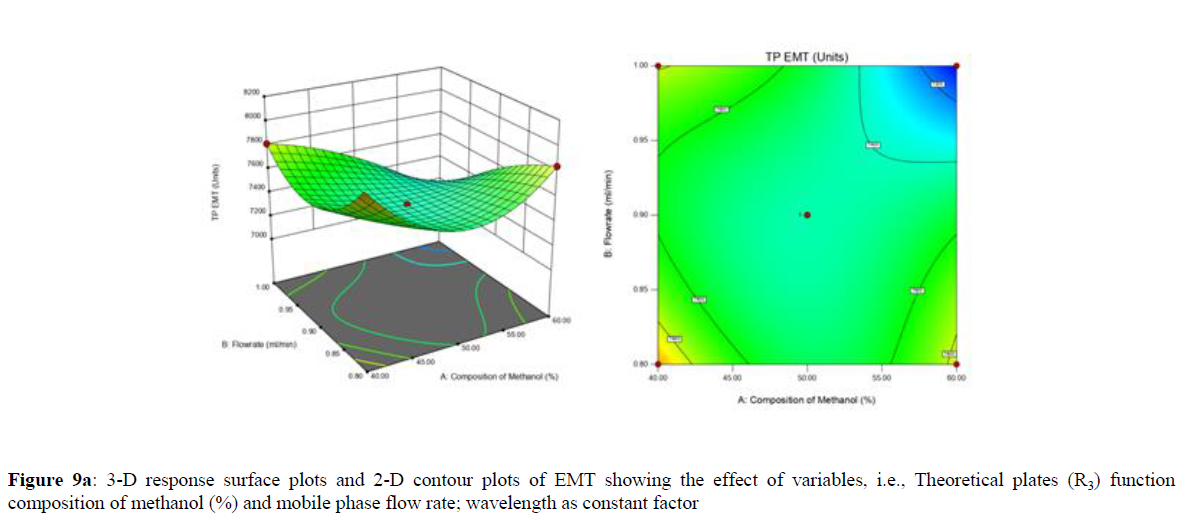
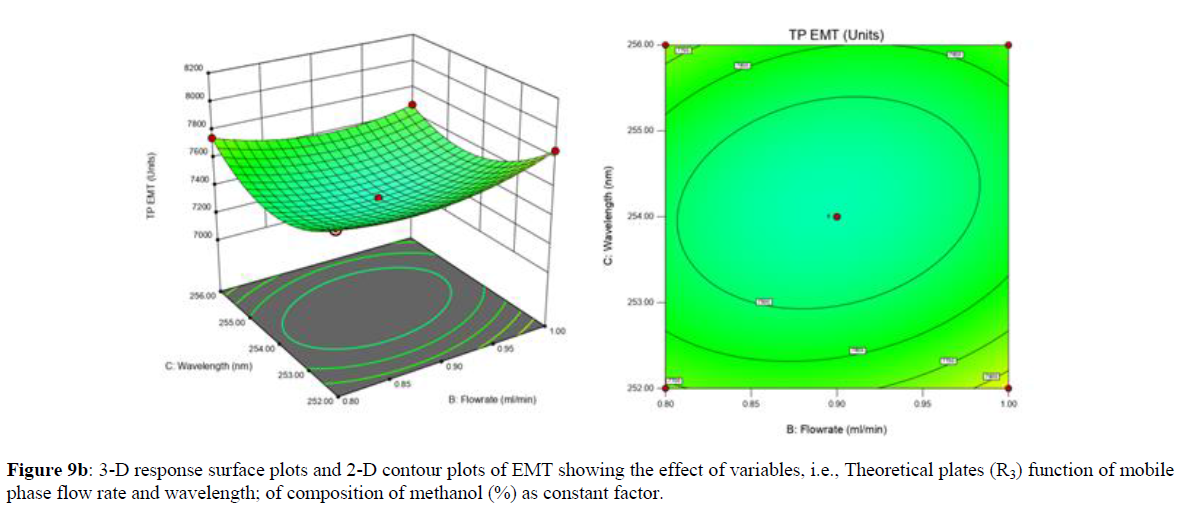
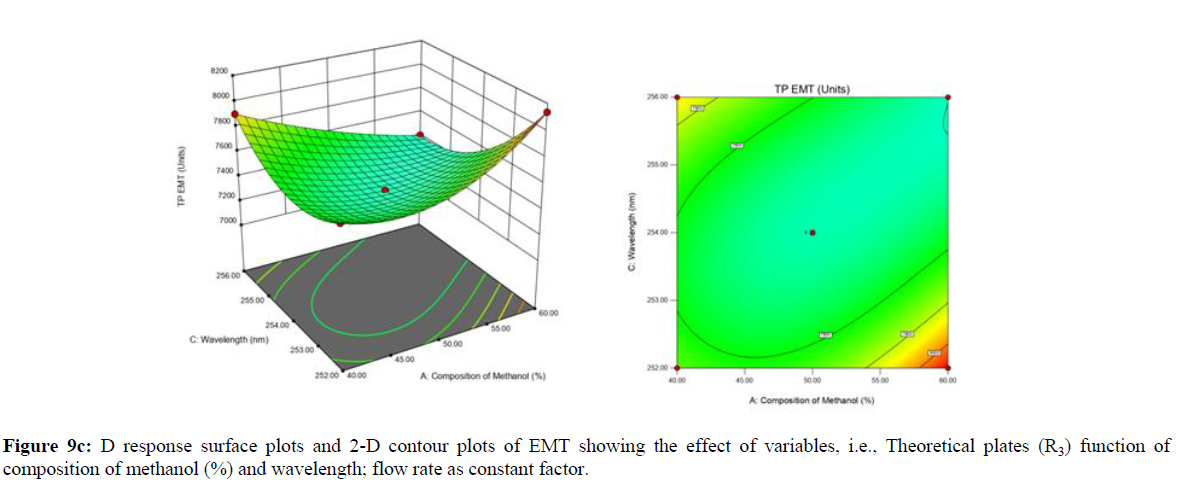
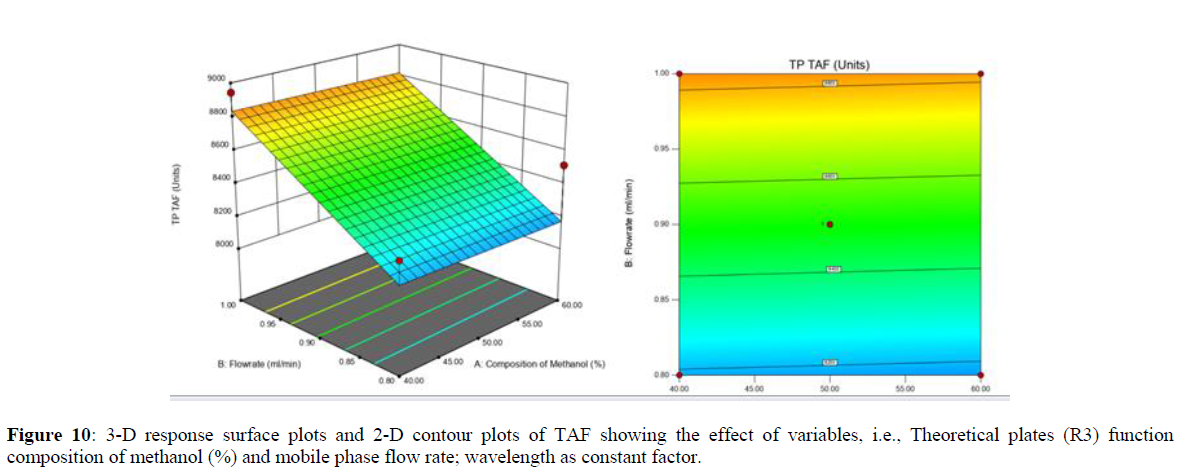
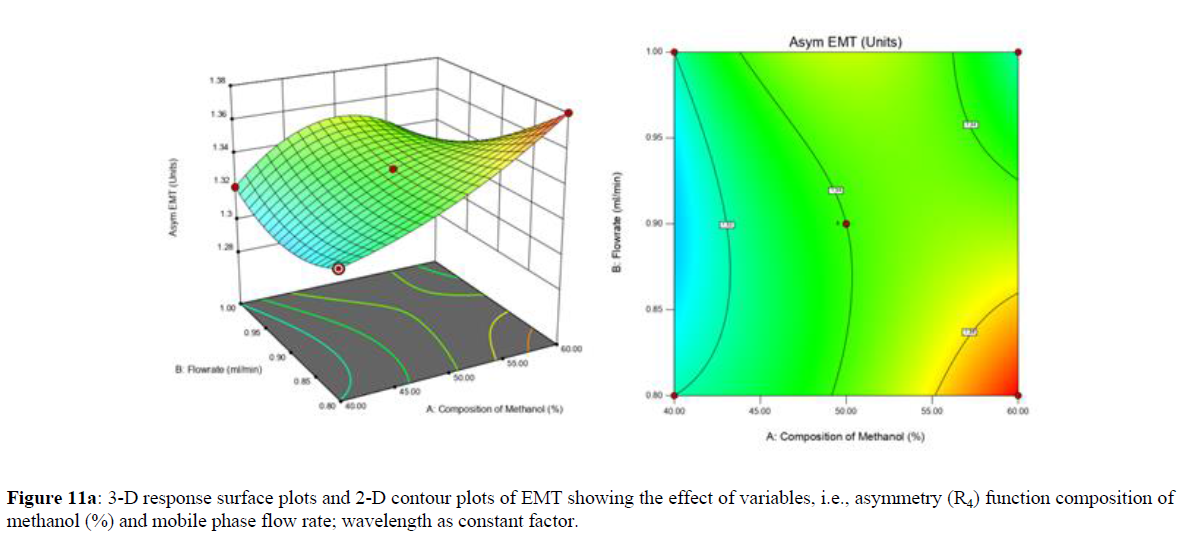
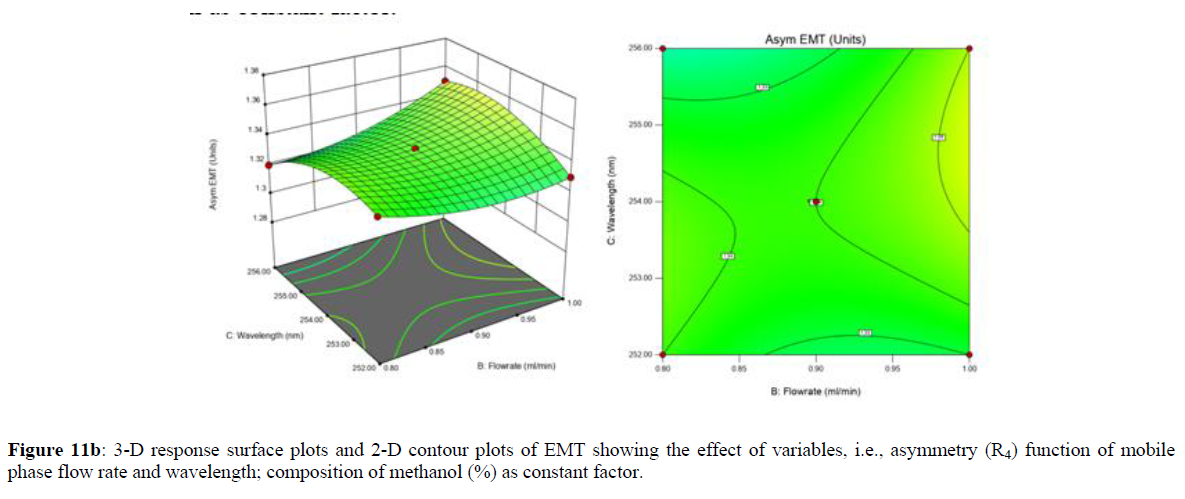
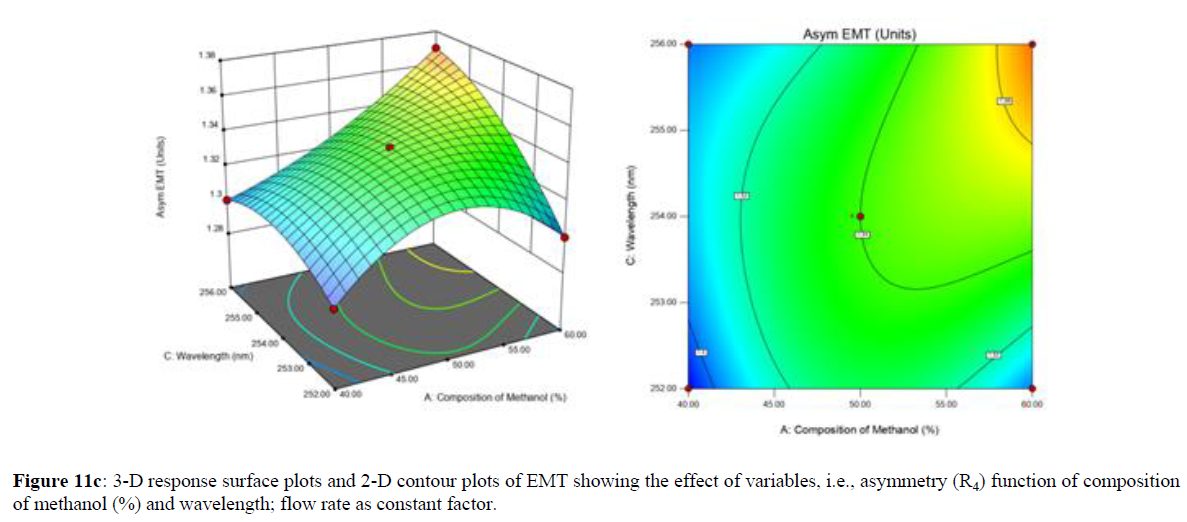
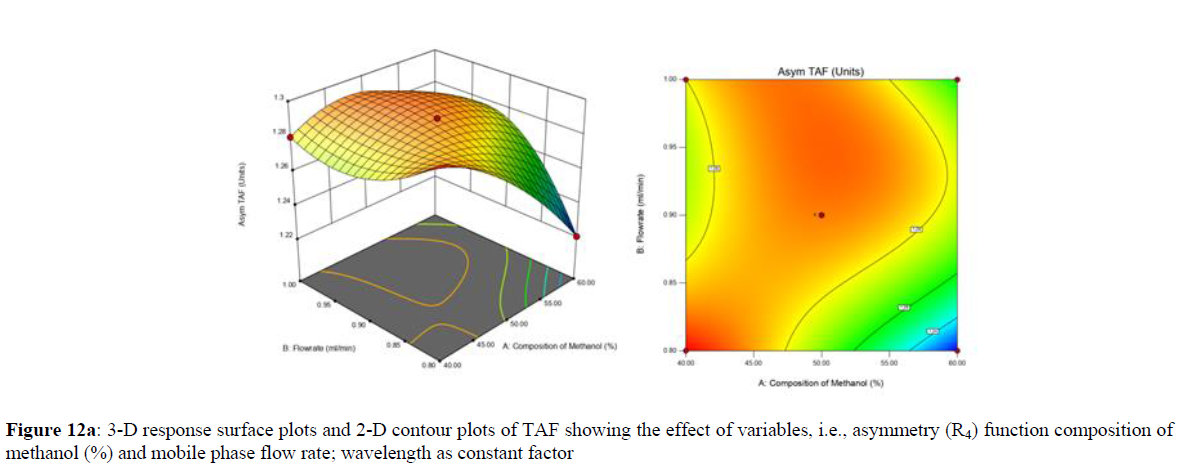
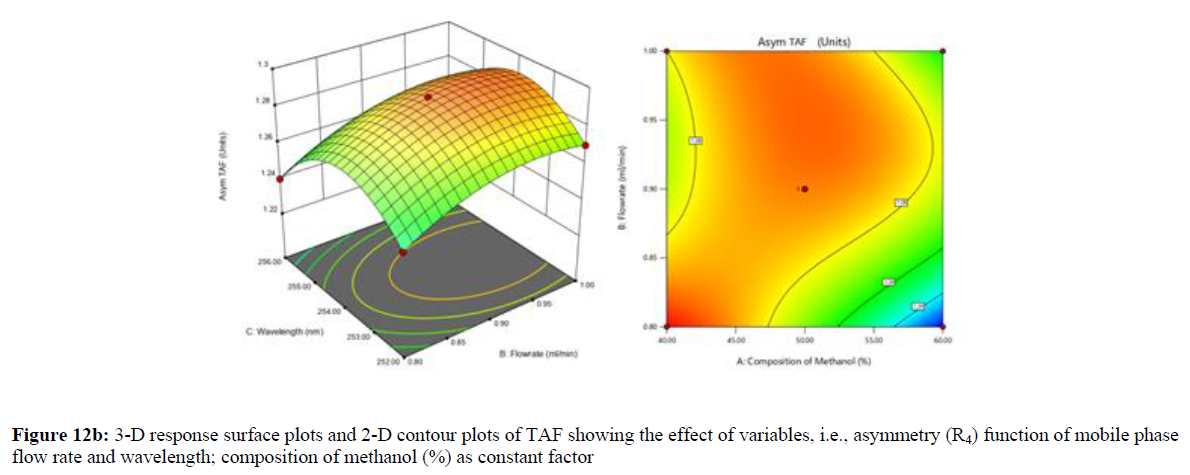
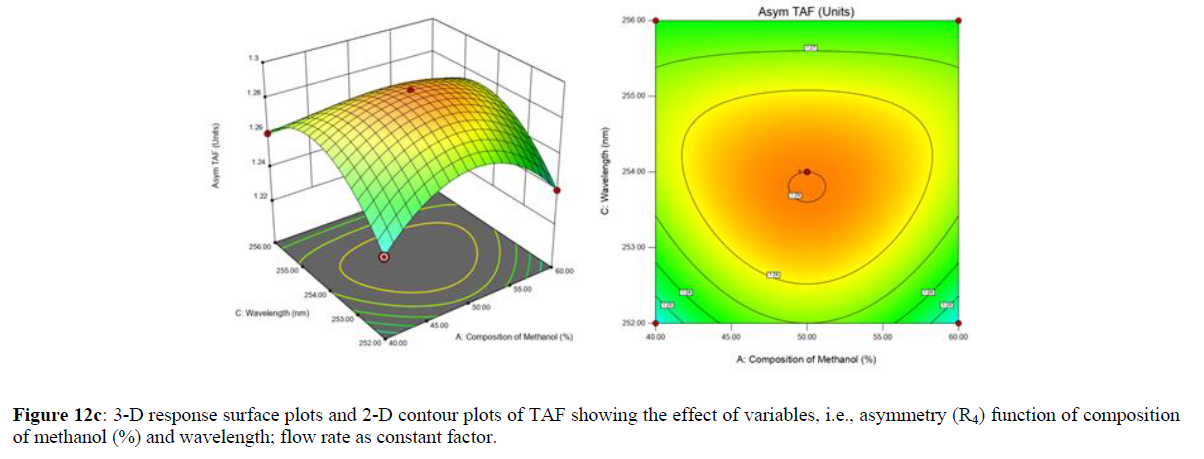
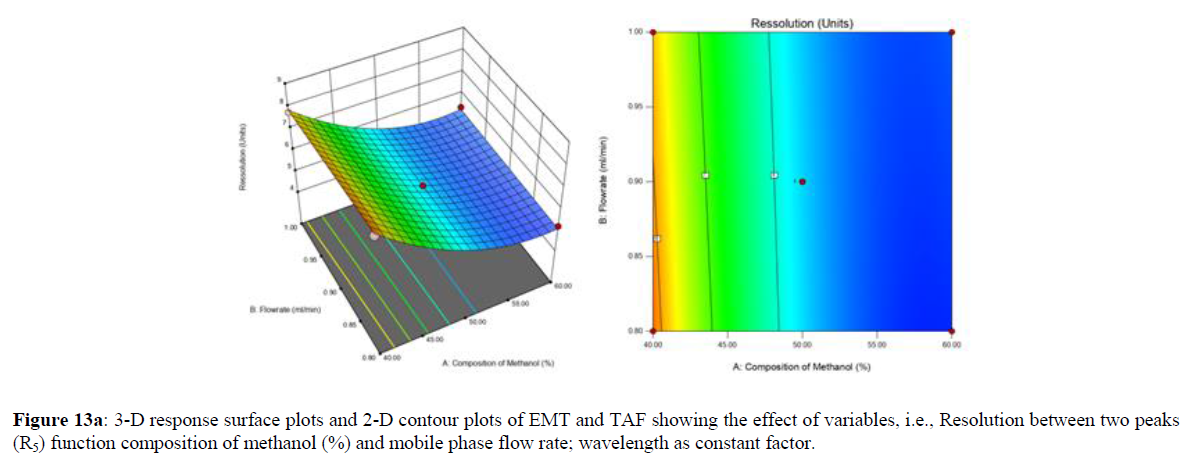
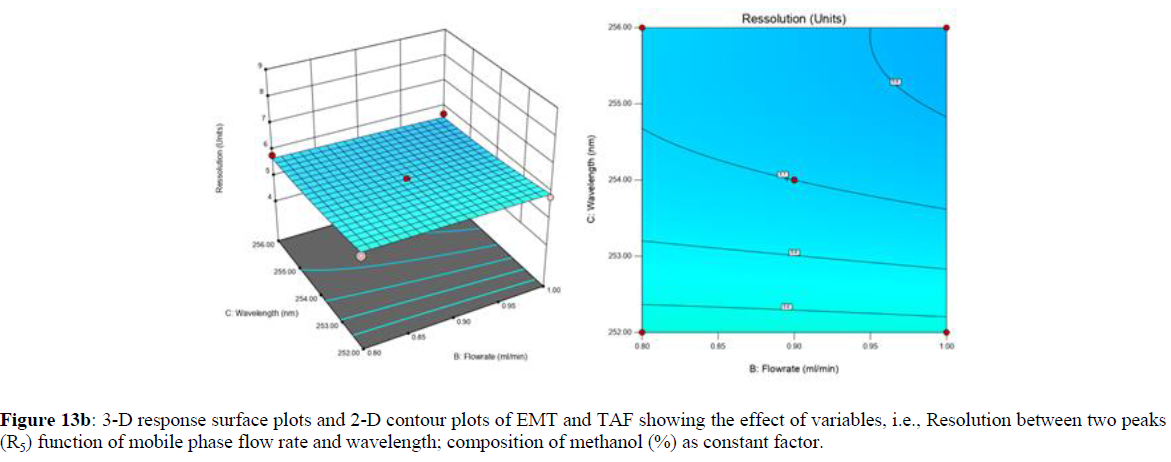
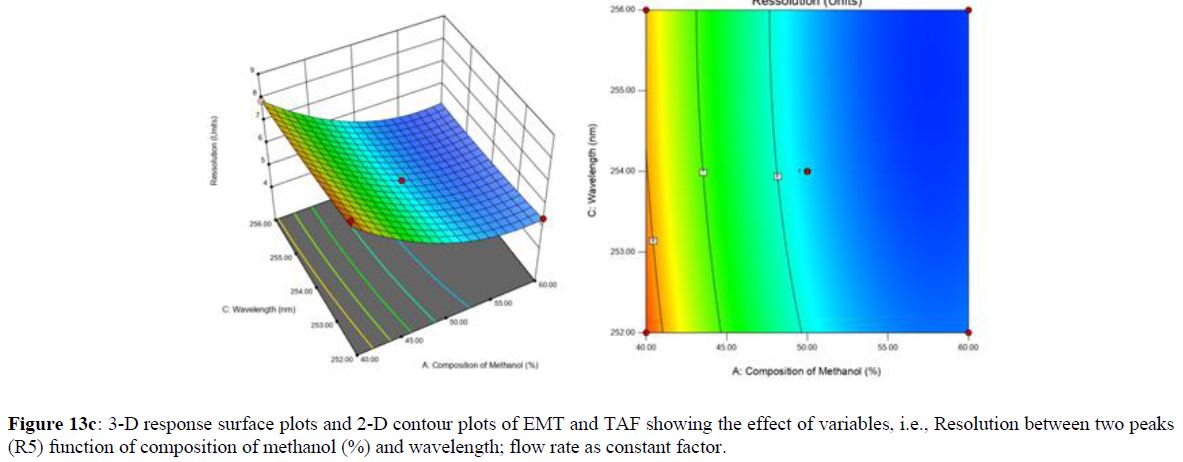
Using Design expert software, the acquired data were fitted to a suitable mathematical model. The created model was used to investigate the main and interaction effects among the variables. The actual vs expected plot, fit summary analysis, analysis of variance (ANOVA), lack of fit, coefficient of correlation (R2), adjusted and predicted R2, predicted residual sum of squares, and other data analysis techniques based on multiple linear regression analysis were used. Prediction expression, 2D contour plots, and 3D response surface plots (Figure 5-13) were used to determine model aptness.
Furthermore, by demarcation in the design space region, the ideal chromatographic solution was determined using a numerical desirability function. All the interactions between dependent and independent variables were studied through quadratic equations. The independent variables (Table I) were studied for critical analytical attribute (CAA’s) (R1: Retention time for EMT, R2: Retention time for TAF, R3: Peak area of EMT, R4: Peak Area of TAF, R5: Theoretical plates of EMT, R6: Theoretical plates of TAF, R7: Asymmetry of EMT, R8: Asymmetry of TAF, R9: Resolution between two peaks).
Design expert ANOVA studies were used to perform statistical analysis of the data received from factor screening and optimization. The quadratic equation was described using the following formula.
Quadratic model was suggested by the software and general equation for this model is as follows:
Y = β0 + β1X1 + β2X2 + β3X3 + β12X1X2+ β13X1X3 + β23X2X3 + β1X12 + β2X22+ β3X32
Where β0 represents the arithmetic averages of all the quantitative outcomes of all experimental runs; β1, β2 and β3 are the coefficients computed from the observed experimental values of Y; and X1(% of aqueous phase), X2 (Flow rate) and X3 (Wavelength) are the coded levels of factors. The equation represents the quantitative effect of factors X1, X2 and X3 upon each of the responses; Y1 (Retention time), Y2 (Peak area), Y3 (Theoretical plates), Y4 (Asymmetry), Y5 (resolution between two peaks). Summary of regression analysis of responses for fitting into model by 3level factorial as suggested by the software are collaborated (Table 3).
| Response | R2 | Adjusted R2 | Predicted | Adequate | SD | %CV | |
|---|---|---|---|---|---|---|---|
| R2 | precision | ||||||
| Retention | EMT | 0.9999 | 0.9997 | 0.9984 | 337.33 | 0.005 | 0.14 |
| Time (Y1) | TAF | 0.9999 | 0.9998 | 0.9987 | 376.6 | 0.013 | 0.2 |
| Peak | EMT | 0.9909 | 0.9794 | 0.8558 | 31.15 | 4407.68 | 1.32 |
| Area | |||||||
| (Y2) | TAF | 0.9956 | 0.99 | 0.9303 | 41.96 | 5898.19 | 0.91 |
| Theoretical | EMT | 0.9968 | 0.9967 | 0.9959 | 6.81E-306 | 198.98 | 2.72 |
| Plates | |||||||
| (Y3) | TAF | 0.9967 | 0.9959 | 0.9949 | 10.2 | 201.96 | 2.37 |
| Asymmetry | EMT | 0.9959 | 0.9794 | 0.9558 | 5.72 | 0.03 | 2.28 |
| (Y4) | TAF | 0.9969 | 0.9905 | 0.9307 | 5.08 | 0.48 | 2.56 |
| Resolution between two peaks | 0.9895 | 0.976 | 0.8326 | 24.31 | 0.17 | 2.82 | |
| (Y5) | |||||||
Analytical Design Space
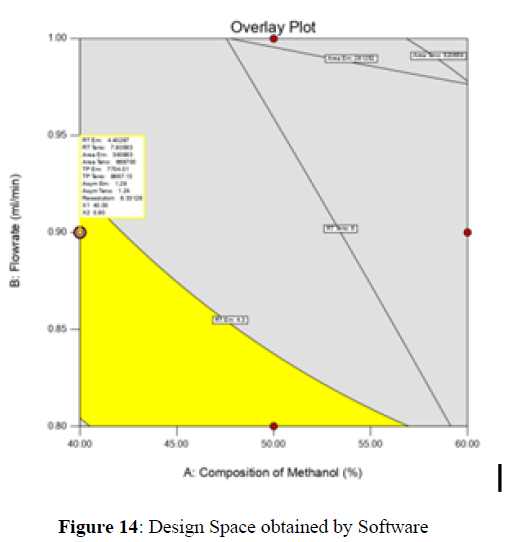
The maximum chromatographic separation was achieved with a 40:60 ratio (% v/v) of methanol and water (pH 3 adjusted by orthophosphoric acid) as the mobile phase, a flow rate of 0.9 mL/min, column temperature of 25±2 °C, and UV detection of 252 nm. Numerical optimization was used to find the best analytical conditions in the design space by putting limits on the variables. In the overlay plot (Figure 14), the projected optimum analytical method conditions were flagged. The overlay plot's values were quite near to the ones employed for optimal chromatographic separation [X1 (% v/v amount of aqueous phase): 40, X2 (flow rate): 0.9 ml/min], X3(wavelength): 252 nm. This clearly confirmed the predicted DoE model's definite accuracy in the estimation of variables. The ICH criteria were used to validate this improved approach.
Method Validation
System Suitability Parameters
The system suitability parameters like retention time, number of theoretical plates, asymmetry and resolution between two peaks were within the ICH guidelines. For both the drugs (Table 4) showed high level of accuracy for the developed method.
| Sr No. | Parameters | EMT | TAF |
|---|---|---|---|
| 1 | Retention time (Minutes) | 4.283 | 6.041 |
| 2 | Peak area | 567069 | 2079948 |
| 3 | No. of theoretical plates | 7977 | 8354 |
| 4 | Asymmetry | 1.29 | 1.24 |
| 5 | Resolution between two peaks | 5.83 | |
Linearity
Plotting the calibration curve between the concentration of the analyte (g/mL) and peak area (mAU) confirmed the linearity of the established analytical technique. The correlation coefficient (R2) was determined to be 0.996 and 0.999 for EMT (Figure 15) and TAF (Figure 16) respectively, indicating the closeness between the observed data and the predicted data
Accuracy
Developed analytical method for standard EMT and TAF solution was spiked at 50%, 100% and 150% concentration exhibited percent recovery between 99.65-100.51%. Thus, the new approach exhibited a very high degree of accuracy with % RSD between 0.77 and 0.06 for EMT and TAF respectively. Table 5 shows the results of the accuracy data (Table 5).
| Sr No. | Parameters | EMT | TAF |
|---|---|---|---|
| 1 | Retention time (Minutes) | 4.283 | 6.041 |
| 2 | Peak area | 567069 | 2079948 |
| 3 | No. of theoretical plates | 7977 | 8354 |
| 4 | Asymmetry | 1.29 | 1.24 |
| 5 | Resolution between two peaks | 5.83 | |
Precision
Table 6 and Table 7 shows the precision study results in terms of % RSD of the EMT and TAF. The % RSD of the peak areas of EMT and TAF were well within 2% in both intra-day and inter-day precision analyses. These findings revealed the established analytical method's high level of precision (Tables 6,7).
| Sr. No. | Concentration (µg/ml) |
Peak Area | |||
|---|---|---|---|---|---|
| Interday | Intraday | ||||
| 1 | 10 | DAY 1 | 724228 | Morning | 724228 |
| 2 | 10 | 752844 | 752844 | ||
| 3 | 10 | 753108 | 753108 | ||
| 4 | 10 | DAY 2 | 777733 | Evening | 752119 |
| 5 | 10 | 756870 | 755070 | ||
| 6 | 10 | 750981 | 754604 | ||
| Mean | 750981 | Mean | 748662.2 | ||
| %RSD | 1.64 | %RSD | 1.61 | ||
| Sr. No. | Concentration (µg/ml) |
Peak Area | |||
|---|---|---|---|---|---|
| Interday | Intraday | ||||
| 1 | 15 | DAY 1 | 1842342 | Morning | 1842342 |
| 2 | 15 | 1846115 | 1846115 | ||
| 3 | 15 | 1843984 | 1843984 | ||
| 1 | 15 | DAY 2 | 1842822 | Evening | 1840851 |
| 2 | 15 | 1843185 | 1838979 | ||
| 3 | 15 | 1845578 | 1843742 | ||
| Mean | 1845578 | Mean | 1849336 | ||
| %RSD | 0.08 | %RSD | 0.98 | ||
Specificity
For the specificity studies, % assay was determined. It was found that on comparing the sample peak with standard peak, % assay was found 102.54% for EMT and 99.72% for TAF which were as per ICH guidelines (Table 8).
| Sr. NO. | Drug | Area of Standard | Area of Sample | % Assay |
|---|---|---|---|---|
| 1 | EMT | 724228 | 742671 | 102.54 |
| 2 | TAF | 1842343 | 1837336 | 99.72 |
Sensitivity
For the developed analytical method, the LOD and LOQ values were found to be 3.53μg/mLand10.70μg/mL for EMT, 0.69μg/mL and 2.11μg/mL for TAF, respectively. These figures show that the developed analytical approach has a higher sensitivity for effective detection and quantification.
Robustness
Variables like theoretical plates, retention time, and peak area were unaffected by changes in chromatographic conditions such as pH and wavelength. The robustness of the proposed HPLC method was proved by the insensitivity of responses to deliberate small adjustments in the method conditions for both EMT and TAF.
Forced degradation studies
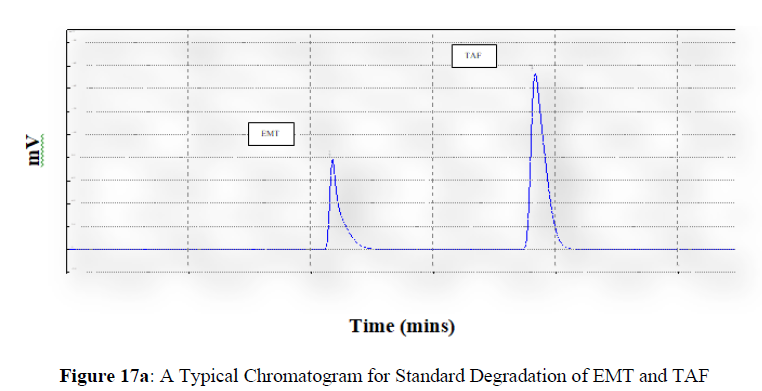
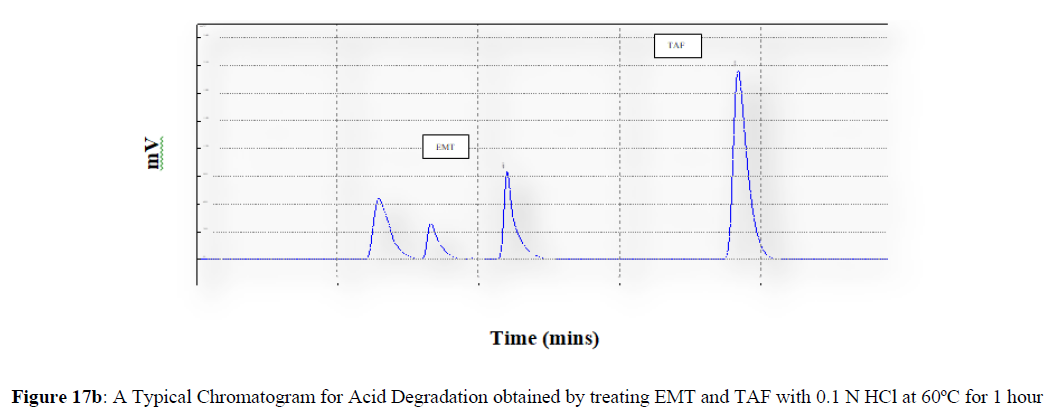
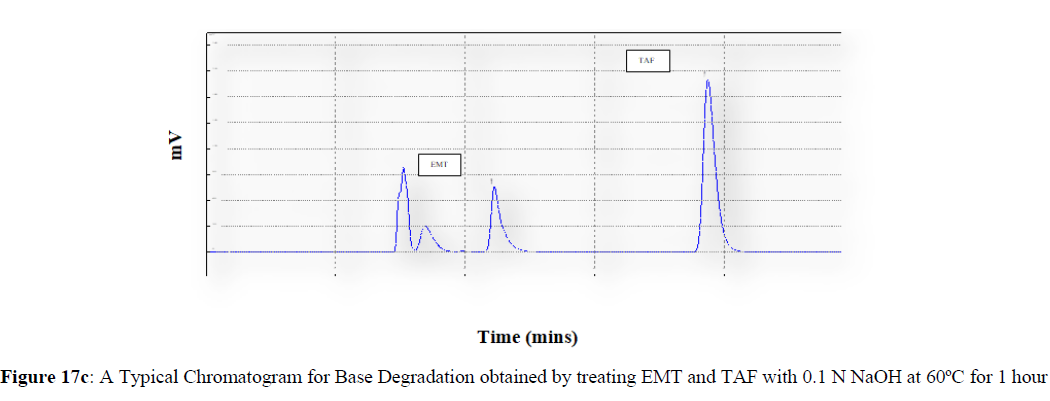
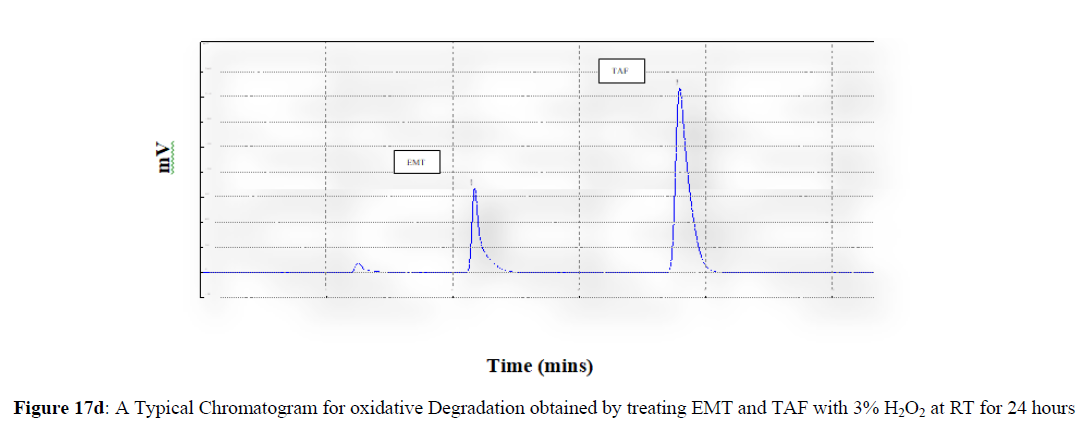
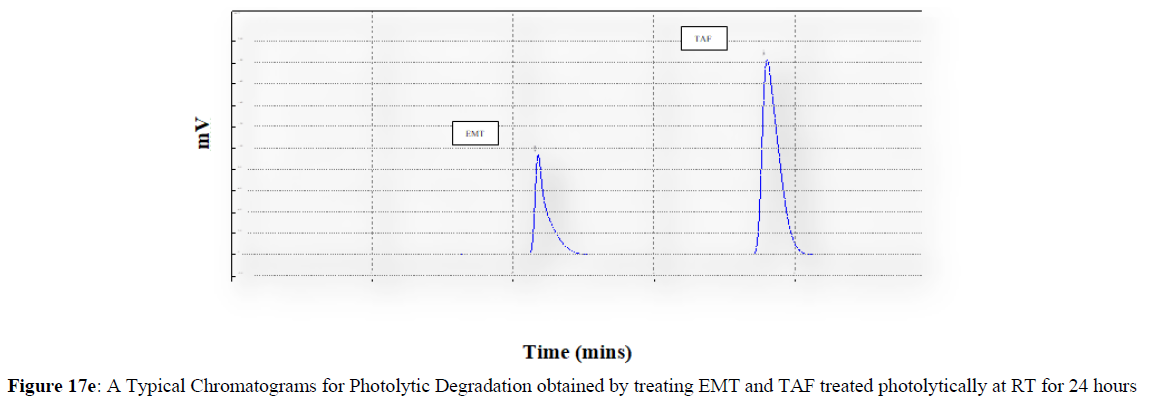
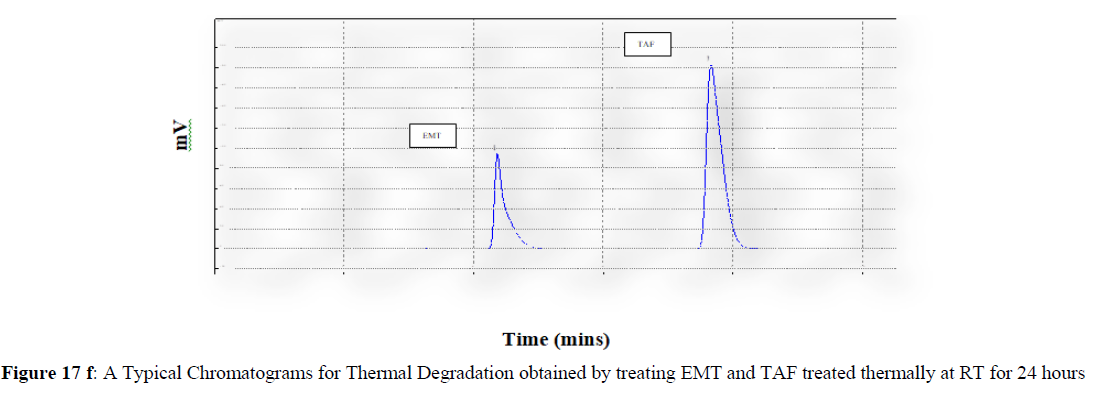
Forced degradation studies were carried out under a variety of stress situations, and the chromatograms obtained are shown in Figures 17a–17f. Table 9 shows the degradation products (DPs) and percent overall degradation in detail. The drug was found to be extremely vulnerable to acidic stress conditions, followed by basic stress conditions, and oxidative. Photolytic and thermal stress conditions being significantly less susceptible [8].
| Sr. No. | Degradation Conditions | % Degradation of EMT | % Degradation of TAF |
|---|---|---|---|
| 1 | Acid Degradation | 7.81 | 4.72 |
| 2 | Base Degradation | 10.13 | 5.84 |
| 3 | H2O2 Degradation | 8.83 | 9.47 |
In acidic stress conditions, substantial degradation was seen in 0.1 N HCl for 1 h, with EMT degradation of 7.81 % and TAF degradation of 4.72 %. In acidic stress conditions, two degradation products, DP 1 and DP 2, were detected at Rt 2.871 and 3.334 minutes, respectively. Treatment with 0.1N NaOH for 1 h, EMT by approximately 10.63% and reduced TAF by nearly 5.84% in basic stress conditions. As a result, the drug is extremely sensitive to both acidic and basic environments. At Rt 3.094 and 3.337 minutes, respectively, two degradation products, DP 3 and DP 4, were detected. Treatment with 3 percent H2O2 for 24 hours resulted in one degradation products, DP 5 were detected at 2.3 minutes. There were 8.83 % EMT and 9.47 % TAF drug degradation in oxidative stress environments. After 24 hours of photolytic stress, the drug showed 10.47 % EMT degradation and 8.88 % TAF degradation, suggesting that it is not photosensitive. Thermal stress conditions resulted in EMT degradation of 10.41% and TAF degradation of 8.41% after 24 hours. In photolytic and thermal degradation, no degradation products were detected [9,10].
The degradants generated in the solutions under various stress conditions were detected and well separated from the analyte, based on these findings. As a result, the established analytical approach indicates stability and is highly relevant for routine as well as stability sample analysis.
CONCLUSION
For EMT and TAF, a DoE-based, simple, quick, inexpensive, and stability-indicating HPLC technique was successfully established. For analysis over the obtained design space, the developed approach is precise and efficient. A Box-Behnken design was used to further optimise the elements that had a significant impact on variables. 2D-contour plots and 3D-response surface plots were used to examine the major impacts and interactions among different factors. A numerical optimization method was used to project the ideal analytical conditions. By flagging all parameters in the form of an overlay plot, these criteria were further located in the analytical design space region. Both drugs chromatographic peaks were effectively separated, with no interference from the sample matrix or degradation products. The method's linearity, accuracy, precision, specificity, and % assay is all satisfactory, according to the validation report. Furthermore, force degradation tests were performed under various stress situations.
Acknowledgements
Authors are thankful to Sinhgad Technical Education Society, Sinhgad Institute of Pharmacy, Narhe, Pune, India, for providing all the necessary facilities during this research work.
References
- Kalamkar CS and Bhawar SB. J of Drug Deliv Ther. 2019, 9: p. 243-247.
- Tanuja A, Ganapaty S, Murthy VS. Turk J Pharm Sci. 2020, p. 1-9.
- Manisha M, Bhavsari K, Rambabu D. Paideuma Journal. 2019, 9: p. 300-308.
- Rao Nagasarapu M and Dannana GS. Indian J Pharm Educ Res. 2016, 50(1): p. 145-149.
- Ferreira SC, Bruns RE, Ferreira HS, et al., Anal Chim Acta. 2007, 597(2): p. 179-186.
- Muthukumar M, Mohan D and Rajendran M. Cem Concr Compos. 2003, 25(7): p. 751-758.
- Arabzadeh V, Sohrabi MR Goudarzi N et al., Acta A Mol. Biomol Spectrosc. 2019, 215: p. 266-275.
- Venkataraman S and Manasa M. Drug Invent Today. 2018, 10: p. 137-146.
- International Conference on Harmonization (ICH) ICH. 2005.
- International Conference on Harmonization of technical requirements for registration of pharmaceuticals for human use, 2003.
Indexed at, Google Scholar, Crossref
Indexed at, Google Scholar, Crossref

