Research Article - Der Pharma Chemica ( 2018) Volume 10, Issue 3
Spectrophotometric and Thermodynamic Determination of Glibenclamide using 2,3-Dichloro-5, 6-dicyano-1,4-benzoquinone
Nwanisobi Gloria1* and Ukoha Pius2
1Department of Chemical Engineering, Faculty of Engineering and Technology, Madonna University (Akpugo Campus) Enugu State, Nigeria
2Department of Pure and Industrial Chemistry, Faculty of Physical Sciences, University of Nigeria, Nigeria
- *Corresponding Author:
- Nwanisobi Gloria
Department of Chemical Engineering
Faculty of Engineering and Technology
Madonna University (Akpugo Campus) Enugu State, Nigeria
Abstract
A spectrophotometric and thermodynamic method is described for the assay of glibenclamide. The method is based on charge transfer complexation reaction of glibenclamide as n-electron donor with 2,3-Dichloro-5,6-Dicyano-1,4-benzoquinone (DDQ) as π-acceptor to form highly coloured charge transfer complex with a stoichiometric ratio of 1:1. The coloured product was analyzed at 474 nm under the optimized experimental conditions. Beer’s law was obeyed over the concentration range of 20-100 μg/ml. The apparent molar absorptivity was calculated to be 0.99 × 10³ L.mol-1.cm-1. Corresponding Sandell’s sensitivity, detection and quantification limits were also reported. Also, the association constant, free Gibb’s energy, enthalpy and entropy changes of the complex were determined. The proposed method was applied successfully to the determination of glibenclamide in pure and commercial forms with good average recovery of 98.24%. Statistical comparison was done using student t-test and f-test at 95% confidence level.
Keywords
Glibenclamide, Spectrophotometry, Thermodynamics, Charge transfer, DDQ
Introduction
The term charge transfer denotes a certain type of complex which results from interaction of an electron acceptor and an electron donor with the formation of weak bonds [1]. Charge Transfer (CT) complexes have been widely studied [2-7]. 2,3-Dichloro-5,6-Dicyano-p-benzoquinone (DDQ) is an oxidizing [8], dehydrating agent in synthetic organic chemistry as well as it is known for its interaction with drugs having donor sites in their structures and form ion - pair charge transfer complexes which offers a basis for quantification of drugs [9]. DDQ as π-electron acceptor often form highly coloured CT complexes with various donors which provides the possibility of determination of drugs by spectrophotometric methods [10].
Glibenclamide chemically known as 5-chloro-n-[2-[4[(cyclohexylamino)carbonyl]-amino]sulphonyl] phenyl]-ethyl]-2-methoxy benzamide [11] is a second generation sulphonyl ureas antidiabetic drug used for the treatment of class II diabetes mellitus [12]. The literature survey shows that spectrophotometric methods have been employed for the determination of glibenclamide based on derivatization technique or coupling with another reagent [13,14], High pressure liquid chromatography methods are the most commonly used for the determination of glibenclamide. Fluorescence detection [15], Mass spectrometry [16], Thin layer chromatography [17], Voltametric method [18], Spectrofluorimetric method [19] have all been reported. Some of the reported methods are time consuming, involves, liquid-liquid extraction step, costly and lack sensitivity. Spectrophotometric technique continues to be the most preferred methods for routine analytical work due to their simplicity and reasonable sensitivity with significant economic advantages [20]. Therefore the aim of this work is to determine a method of analysis of glibenclamide that is fast, simple, sensitive and cost effective.
Materials and Methods
Instruments
All spectrophotometric measurements were carried out using a UV-1800 Schimadzu and 752W UV-Visible grating spectrophotometer with a silica glass cell of 1 cm thickness.
Chemicals and reagents
All chemicals used were of analytical grade and were used as such. Pure glibenclamide and tablet (5 mg) were supplied by Juhel Pharmaceuticals Nig. Ltd., Nigeria. 2,3-dichloro-5,6-dicyano-1,4-benzoquinone(98% purity) was supplied by Sigma- Aldrich Chemie, Germany.
Determination of optimum conditions for glibenclamide-DDQ complexation
3 ml solution of DDQ (0.001 g/ml) was made in methanol and the wavelength of maximum absorption was determined. 3 ml of glibenclamide (0.001 g/ml) was made in methanol and the wavelength of absorption was determined. A colour was developed by mixing 2 ml of DDQ (0.001 g/ml) solution in methanol with 2 ml of glibenclamide (0.001 g/ml) solution in methanol and the wavelength of maximum absorption for the resultant solution was determined. Another mixture with a 1:1 ratio of DDQ and glibenclamide were prepared and absorbencies were measured at different time and temperatures against a blank. Between pH 1-13, the effect of pH on the formation of glibenclamide-DDQ complex was investigated. In addition, different concentrations of the complex were prepared and their absorbance measured at the detected optimum conditions against the blank prepared above.
Proposed general procedure
Transfer serial volumes of 0.036 ml to 0.4 ml in 0.04 step of the standard glibenclamide (0.001 g/ml) solution equivalent to ranges of concentration 9.0 μg/ml-100 μg/ml into different test tubes. Add 0.2 ml each of buffer 2 into the set up with 2 ml of methanol. Add equal volumes of DDQ (0.001 g/ml) solution in methanol according to the stoichiometry of the drug and reagent. Mix the content and allow standing for 35 min at 40°C before analysis at 474 nm against a methanol blank.
Determination of association constant, molar absorptivity, free Gibbs energy and Benesi-Hildebrand plot of glibenclamide-DDQ complex
A constant volume of 0.4 ml of glibenclamide (1.0 × 10⁻³ M) was transferred into five test-tubes and made up to 4 ml according to the calculation. Varied volumes of (0.4, 0.6, 0.8, 1.0 and 1.2 ml) of 1.0 × 10⁻² M of DDQ solution were added into the set-up containing the drug each to represent at least 10 fold in excess of the acceptor. The content was thoroughly mixed and left to stand for 35 min before their absorbance were determined at 474 nm against a methanol blank at room temperature. Further analysis of the reaction mixtures were done by subjecting them to temperatures of 40°C, 50°C and 60°C using a thermo stated water bath.
Assay determination of glibenclamide-DDQ complex
Two glibenclamide tablets were grinded on a mortar. An amount equivalent to 0.01 g was dissolved with some methanol, stirred to extract the active ingredient. It was filtered with Whatman no. 1 filter paper and later made up to 10 ml to give 0.001 g/ml theoretical concentration. Serial volumes similar to the one prepared for the above procedure were transferred to different test tubes and treated similarly before analysis at 474 nm against a methanol blank.
Results and Discussion
Absorption spectra
A 2,3-dichloro-5-6-dicyano-1,4-benzoquinone solution in methanol displayed absorption peak at 350 nm (Figure 1).
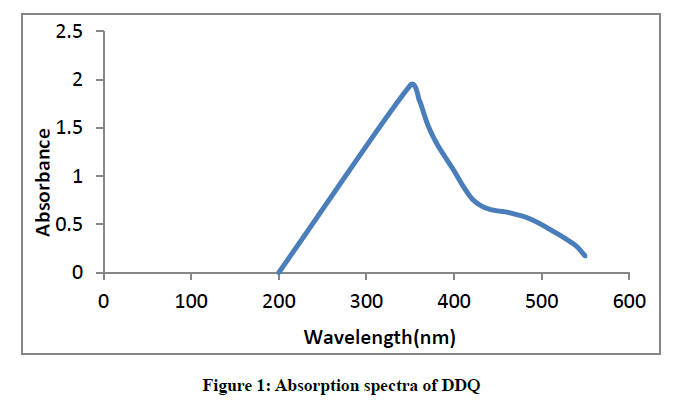
Figure 1: Absorption spectra of DDQ
Glibenclamide showed absorption peaks at 229 nm and 299 nm (Figure 2).
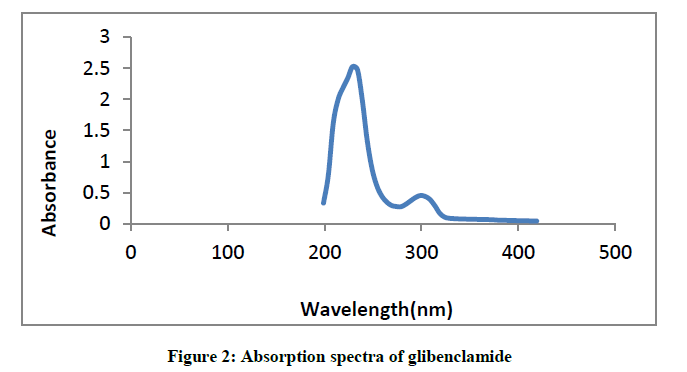
Figure 2: Absorption spectra of glibenclamide
Similarly, mixing the solutions of glibenclamide in methanol to a solution of DDQ in methanol forms reddish brown colouration and causes a bathochromic shift in the absorption maxima to 474 nm (Figure 3).
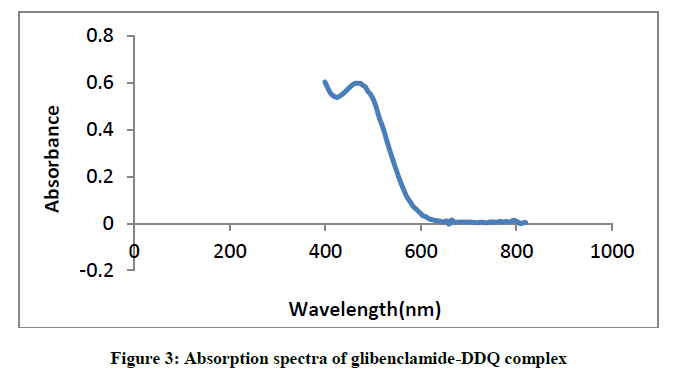
Figure 3: Absorption spectra of glibenclamide-DDQ complex
Stoichiometry of glibenclamide-DDQ complex
The mole ratio method [21] was employed to establish the composition of the complex. Result indicates the formation of a 1:1 complex between glibenclamide and DDQ at 474 nm (Figure 4).
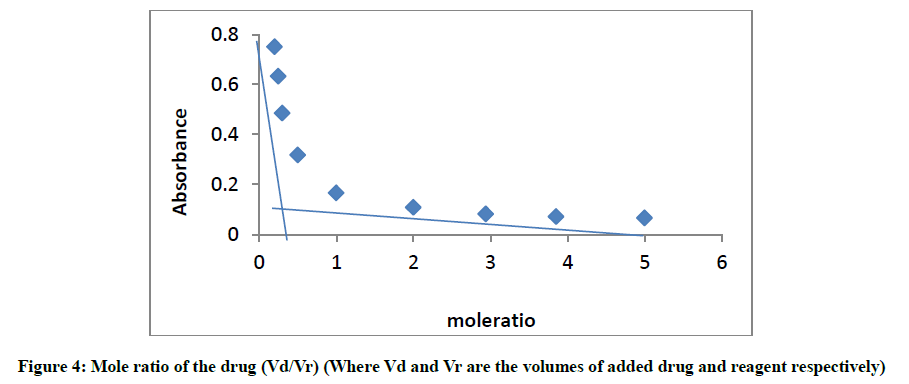
Figure 4: Mole ratio of the drug (Vd/Vr) (Where Vd and Vr are the volumes of added drug and reagent respectively)
This ratio may be attributed to the fact that only one amino group present in the drug is responsible for the product formation. Scheme 1 shows the interaction of glibenclamide-DDQ complex.
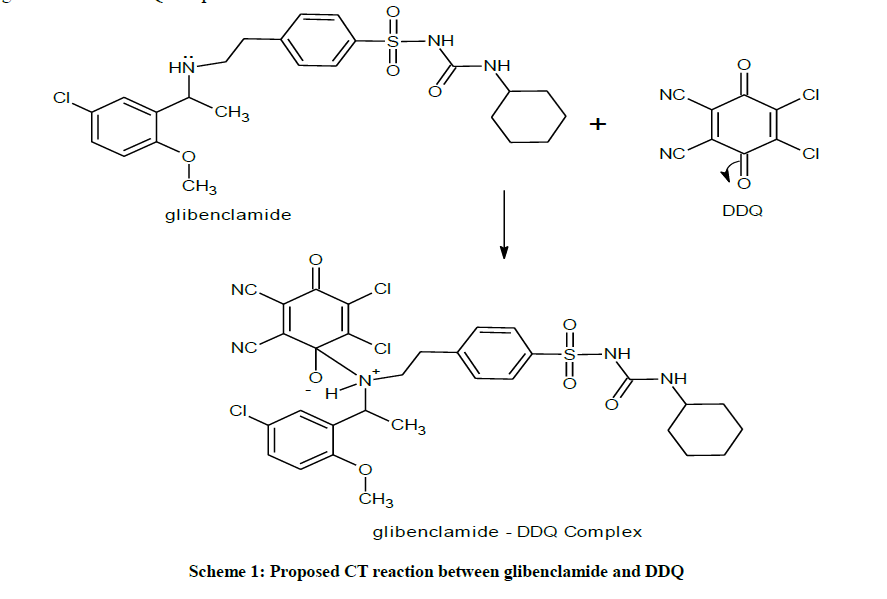
Scheme 1: Proposed CT reaction between glibenclamide and DDQ
Maximum time for the formation of glibenclamide-DDQ complex
The absorbance of complex was slightly stable for 30 min as was obtained by the plot of the absorbance against time (Figure 5).
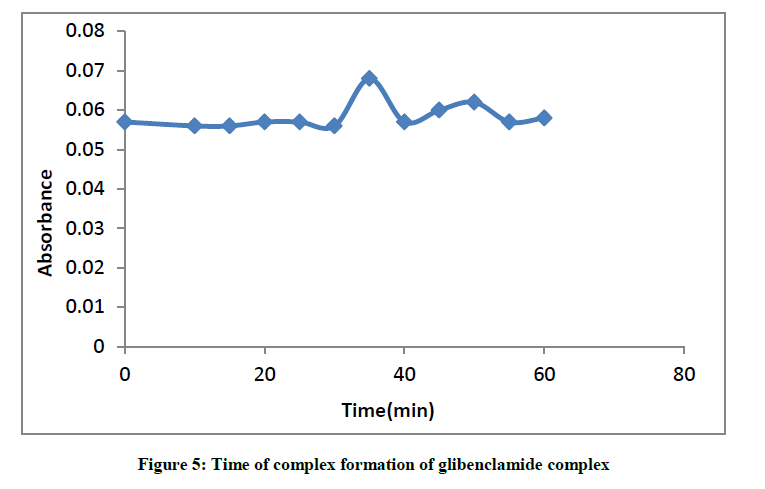
Figure 5: Time of complex formation of glibenclamide complex
The optimum reaction time required for complete colour formation monitored at room temperature was at 35 min.
Effect of temperature on the formation of glibenclamide-DDQ complex
The plot of absorbance versus temperature for the glibenclamide-DDQ complex (Figure 6) shows the maximum peak at 40°C, the effect of temperature on the formation and stability of the complex is easily seen from the result.
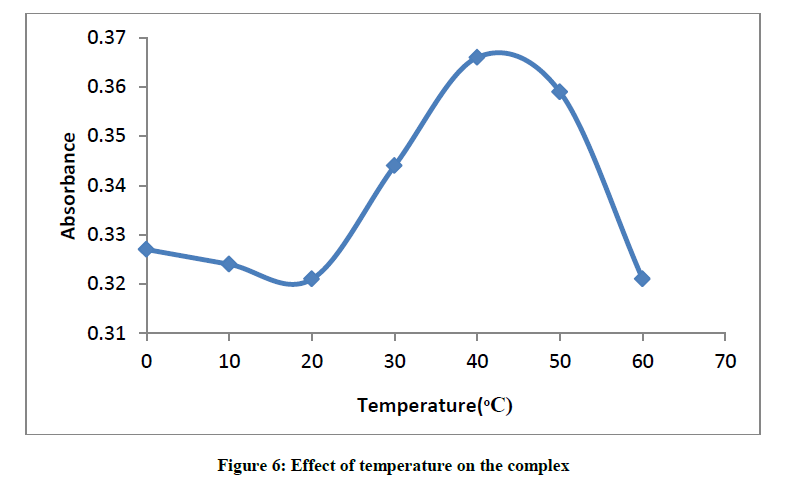
Figure 6: Effect of temperature on the complex
Thermodynamic studies
Based on a 1:1 complex, the association constant of glibenclamide complex was calculated from a single mathematical model:
 (1)
(1)
And by application of Ross and labels equation [22] which is modification of Benesi-Hildebrand equation [23] which depends on the experimental condition that acceptor concentration should not be low enough to be considered negligible with respect to donor concentration.
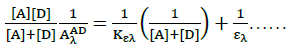 (2)
(2)
Where, [Α]and [D] are the molar concentrations of the acceptor and donor respectively,  and
and  are the absorbance and the molar absorptivity of the complex at the specified
  and Κ is the association constant of the charge transfer complex. The value of ελ and Κ were obtained graphically from the slope and intercept of a plot of
  against
  (Figure 7).
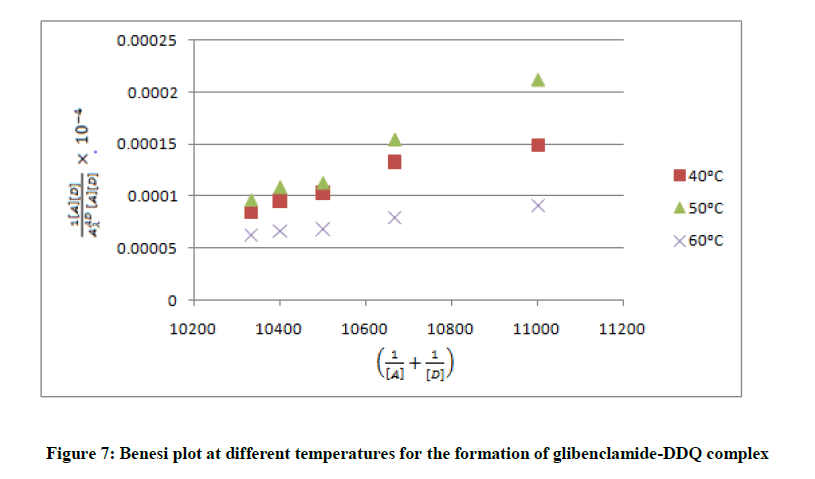
Figure 7: Benesi plot at different temperatures for the formation of glibenclamide-DDQ complex
To minimize error, the slopes and intercepts were determined by the method of least square. Various thermodynamic parameters for the interactions were calculated from these equations:
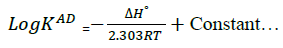 (3)
(3)
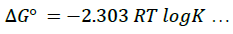 (4)
(4)
 (5)
(5)
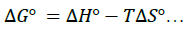
Representative plot of equation 3 is shown in (Figure 8) for glibenclamide complex.
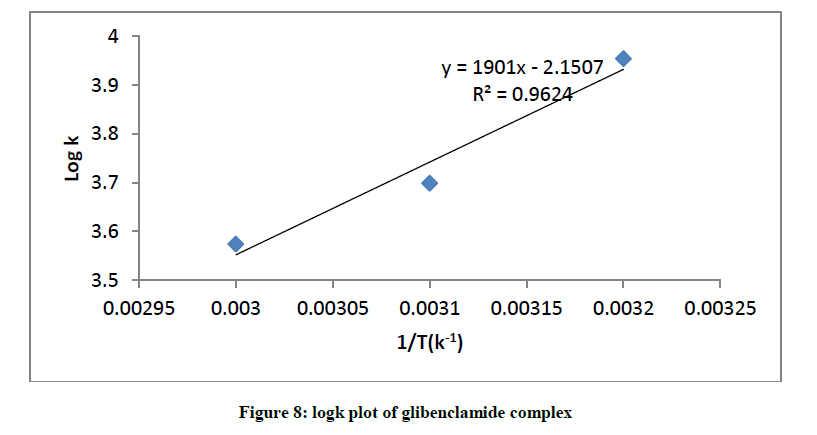
Figure 8: logk plot of glibenclamide complex
The interaction between glibenclamide-DDQ complexes occurs spontaneously (Table 1) and a negative ΔHO as seen is itself a proof to the spontaneity of the reaction [24]. Andrew’s and keeper [25] had earlier demonstrated that ΔHO and ΔS0 generally become more negative as the stability constant for the molecular complexation increases. The value of ΔHO and the high values of association constant in Table 1 is a pointer that the complexes formed are relatively stable.
| K (M-1) | ε (Lmol-1.cm-1) | Logk | 1/T (K-1) | Δ°S (J/mol) Δ°G (kJ/mol) |
|---|---|---|---|---|
| 9000 | 1111.1 | 3.9542 | 0.0032 | 40.58 23.70 |
| 5000 | 1000 | 3699 | 0.0031 | 55.88 22.88 |
| 3750 | 3333.3 | 3.574 | 0.0030 | 55.95 22.79 |
Table 1: Association constant, molar absorptivity, free energy, enthalpy and entropy changes of the glibenclamide-DDQ complex
Effect of pH on the formation of glibenclamide-DDQ complex
Between pH 1-13, the effect of pH on the formation of glibenclamide - DDQ complex was investigated (Figure 9).
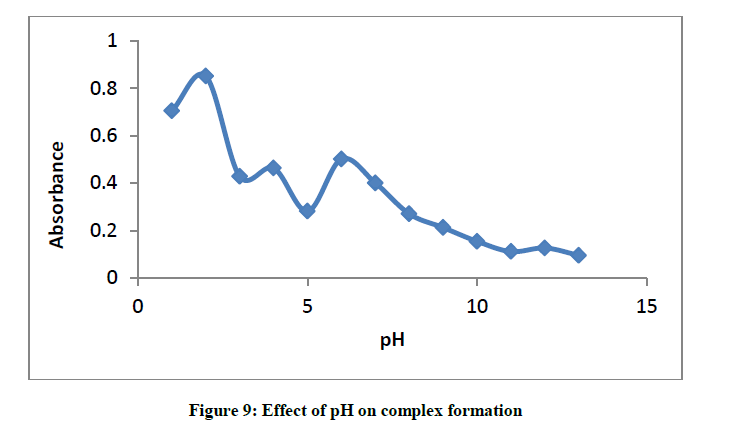
Figure 9: Effect of pH on complex formation
Result shows that the maxima is shown to be at pH 2, this indicates that the best medium for the formation of this complex is pH 2.
Validity of Beers law
The least square fits of absorbance versus concentration for the glibenclamide-DDQ complex at 474 nm is represented in (Figure 10). This indicates that between the concentration ranges of 20 μg/ml-100 μg/ml, Beer-Lambert’s law is obeyed. This ensures the possibility of determining the drug within this range of concentration.
Figure 10: Beer’s plot of glibenclamide complex
The limit of detection (LOD) and limit of quantification (LOQ) were determined using equations (6,7):
 (6)
(6)
 (7)
(7)
The result in Table 2 shows LOD and LOQ to be 3.47 and 10.5 with Sandell sensitivity of 0.95.
| Parametersa | Values |
|---|---|
| ʎmax (nm) Beer’s law limit (μg/ml) Molar Absorptivity (Lmol-1.cm-1) Sandell’s sensitivity (μg/cm-2/0.001A) Regression equation (Ya) Slope (b) Intercept (c) LOQ LOD Correlation coefficient Percentage recovery (%) |
474 20-100 0.99 × 10³ 0.95 0.008 0.002 10.5 3.47 0.991 98.24 |
Table 2: Optimum conditions, statistical data and regression equation of glibenclamide complex
Where, X is the concentration of analyte (μg/ml), Y is the absorbance. a is the average of three determination and five independent determination
Recovery studies of glibenclamide-DDQ complex
Percentage recovery of glibenclamide was 98.24% ± 0.011. The relative standard deviation in Table 3 indicates the precision and reliability of the proposed method with a t-test value of 0.71 and f-test value of 0.95 at 95% confidence level which does not differ variably from an earlier report [26].
| Taken (μg/ml) |
Found (μg/ml) |
Recovery (%) |
RSD (%) |
F-test t-test |
|---|---|---|---|---|
| 20 | 19.22 | 96.14 | 0.07 | 0.97 0.71 |
| 40 | 40.72 | 101.8 | 0.03 | |
| 60 | 52.57 | 87.62 | 0.02 | |
| 80 | 84.77 | 105.96 | 0.01 | |
| 100 | 99.68 | 99.68 | 0.005 |
aAverage of five independent analyses
Table 3: Application of the proposed method for the assay of glibenclamide
Conclusion
The proposed spectrophotometric method for the determination of glibenclamide is simple, rapid, accurate and economical as compared to all the methods used previously. The proposed method has been validated and successfully applied for the determination of glibenclamide with good accuracy of 98.24% ± 0.011. Hence the proposed method is good for the quantitative analysis of glibenclamide.
Acknowledgement
We are thankful to Juhel pharmaceutical, Nigeria for supplying us with the pure form of the drug.
References
- H. Hassib, Y. Issa, J. Anal. Chem., 1996, 39, 329-338.
- N. Kudige, B. Kanakapura, Acta Poloniae Pharmaceutica., 2012, 69, 213-223.
- C. Chigozie, G. Kenneth, C. Festus, O. Okoye, Eur. Chem. Bull., 2013, 2, 1009-1012.
- H. Hala, S. Eldaroti, M. Gadir, S. Refat, M. Abdel, A. Adam, Int. J. Electrochem. Sci., 2013, 8, 5774-5800.
- Y. Frag, G. Mohammed, A. Farag, E. Yussuf, Insight Pharm. Sci.,2011, 1, 47-54.
- I. Ramzin E. El-bagary, F. Elkady M. Bassam, Int. J. Biomed. Sci., 2012, 3, 204.
- O. Farha, J. Baghdad Sci., 2013, 10, 497-1081.
- E. Braude, R. Linstead, K. Wooldridge, J. Am. Chem. Soc., 1957, 3070-3074.
- K. Vmsi, S. Gowri, E-J. Chem.,2008, 5, 493-498.
- E. Khaled, Talanta., 2008, 75, 1167-1174.
- E. Cicy, V.G. Prasanth, R. Amita, Int. J. ChemTech Res.,2012, 4, 356-360.
- B.M. Adul, P. Swathimutyam, A. Padmana, R. Bha, S. Nalini, V. Prakash, J. Pharm. Biomed. Sci., 2011, 8, 2230-7885.
- N. Nalwaya, The India Pharmacist., 2008, 7, 114-118.
- I. Martins, C. Nery, G. Planeti, J. Viana, C. Vianna, Braz. J. Pharm. Sci., 2007, 43, 63-70.
- J. Khatri, O. Abed, B. Abraham, J. Pharm. Pharm. Sci., 2001, 4, 201-206.
- R. Smgh, S. Chang, L. Taylor, Rapid Commun. Mass Spectrum., 1996, 10, 1019-1026.
- K. Kumasak, T. Kojima, H. Honda, J. Health Sci., 2005, 51, 453-460.
- A. Radi, J. Anal. Bioanal. Chem.,2004, 378, 822-826.
- D. Karim, A. Hassan, J. Baghdad Sci., 2012, 9, 296-301.
- A. Raza, Anal. Lett., 2006, 39, 2217-2226.
- H. Bauer, H. Christian, Oreilly, J. Instrumen. Anal., 1978, 178-179.
- S. D. Ross, M. M. Labes, J. Am. Chem. Soc., 1957, 79, 76-80.
- M. Shehadeh, T. Hajar, M. Deeb, Jordan J. Chem., 2007, 2(2), 145-153.
- A.N. Martin, J. Swarbrick A. Cammarata, Physical Pharmacy, 3rd Edi., Lea and Febiger, Philadelphia, 1983, 108.
- C. Nwanisobi, P.O. Ukoha, Proceedings of the 33rd Annual International Conference of Chemical Society of Nigeria, Abeokuta Nigeria, 2010, 182-185.
- R. Sawant, R. Ahmed, S. Ramdin, S. Darade, Int. Res. J. Pharm., 2012, 3, 12-16.


