Research Article - Der Pharma Chemica ( 2018) Volume 10, Issue 1
Stability Indicating Analytical Method for the Simultaneous Estimation of Lidocaine and Nifedipine in the Combined Dosage Form
Dhananjay B Meshram, Khushbu Mehta and Priyanka Mishra*
Department of Quality Assurance, Pioneer Pharmacy Degree College (235), Near Ajwa Cross Road, N.H. 8, Ajwa Nimeta Road, At & Post Sayajipura, Vadodara-390019, Gujarat, India
- Corresponding Author:
- Priyanka Mishra
Department of Quality Assurance, Pioneer Pharmacy Degree College (235)
Near Ajwa Cross Road, N.H. 8, Ajwa Nimeta Road
At & Post Sayajipura, Vadodara-390019, Gujarat, India
Abstract
A simple, precise and accurate stability indicating Reverse Phase High Performance Liquid Chromatography (RP-HPLC), method was developed for the simultaneous estimation of lidocaine and nifedipine in bulk drug and its topical dosage form. Enable HPLC ODS C18 G (250 × 4.6 mm, 5 μm) column was used along with mobile phase containing 20 mM ammonium acetate buffer (pH-4.8 adjusted with glacial acetic acid): Acetonitrile in the ratio 65:35 at the flow rate of 1.0 ml/min using UV detection at 231 nm. The correlation coefficient (r2) was found to be 1.000 in the concentration range of 75-225 μg/ml and 15-45 μg/ml for lidocaine and nifedipine respectively. The retention time was found to be 2.751 min for lidocaine and 7.769 min for nifedipine. Stress degradations of lidocaine and nifedipine were carried out under stress conditions like acid and base hydrolysis, oxidation, thermal and photolytic stress. The degradation products generated as a result of stress did not show any interference to the detection of lidocaine and nifedipine. Moreover the degraded products were also separated. Therefore the developed method can be considered as stability indicating. The developed method was validated and satisfactory results were obtained.
Keywords
Lidocaine, Nifedipine, HPLC, Stability indicating method
Introduction
Chemically Lidocaine (LID) is 2-(diethylamino)-N-(2, 6-dimethylphenyl) acetamide and Nifedipine (NIF) is 3,5-dimethyl 2,6-dimethyl-4-(2- nitrophenyl)-1,4-dihydropyridine-3,5-dicarboxylate (Figures 1 and 2 respectively). LID is an anesthetic whereas NIF is an antihypertensive. The combination is used widely for the treatment of chronic anal fissures. Both LID and NIF are official in Indian Pharmacopeia (IP), British Pharmacopeia (BP) and United States of Pharmacopeia (USP) [1-3]. A literature survey revealed that various methods like UV-spectroscopy, Reverse Phase High Performance Liquid Chromatography (RP-HPLC), HPLC-Tandem Mass (MS/MS) spectrometry and stability indicating methods were available for the estimation of LID whereas, Ultra Performance Liquid Chromatography (UPLC) MS/MS, HPLC, UV spectroscopic methods were reported for the estimation of NIF in single or combined dosage forms [4-18]. Also UV spectroscopic method was reported for the simultaneous estimation of LID and NIF [19]. The aim of present study was to develop and validate a stability indicating method for the simultaneous estimation of LID and NIF in bulk and its topical dosage form.
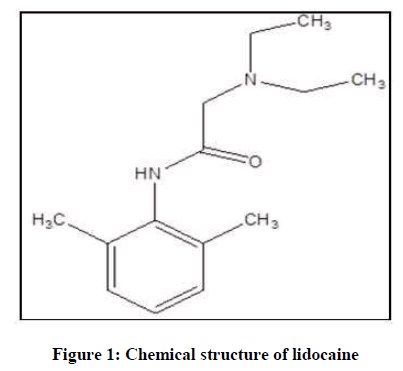
Figure 1: Chemical structure of lidocaine
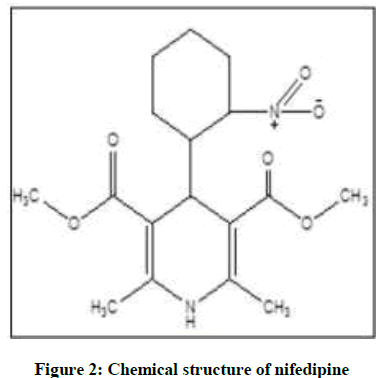
Figure 2: Chemical structure of nifedipine
Instrumentation
Shimadzu Prominence UFLC LC-20AD with UV-detector and Enable C18 G RP column (250 × 4.6 mm, 5 μm) was used. The acquisition and integration of data was performed using LC solution software.
Materials
Authentic drug samples of LID and NIF were obtained from Zydus Cadila Pharmaceuticals Ltd. The combined dosage form named as Anobliss was procured from Samarth Pharmaceuticals Ltd.
Reagents
HPLC grade methanol and water, GR grade ammonium acetate, hydrochloric acid, sodium hydroxide was procured from Merck Specialties Private Limited, Mumbai. AR grade glacial acetic acid and GR grade hydrogen peroxide were obtained from Spectrochim Private Ltd., Vadodara.
Sample preparation
The standard stock solutions were prepared by dissolving requisite amount of LID and NIF in methanol. These solutions were sufficiently diluted to obtain 150 μg/ml and 30 μg/ml of LID and NIF respectively. 5 g of cream containing NIF (0.3% w/w) and LID (1.5% w/w) containing weight equivalent to 15 mg NIF and 75 mg of LID was accurately weighed, transferred to 100 ml of volumetric flask and about 70 ml of methanol was added into it. It was swirled for 30 min and then sonicated for 15 min. The volume was then made up to 100 ml with methanol. The solution was mixed properly and filtered through 0.45 μ nylon syringe filter.
Results and Discussion
Optimization of chromatographic conditions
The mixed standard stock solution containing 30 μg/ml of NIF and 150 μg/ml of LID were chromatographed with mobile phase of different ratios of methanol, water, acetonitrile and various buffer solutions. The pKa value of LID and NIF (7.9 and 5.3 respectively) suggested. Selection of buffers with pH value near its pKa value results in erratic ruggedness of analytical method. Hence, 20 mM ammonium acetate buffer pH 4.8 adjusted with glacial acetic acid was found to be suitable. The overlain spectra (Figure 3) of both the drugs suggested the detection wavelength to be 231 nm. The ratio 65:35% v/v of buffer with methanol at a flow rate of 1 ml/min was optimized since it gave symmetrical peaks for both LID and NIF in bulk and formulation.
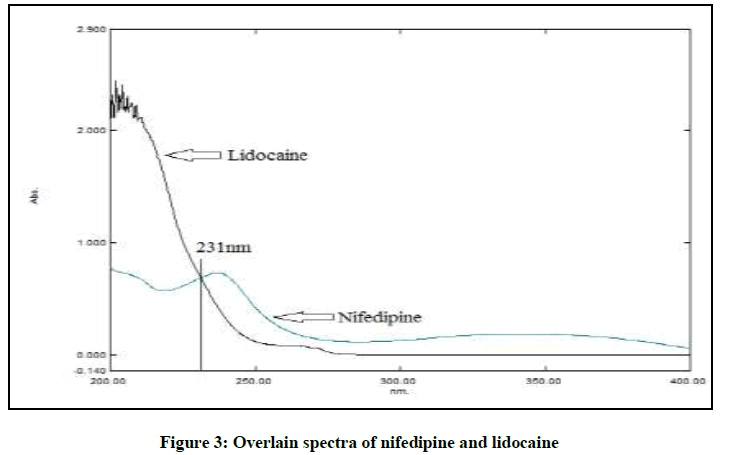
Figure 3: Overlain spectra of nifedipine and lidocaine
Validation of proposed method
After method development and optimization, validation of the proposed method was carried out as per Q2 (R1) guidelines [20].
System suitability testing
Six replicates of a mixture of solution containing LID (150 μg/ml) and NIF (30 μg/ml) was injected and the chromatograms were recorded to check with the system suitability parameters. The resolution of more than 2, tailing factor less than 1 and % RSD of repeatability of less than 2 was obtained (Figure 4).
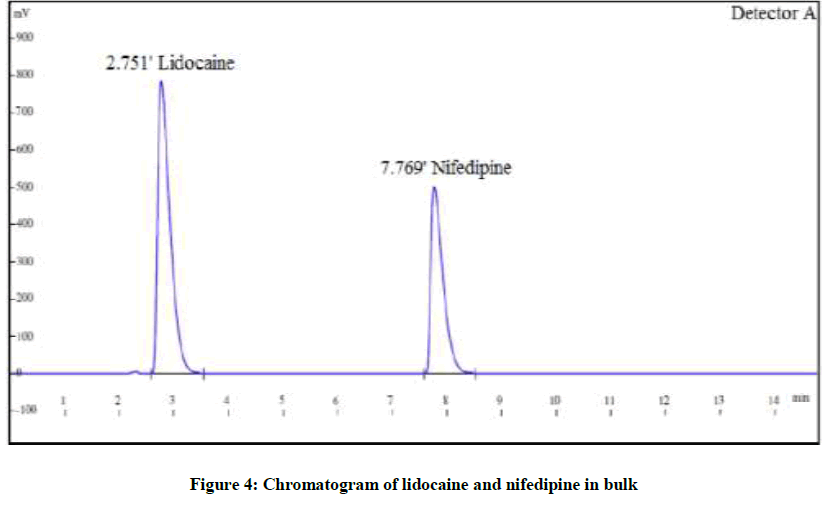
Figure 4: Chromatogram of lidocaine and nifedipine in bulk
Linearity
A calibration curves were plotted over the concentration range of 24-36 μg/ml for NIF and 120-180 μg/ml for LID. Linearity was described by regression line equation and correlation coefficient. The result is shown in Table 1.
| Lidocaine | Nifedipine | ||
|---|---|---|---|
| Concentration (µg/ml) |
Mean area | Concentration (µg/ml) |
Mean area |
| 75.0 | 3748407 | 15.0 | 2858017 |
| 112.5 | 5625287 | 22.0 | 4288483 |
| 150.0 | 7505762 | 30.2 | 5729400 |
| 187.6 | 9379421 | 37.5 | 7159610 |
| 225.1 | 11307691 | 45.0 | 8617062 |
Table 1: Linearity data for lidocaine and nifedipine
Precision
The precision of the instrument was checked by repeatedly injecting (n=6) solution of NIF (30 μg/ml) and LID (150 μg/ml). The results of precision studies are summarized in Table 2. The % RSD was found within the acceptable limit, i.e. < 2.
| Parameters | Nifedipine | Lidocaine | |
|---|---|---|---|
| Specificity | No interference from excipients present in the formulation and from degradants product indicate specific nature of method | ||
| Linearity range | 15-45 μg/ml | 75-225.1 μg/ml | |
| Slope | 191764.309 | 50598.473 | |
| Intercept | 64602.704 | 100744.569 | |
| Correlation coefficient (r2) | 1.000 | 1.000 | |
| Precision (%RSD) |
Repeatability (n=6) | 0.7 | 0.9 |
| Interday (n=3) | 0.02-0.25 | 0.02-0.17 | |
| Intraday (n=3) | 0.02-0.62 | 0.01-0.23 | |
| Accuracy (% Recovery) (n=3) | 100.7-100.3 | 100.4-100.1 | |
| LOD | 0.43 μg/ml | 2.31 μg/ml | |
| LOQ | 1.31 μg/ml | 7.10 μg/ml | |
| Robustness | No significant change | No significant change | |
Table 2: Summary of validation parameters
Recovery studies
Accuracy of the method was assured by use of the standard addition technique. Known amounts of NIF and LID (80, 100 and 120%) standard solutions were added to the pre analyzed sample solution of marketed product. The resulting mixtures were assayed and the results obtained for both drugs were compared to those expected (Table 2).
Limit of Detection (LOD) and Limit of Quantitation (LOQ)
LOD and LOQ were calculated from the linearity studies. The standard deviation of the response and slope was calculated and applied to the following Equations:
LOD=3.3σ/S
LOQ=10σ/S
Where, σ=Standard deviation of the response, S=Slope of calibration curve, obtained LOD and LOQ are summarized in Table 2.
Robustness
Robustness of the method was studied by making variations in the parameters like flow rate (± 0.2 ml/min), mobile phase composition (± 0.2) and detection wavelength (± 2 nm). The deliberate changes made in the flow rate, mobile phase composition and wavelength did not show major impact on the assay value. The results are shown in Table 2.
Forced degradation studies
The forced degradation studies were carried out as per International Conference on Harmonisation (ICH) Q1A(R2) for hydrolysis, oxidation and thermal stress conditions and ICH Q1B for photo stability [21-26]. The conditions for the forced degradation studies are enlisted in Table 3. The extent of degradations is summarized in Table 4. Various chromatograms of the degraded samples are shown in Figures 5-9.
| Type of degradation | Condition | Duration |
|---|---|---|
| Acid degradation | 1 N HCl | 3 h |
| Base degradation | 1 N NaOH | 2 h |
| Oxidation | 3% H2O2 | 3 h |
| Photolytic degradation | Sunlight | 12 h |
| Thermal degradation | 80°C | 2 h |
Table 3: Forced degradation conditions for Lidocaine and Nifedipine
| Stress type | Stress condition | Nifedipine | Lidocaine | ||
|---|---|---|---|---|---|
| %Assay | %Degradation | %Assay | %Degradation | ||
| Control sample | As such sample | 100.6% | NA | 99.3% | NA |
| Acid degradation | 1 N HCl, 5 ml for 3 h | 84.0% | 16.6% | 83.9% | 15.4% |
| Alkaline degradation | 1 N NaOH, 5 ml for 2 h | 87.8% | 12.8% | 82.7% | 16.6% |
| Peroxide degradation | 5 ml 3% H2O2 at RT for 2 h | 89.3% | 11.3% | 87.9% | 11.4% |
| Thermal degradation | At 80°C for 3 h | 88.9% | 11.7% | 87.8% | 11.5% |
| Sunlight degradation | In sunlight for 12 h | 87.9% | 12.7% | 88.0% | 11.3% |
Table 4: Summary of forced degradation study
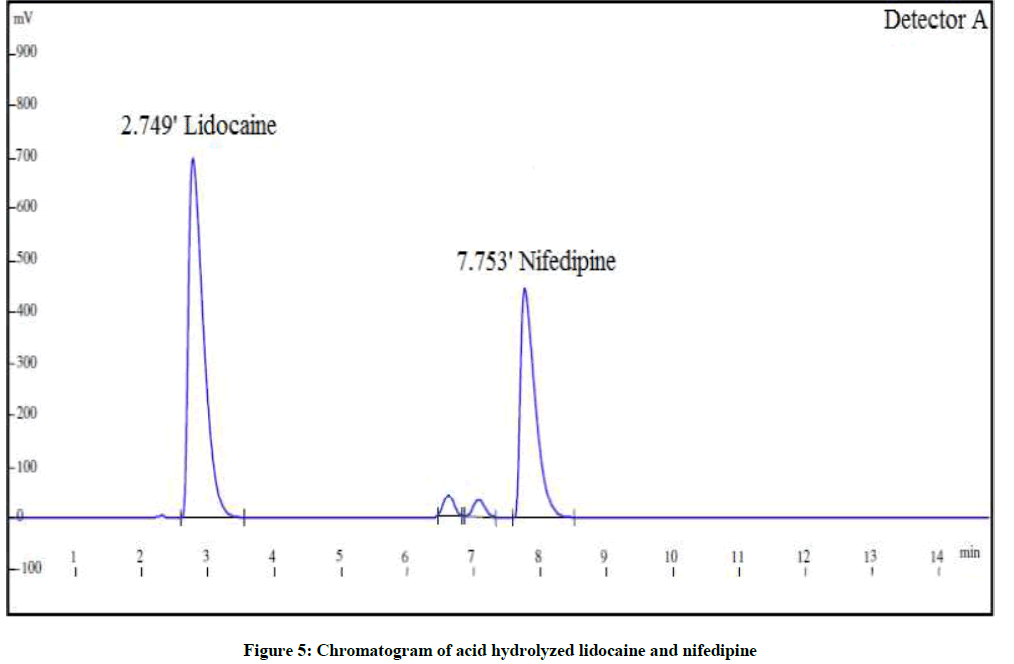
Figure 5: Chromatogram of acid hydrolyzed lidocaine and nifedipine
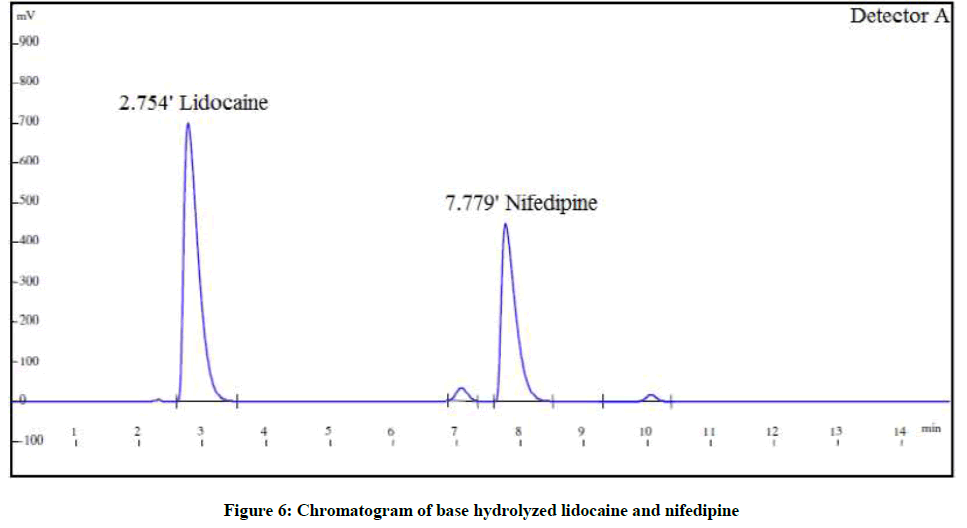
Figure 6: Chromatogram of base hydrolyzed lidocaine and nifedipine
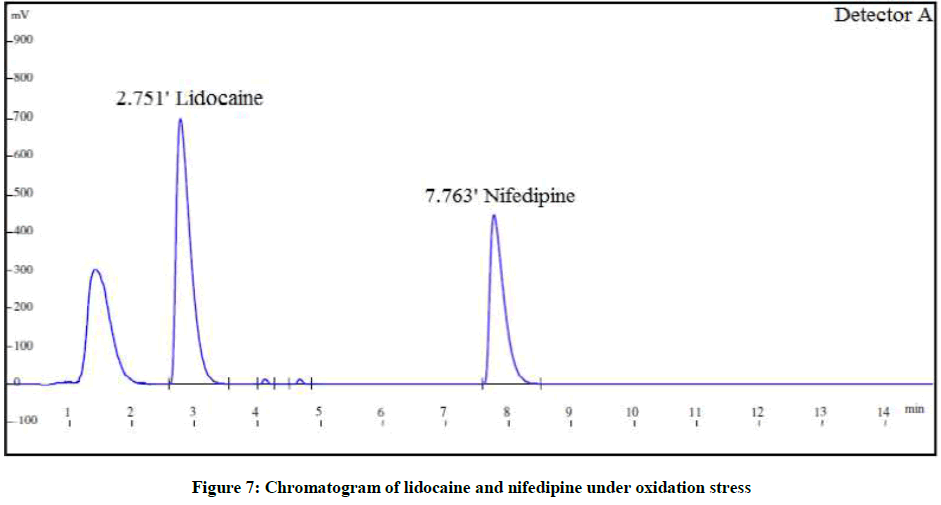
Figure 7: Chromatogram of lidocaine and nifedipine under oxidation stress
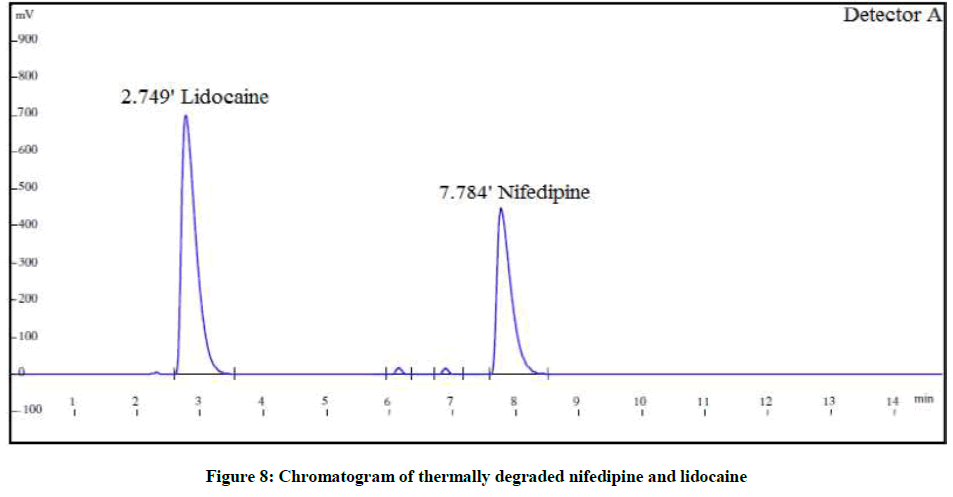
Figure 8: Chromatogram of thermally degraded nifedipine and lidocaine
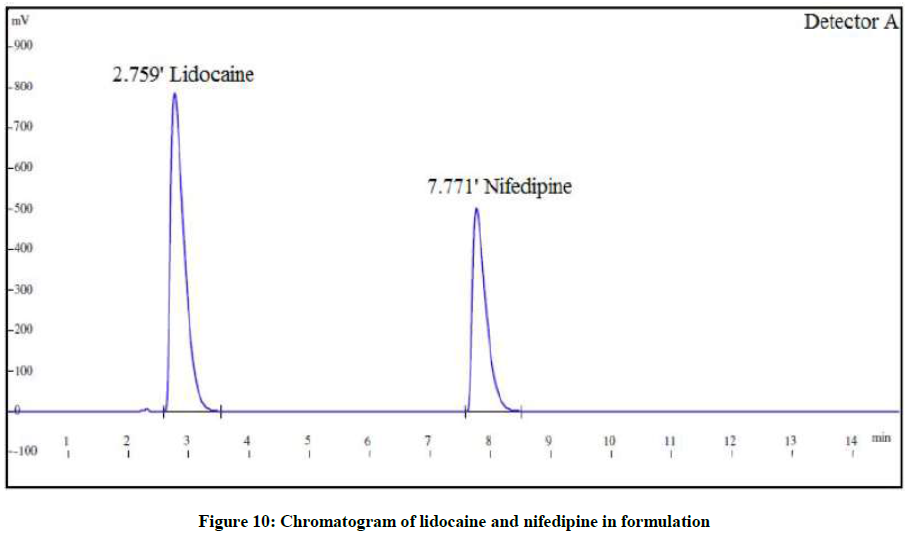
Figure 9: Chromatogram of nifedipine and lidocaine during photolytic stress
Analysis of the marketed formulation
The proposed method was applied to the marketed formulation Anobliss containing 0.3% w/w NIF and 1.5% LID (Figure 10). The assay results were found to be within acceptable limits. The results are shown in Table 5

Figure 10: Chromatogram of lidocaine and nifedipine in formulation
| Brand (Anobliss) | Nifedipine | Lidocaine | ||||
|---|---|---|---|---|---|---|
| Label claim (%) |
Amount found (%) |
%Assay | Label claim (%) |
Amount found (%) |
%Assay | |
| 0.3 | 0.298 | 99.30 | 1.5 | 1.509 | 100.6 | |
Table 5: Analysis of marketed formulation
Conclusion
The developed HPLC method was specific, reliable and accurate. The observed results also showed the relative standard deviations below 2, which are acceptable. The forced degradation studies revealed that the drug was liable to degradation under extreme conditions. The proposed method was capable of identifying the target analyte in presence of its degradants.
Acknoweldgement
The authors are heartily indebted to Shri. D.D. Patel President, Om Gayatri Education and Charitable Trust and Pioneer Pharmacy Degree College for their valuable guidance and support. Authors are grateful to the Zydus Cadila Pharmaceuticals Ltd. and Samarth Pharmaceuticals Ltd for providing the authentic drug sample and formulation and the Management of Pioneer Pharmacy Degree College for providing necessary research facilities.
References
- Indian Pharmacopoeia, Government of Indian, Ministry of Health and Family welfare, Published by Indian Pharmacopoeia Commission, 2007, 2, 1442-1445 and 3, 1299.
- British Pharmacopoeia, London Her Majesty’s, Stationary office 5th Edi., 2007, 2, 1468 and 3, 1243-1244.
- United State Pharmacopoeia-NF, Washington: By authority of U.S. Pharmacopeia Convention, 2008, 3, 2807 and 2, 2526.
- P. Prathyusha, P. Shanmugasundaram, P. Naidu, Int. J. Adv. Pharm. Anal., 2013, 3, 18.
- K. Kumar, R. Thiruvengada, V. Begum, N. Tanveer, Int. J. Pharm. Pharm. Sci., 2012, 4, 610.
- L. Dal, P. Mazzucchelli, J. Chrom. A., 1999, 854, 3-11.
- C.B. Swezey, J.L. Ponzo, Clin. Biochem., 1984, 230-232.
- A. Suhail, S. Safeena, S. Patni, Int. J. Res. Pharm. Sci., 2012, 2, 78-88.
- S. Nada, W.A. Nouruddin, M. Hamed, W.M. Osman, Chrom. Sep. Tech., 2013, 4, 1-6.
- A. Suhail, S. Safeena, S. Patni, Int. J. Sci. Res. Pub., 2012, 2, 1-8.
- J. Abrahum, R. Prasanna, T. Sivakumar, Int. J. Inn. Pharm. Sci. Res., 2014, 2, 1337-1338.
- E. Weijden, M.P. Broek, FF. Ververs, J. Chromatogr. B. Anal. Technol. Biomed. Life. Sci., 2012, 881-882.
- W. Dan, J. Kun, Y. Shuyan, Q. Feng, L. Xiumei, L. Famei, J. Chrom. B., 2011, 879, 1827-1832.
- A. Bijay, R. Sangha, S. Mamata, Int. J. Pharm. Biol. Sci. Arch., 2014, 5, 89-94.
- R. Revathi, T. Ethiraj, V. Saravanan, V. Ganeshan, V. Saranya, T. Sengottuvel, Int. J. Pharm. Pharm. Sci., 2010, 2, 74-76.
- Z. Dragica, S. Suzana, S. Olgica, K. Elena, M. Kalina, J. Krume, J. Emilija, K. Igor, T. Jasmina, Z. Dime, J. Chrom. B., 2006, 839, 85-88.
- R. Nafisur, N. Syed, Acta. Biochem. Pol., 2005, 52, 915-922.
- S. Shelke, S. Sable, S. Neharkar, V. Mathdevru, Int. Res. J. Pharm., 2012, 3, 360-364.
- P. Patel, D. Patel, Inventi J., 2013, 1-5.
- International Conference on Harmonization (ICH), Validation of Analytical Procedures: Text and Methodology, Q2 (R1), 2005.
- The International Conference on Harmonization (ICH), Q2A (R2), Stability Testing of New Drug Substances and Products, 2003.
- The International Conference on Harmonization (ICH), Q1B, Photostability Testing of New Drug Substances and Products.
- S.P. Biradar, T.M. Kalyankar, S.J. Wadher, R.S. Moon, S.S. Dange, Asian J. Med. Anal. Chem., 2014, 01(01), 21-26.
- G. Ngwa, Drug Del. Tech., 2010, 10, 5.
- M. Blessy, R.D. Patel, P.N. Prajapati, Y.K. Agrawal, J. Pharm. Anal., 2014, 159-165.
- M. Bakshi, S. Singh, J. Pharm. Biomed. Anal., 2002, 28(6), 1011-1040.


