Research Article - Der Pharma Chemica ( 2018) Volume 10, Issue 7
Synthesis, Identification, Theoretical And Experimental Studies For Carbon Steel Corrosion Inhibition in Sea Water for New Urea and Thiourea Derivatives linkage to 5-Nitro Isatin Moiety
Rehab Majed Kubba, Suaad Mohammed Hussain Al-Majidi and Athraa Hikmat Ahmad*
Department of Chemistry, College of Science, University of Baghdad, Baghdad, Iraq
- *Corresponding Author:
- Athraa Hikmat Ahmad
Department of Chemistry
College of Science
University of Baghdad
Baghdad, Iraq
Abstract
This research includes synthesis of some new heterocyclic derivatives of 5-Nitroisatin namely 5-Nitro-3-(Ethyl imino acetate)-2-oxo indole (1), 5-Nitro-3-[(imino Aceto) urea]-2-oxo indole (2), 5-Nitro-3-[(imino Aceto)thiourea]-2-oxo indole (3), and 5-Nitro-3-[(imino Aceto) phenylthiourea]-2-oxo indole (4), and characterized by Fourier-transform infrared (FTIR) spectroscopy, Proton nuclear magnetic resonance (1H-NMR) and some physical properties. Theoretically, the inhibition efficiency parameters with physical properties were calculated to ensure for possibility using these compounds as inhibitors. Experimentally, studying the chosen compound of the corrosion inhibition efficiency for carbon steel in 3.5% NaCl solution by isatin derivative is chosen theoretically as the best inhibitor using potentiodynamic polarization.
Keywords
Isatin derivatives, Schiff bases, Corrosion inhibitor, DFT quantum mechanical calculation.
Introduction
Isatin (1H-indole-2, 3-Dione) consist of indole ring and two types of carbonyl groups i.e. keto and lactam group. It was first investigated by Erdman and Laurent [1] in 1841 as a product from the oxidation of indigo by nitric and chromic acid [2], Figure 1.
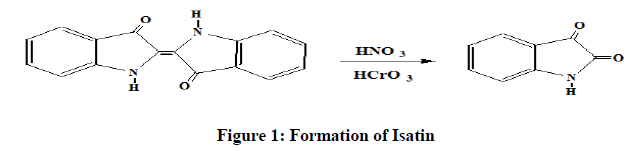
Figure 1: Formation of Isatin
Schiff bases are usually synthesized from the condensation of primary amines and active carbonyl groups. They are one of the important compounds owing to their wide range of biological activities and industrial applications [3]. Some of Schiff bases were reported earlier as corrosion inhibitors for steel. These substances generally become effective as inhibitors by adsorption on the metal surface, for having -CH=N- imines group in the Schiff base molecules [4]. The quantum chemical calculations based on density functional theory (DFT) method, it gives basic parameters for complex molecules [5]. Corrosion of metal surfaces [6] can be controlled by the addition of chemical compounds. This form of corrosion control is called inhibition and the compounds added are known as corrosion inhibitors. Generally, the heterogeneous organic compounds having higher basicity hetero atoms like O, N, and S have the tendency to resist corrosion [7]. The main objective of this investigation is to synthesize new 5-Nitro isatin derivatives and study the inhibitive effect for the mild steel corrosion in seawater, theoretically by using DFT method then experimentally by using potentiostatic methods.
Materials and Methods
Experimental details
Synthesis of 5-Nitro Isatin derivatives
Synthesis of 5-Nitro-3-(Ethyl imino acetate)-2-oxo indol (1) [8]: A mixture of 5-nitro isatin (2.5 g, 0.0079 mol), ethyl glycinate (1.054 g, 0.0079 mol) in absolute ethanol (10 ml) with a few drops of glacial acetic acid was refluxed for 12 h. After that, the mixture was cooled to room temperature and precipitated. The precipitate was poured into ice, filtered, dried and recrystallized from ethanol-water to give the product as red crystals. The physical properties in Table 1.
| Comp No. | Structure | Molecular formula | M. W g/mol | M. P °C | Yield % | Color | Solvent of recryst. |
|---|---|---|---|---|---|---|---|
| 1 | 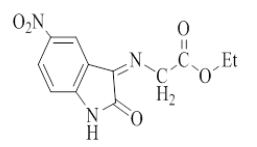 |
C12H11N3O5 | 277.23 | 160-165 | 70 | Dark red | Ethanol-water |
| 2 | 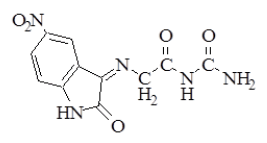 |
C11H9N5O5 | 291.22 | 148-150 | 85 | Brown | Ethanol-water |
| 3 | 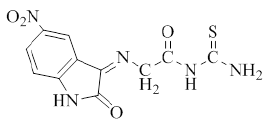 |
C11H9N5O4S | 307.29 | 140-145 | 80 | Brown | Ethanol-water |
| 4 | 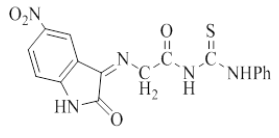 |
C17H13N5O4S | 383.38 | 120-125 | 79 | Brown | Ethanol-water |
Table 1: Physical properties of compounds (1-4)
Synthesis of 5-Nitro-3-[(imino Aceto) urea]-2-oxo indole (2), 5-Nitro-3 [(imino Aceto) thiourea]-2-oxoindole (3) and 5- Nitro-3 [(imino Aceto) phenylthiourea]-2-oxoindole (4) [9]: In 50 ml round bottom flask, a mixture of (1 g, 0.0031 mol.) of compound (1) with (0.0031 mol) of [urea, thiourea, or phenyl thiourea respectively for preparing compounds (2, 3 and 4) respectively] and (0.25 g, 0.0031 mol) of sodium acetate in (8 ml) absolute ethanol, were refluxed for 10-12 h. The mixture was poured into ice, filtered, dried and recrystallized from ethanol-water. The physical properties of compounds (2-4) are listed in Table 1.
Preparation of solutions
Blank solution
35 gm of NaCl was dissolved in distal water, transfer to a 1 l volumetric flask, adding 2 ml DMSO then complete the volume with distal water.
5-Nitro-3-[(imino Aceto) phenyl thiourea]-2-oxoindole (4) solutions: Three concentrations of (5, 10 and 20 ppm) were prepared by dissolving (0.005, 0.01 and 0.02 g), of compound (4), in 2 ml DMSO, transfer to the volumetric flask of 1 l. Then 35 g of NaCl was added to each concentration after dissolving in distal water before completing the volume to 1 l.
Electrochemical measurements
Potentiostatic polarization study
The potentiostat set up includes a Host computer, thermostat, magnetic stirrer, Mat lab (Germany, 2000), potentiostat, and galvanostat. The cell is (1 l) capacity made of Pyrex consist of internal and external bowls. The electrochemical corrosion cell is three electrodes. Carbon steel as a working electrode used to determine the potential of it according to the reference electrode, an auxiliary electrode is a platinum with length (10 cm) and reference electrode a silver-silver chloride (Ag/AgCl, 3.0 M KCl). The working electrode was immersed in the test solution for 30 min to establish steady state open circuit potential (Eocp), then electrochemical measurements were performed in a potential range of (± 200) mV. All tests were carried out at the temperature of (298-318 K) controlled by using a cooling-heating circulating water bath.
Results and Discussion
Synthesis of 5-Nitro Isatin derivatives
5-nitro isatin was reacted with ethyl glycinate, few drops of glacial acetic acid (HOAc) and absolute ethanol to give compound (1), which was used as a starting material for synthesis the (2-4) heterocyclic compounds by a reaction with nitrogen nucleophiles (e.g., urea, thiourea and phenylthiourea) in absolute ethanol to give compounds (2-4) respectively, as shown in Scheme 1.
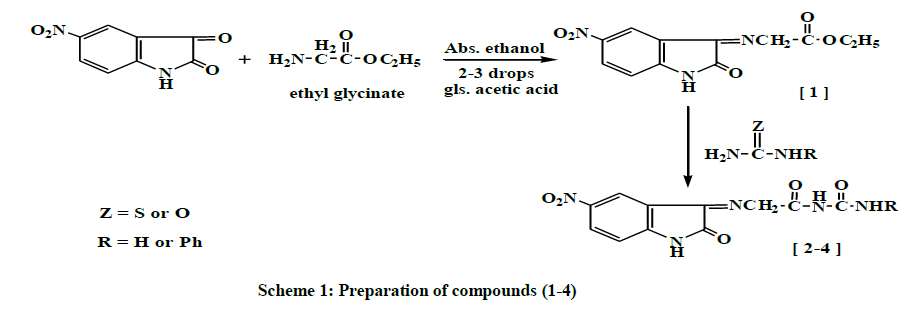
Scheme 1: Preparation of compounds (1-4)
The mechanism involved two steps: the first step is the condensation reaction between ethyl glycinate and carbonyl compounds, involving the nucleophilic addition of ethyl glycinate to carbonyl group producing an intermediate. The second step is the eliminating of water molecule [8], to afford the desirable Schiff's bases compound (1) as shown in Scheme 2.
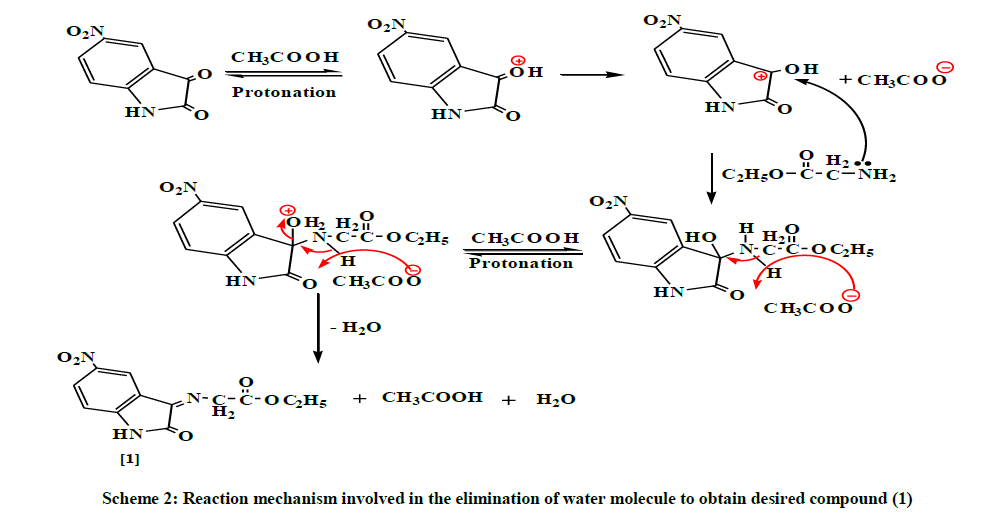
Scheme 2: Reaction mechanism involved in the elimination of water molecule to obtain desired compound (1)
The physical properties (1) are shown in Table 1. The FTIR spectrum of compound (1) showed a new absorption bands (υ, cm-1) appear at (2989, 2927) for (C-H) stretching aliphatic, 1735 for C=O stretching (ester overlap with amide); and 1627 for C=N imine group in addition to appearance of the characteristic absorption bands at (1255, 1191) for (C-O-C) bending vibration, Table 2. The 1H-NMR Dimethyl sulfoxide (DMSO-d6) spectrum (δ, ppm) of compound (1) showed a signal at 1.3 (t, 3H, terminal CH3), a quartet signal at 4.3 due to (-O-CH2), singlet signal at 4.91 due to (=N- CH2-), signal at 6.8 -8.5 (m, 3H, ArH), and signal at 11.1 for (-NH), Table 3. The following mechanism described the formation of compounds (2-4) [8], Scheme 3.
| Com. No. | Structure | n(N-H) | n(C-H) arom. | n(C-H) aliph. | n(C=O) Amide | n(C=N) | Others |
|---|---|---|---|---|---|---|---|
| 1 | 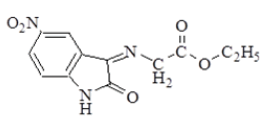 |
3330 | 3090 | 2989 2927 | 1735 Ester overlap with amide | 1627 | ν (C-O-C) Asym. 1255 Sym. 1191 ν (NO2) Asym. 1514 Sym. 1330 |
| 2 | 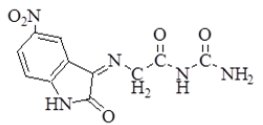 |
3261 | 3061 | 2920 2852 | 1681 | 1631 | n(NH2) Asym. 3442 Sym. 3353 |
| 3 | 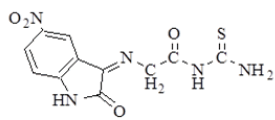 |
3282 | 3068 | 2908 2852 | 1697 | 1620 | n(NH2) Asym. 3463 Sym. 3375 n(C=S) 1251 |
| 4 | 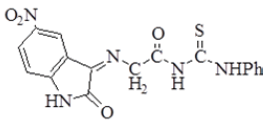 |
3336 | 3080 | 2985 2920 | 1703 | 1629 | ν(NO2) Asym. 1525 Sym. 1325 n(C=S) 1230 |
Table 2: FTIR spectral data (ν, cm-1) of compounds (1-4)
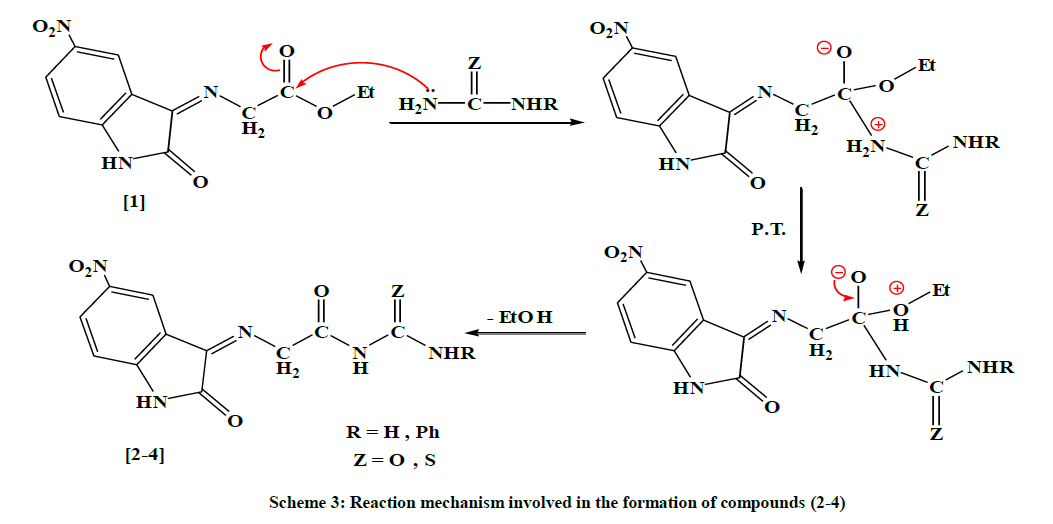
Scheme 3: Reaction mechanism involved in the formation of compounds (2-4)
The physical properties are shown in Table 1. The FT-IR spectrum for compound (2) showed absorption bands (υ, cm-1) at (3442, 3353) for asymmetric and symmetric NH2 stretching respectively, and 1681 for C=O amide. For compound (3), the FTIR spectrum showed absorption bands at (3463, 3375) for asymmetric and symmetric stretching of NH2, 3282 for NH and 1251 for C=S stretching. For compound (4), FTIR showed absorption bands at 1629 for C=N, 1230 for C=S, Table 2. The 1H-NMR spectrum (δ, ppm) of compound (2) showed a signal at 4.3 for (=N-CH2-), multiple signals at 7.1-7.5 due to benzene ring protons, and a single signal at 8.09 due to (-NH2). 1H-NMR spectrum (δ, ppm) of compound (4) showed signal bands at 4.3 (S, 2H, =N-CH2-); signal at 6.8-8 (m, 3H, ArH), signal at 9.1 (s, 1H, -NH-ph), signal at 11.1 for (-NH- ) proton, and signal at 12 ppm due to (CONHCS) proton, Table 3.
| Comp. No. | Structure | 1H-NMR Spectral data (δ ppm) |
|---|---|---|
| 1 | 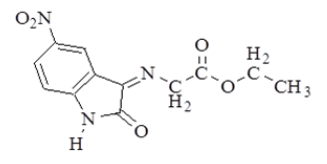 |
1.3 (t, 3H, CH3); 4.3 (q, 2H, -OCH2); 4.9 (s, 2H, =N-CH2-); 6.8-8 (m, 3H, Ar-H); 11.1 (s, 1H,-NH). |
| 2 | 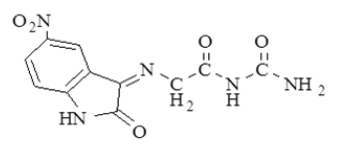 |
4.3 (s, 2H, =N-CH2-); 7.1 -7.5 (m, 3H, Ar-H); 8.09 (s, 2H, NH2), 9.1 (s, 1H, -NH-); 11.0 (s, 1H, -NH) |
| 4 | 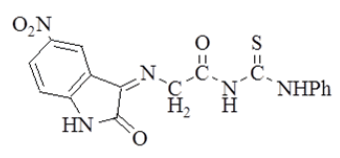 |
4.3 (s, 2H, =N-CH2-); 6.8-8 (m, 3H, Ar-H); 9.1 (s, 1H, -NH-ph); 11.1 (s, 1H, -NH-); 12 (s, 1H,  ). ). |
Table 3: 1H-NMR spectral data (δ, ppm) for compounds (1, 2, 4)
Theoretical study
Quantum chemical calculations
The structural of the organic inhibitor and inhibition mechanism were carried out by using (DFT) Density Functional Theory utilizing Becke's three-parameter and the connection useful of Lee, Yang and Parr (B3LYP) together with the standard double-zeta plus polarization 6-311++G (2d, 2p) [10], for figuring the optimize geometries of the investigated molecules in vacuum and in three liquid media [ethanol (EtOH), dimethyl sulfoxide (DMSO) and water (H2O)], all at the same level of DFT theory, Figure 2. This was implemented in the Gaussian 09 program package [11]. The parameters for the corrosion inhibition efficiency of the studied isatin derivatives were calculated at their equilibrium geometries, using (DFT) method. The optimized calculations for compounds (1-4) shown that they are all planner with Cs symmetry, and the order of the protection efficiency of the four investigated derivatives were determined according to the value of these parameters, which showed that compound (4) is the best with the order of (4)> (3)> (2)> (1), and for all of these compounds, the calculated inhibition efficiency is increased in solvents more than in the vacuum, in the order of (H2O)> (DMSO)> (EtOH)> (vacuum) Table 4. So theoretically, compound (4) is expected to be the best as an inhibitor. So the complete information about this compound was studied and discussed theoretically such as (bonds length, bonds angles, electronic charges, and active adsorption sites ….. etc).
| Inhib. Medium | IE (eV) |
EA (eV) |
h (eV) |
c (eV) |
S (eV) |
ω (eV) |
DN |
|---|---|---|---|---|---|---|---|
| (1) | |||||||
| Vacuum | 7.134 | 3.244 | 1.945 | 5.189 | 0.514 | 6.921 | 0.465 |
| ETOH | 7.063 | 3.103 | 1.98 | 5.083 | 0.505 | 6.524 | 0.484 |
| DMSO | 7.055 | 3.101 | 1.977 | 5.078 | 0.794 | 6.521 | 0.486 |
| H2O | 7.051 | 3.1 | 1.975 | 5.075 | 0.506 | 6.52 | 0.487 |
| (2) | |||||||
| Vacuum | 7.587 | 3.582 | 2.002 | 5.584 | 0.499 | 7.787 | 0.353 |
| ETOH | 7.121 | 3.175 | 1.973 | 5.148 | 0.506 | 6.716 | 0.469 |
| DMSO | 7.107 | 3.164 | 1.971 | 5.135 | 0.507 | 6.688 | 0.472 |
| H2O | 7.101 | 3.16 | 1.97 | 5.13 | 0.508 | 6.679 | 0.474 |
| (3) | |||||||
| Vacuum | 6.138 | 3.62 | 1.259 | 4.879 | 0.794 | 9.435 | 0.842 |
| ETOH | 6.575 | 3.209 | 1.683 | 4.892 | 0.594 | 7.109 | 0.626 |
| DMSO | 6.59 | 3.198 | 1.696 | 4.894 | 0.589 | 7.061 | 0.62 |
| H2O | 6.597 | 3.194 | 1.701 | 4.895 | 0.587 | 7.042 | 0.618 |
| (4) | |||||||
| Vacuum | 6.106 | 3.658 | 1.224 | 4.882 | 0.816 | 9.735 | 0.865 |
| ETOH | 6.456 | 3.24 | 1.608 | 4.848 | 0.621 | 7.308 | 0.669 |
| DMSO | 6.466 | 3.231 | 1.617 | 4.848 | 0.618 | 7.266 | 0.665 |
| H2O | 6.471 | 3.226 | 1.622 | 4.848 | 0.616 | 7.244 | 0.663 |
Table 4: Quantum chemical parameters for inhibitor molecules (1-4) as calculated using DFT method
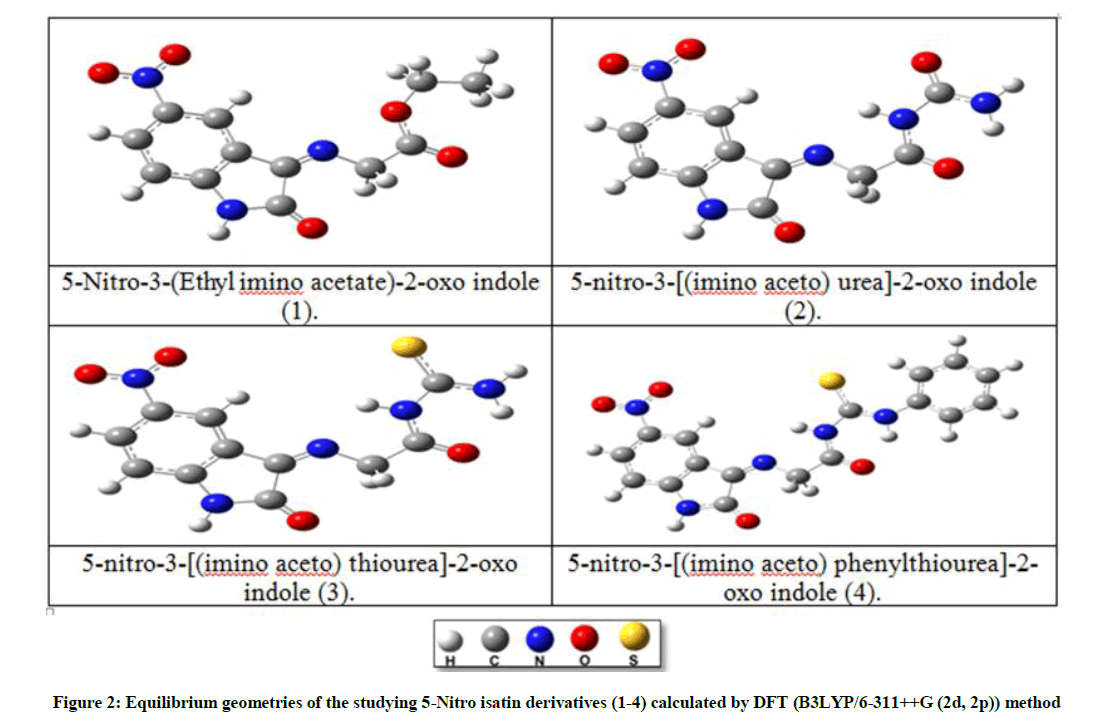
Figure 2: Equilibrium geometries of the studying 5-Nitro isatin derivatives (1-4) calculated by DFT (B3LYP/6-311++G (2d, 2p)) method
Geometrical optimization structure for compound (4)
The calculated optimize structure for compound (4), representatives by the bond length, bond angles, and dihedral angles as shown in Table 5, according to the numbering of atoms shown in Figure 3. The optimized geometrical structure was observed to be the same in the four media (vacuum, EtOH, DMSO, and H2O). The compound under investigation shown that it is planar with a symmetry of Cs, Figure 4. This result is confirmed by the values of dihedral angles [cis (0.0) and trans (180.0)], Table 5.
| Description bond length | Bond length (Å) | Description angle |
Angle (deg) | Description dihedral angle | Dihedral angle (deg) |
|---|---|---|---|---|---|
| N1-C2 | 1.379 | C2N1C9 | 111.840 | N1C2C3C8 | 0.000 |
| N1-C9 | 1.395 | C2N1H | 122.501 | N1C2C3N13 | 180.000 |
| C2-C3 | 1.525 | N1C2C3 | 105.651 | HN1C2O12 | 0.000 |
| C2=O12 | 1.212 | N1C2O12 | 126.340 | C2C3C8C4 | 180.000 |
| C3-C8 | 1.464 | C2C3C8 | 105.502 | C2C3C8C9 | 0.000 |
| C3-N13 | 1.267 | C2C3N13 | 127.786 | C3C8C9C7 | 180.000 |
| C4-C5 | 1.393 | C6C5N10 | 118.606 | C3C8C9N1 | 0.000 |
| C4-C8 | 1.380 | C5C6C7 | 120.274 | C8C4C5C6 | 0.000 |
| C5-N10 | 1.455 | C3C8C9 | 107.472 | C8C4C5N10 | 180.000 |
| C6-C7 | 1.390 | C3C8C4 | 131.928 | C4C5C6C7 | 0.000 |
| C7-C9 | 1.385 | C7C9N1 | 128.641 | N10C5C6C7 | 180.000 |
| C8-C9 | 1.408 | C5N10O11 | 117.889 | C2C3N14C15 | 0.000 |
| N10-O11 | 1.233 | C3N14C15 | 121.083 | C3N14C15C16 | 180.000 |
| N14-C15 | 1.452 | N14C15C16 | 112.567 | N14C15C16O17 | 180.000 |
| C15-H2 | 1.092 | N14C15H2 | 111.531 | N14C15C16N18 | 0.000 |
| C15-C16 | 1.518 | H2C15C16 | 107.778 | O17C16N18C20 | 0.000 |
| C16-O17 | 1.231 | C15C16O17 | 119.219 | C15C16N18C20 | 180.000 |
| C16-N18 | 1.359 | C16N18H19 | 115.716 | C16N18C20S21 | 180.000 |
| N18-C20 | 1.405 | C16N18C20 | 129.972 | N18C20N22C24 | 180.000 |
| C20-S21 | 1.676 | C18C20S21 | 116.089 | S21C20N22C24 | 0.000 |
| C20-N22 | 1.338 | S21C20N22 | 130.012 | ------- | ------- |
| N22-H23 | 1.021 | C20N22C24 | 132.246 | ------- | ------- |
| N22-C24 | 1.412 | H23N22C24 | 114.798 | ------- | ------- |
Table 5: Geometrical structure for compound (4) in the media of (vacuum, EtOH, DMSO, and H2O) as calculated by using DFT method
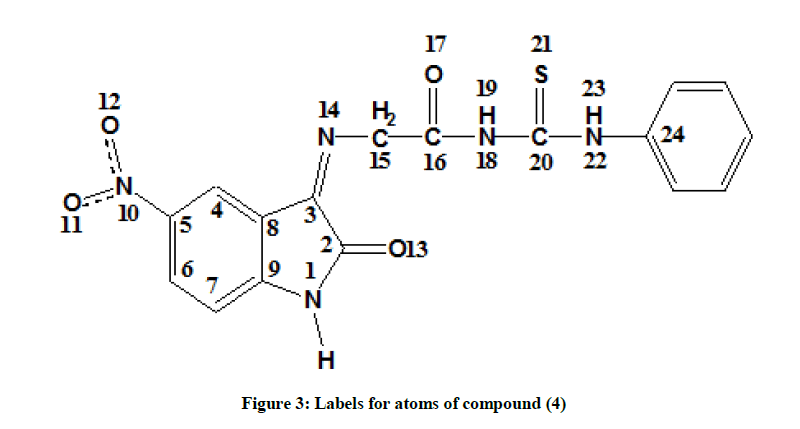
Figure 3: Labels for atoms of compound (4)
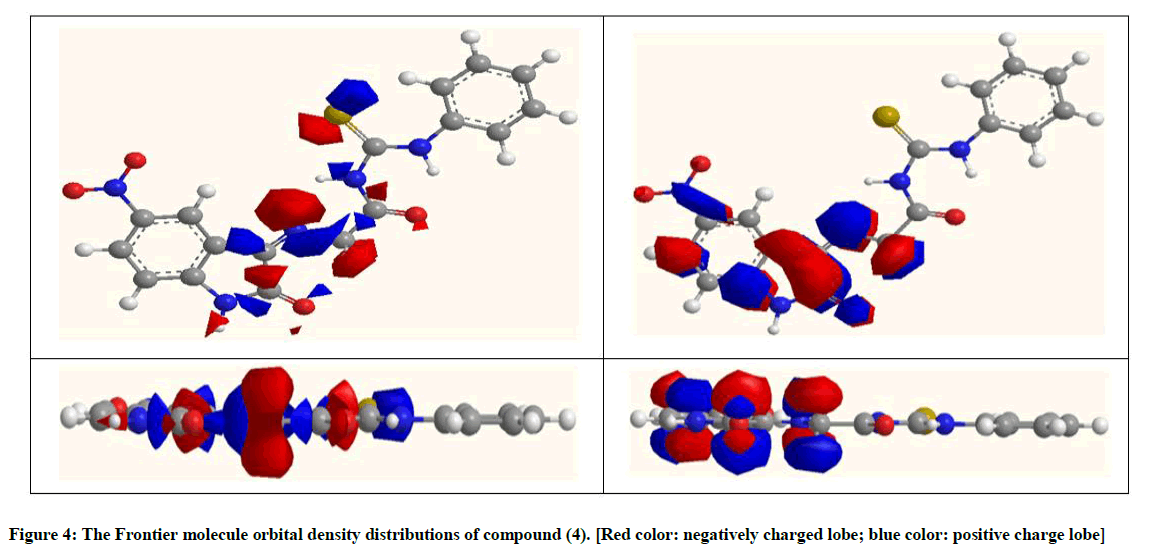
Figure 4: The Frontier molecule orbital density distributions of compound (4). [Red color: negatively charged lobe; blue color: positive charge lobe]
Protection efficiency parameters for compound (4)
Global molecular reactivity
Molecular orbital energies: The HOMO energy (EHOMO) is often inhibitors with high values of EHOMO have a tendency to donate electrons Conversely, the LUMO energy (ELUMO) indicates the lowest its value the higher accepting electrons. The gap energy between the Frontier orbital's (ΔEHOMO-LUMO) is an important factor in describing the molecular activity, so when the gap energy decreased, the inhibitor efficiency is improved. The optimized structures of the studied compounds in the neutral form including their HOMO and LUMO distributions density are shown in Figure 4.
The EHOMO for compound (4), in a vacuum, was (-6.106 eV), decreased in EtOH, DMSO and H2O solvents. The (ELUMO) in vacuum was (-3.658 eV), also decreased in ETOH, DMSO and H2O solvents and the value of ΔEHOMO-LUMO were (2.448 eV) in the vacuum, be a higher in EtOH (3.216 eV), DMSO (3.235 eV) and H2O (3.245 eV) Table 5. This indicates the increase in stability of the inhibitor in solvents in comparison with vacuum due to form the hydrogen bonding.
Dipole moment
The dipole moment (μ in Debye) is the high value of dipole moment increases the adsorption of the inhibitor on a metal surface. The dipole moment for compound (4) in vacuum and EtOH, DMSO, H2O are (7.696, 10.370, 10.470 and 10.517 Debye) respectively, Table 6.
| Inhibitor medium | Sym. | EHOMO (eV) |
ELUMO (eV) |
ΔEHOMO-LUMO (eV) | μ (Debye) |
Etotal (eV) |
|---|---|---|---|---|---|---|
| Vacuum | Cs | -6.106 | -3.658 | 2.448 | 7.696 | -1628.826 |
| ETOH | Cs | -6.456 | -3.240 | 3.216 | 10.370 | -1628.851 |
| DMSO | Cs | -6.466 | -3.231 | 3.235 | 10.470 | -1628.852 |
| H2O | Cs | -6.471 | -3.226 | 3.245 | 10.517 | -1628.852 |
Table 6: DFT calculations of some physical properties for compound (4) at the equilibrium geometry in the media of (vacuum, ETOH, DMSO, and H2O)
Ionization potential energy (IE)
The ionization energy, IE can be expresed as the negative of the HOMO energy), Equation 1.
IE = -EHOMO (1)
So Good inhibitors are of low energy of ionization. The IE of compound (4) inhibitor in the vacuum was (6.106 eV), increased in the EtOH (6.456 eV), DMSO (6.466 eV) and H2O (6.471 eV), Table 7.
| Inhibitor medium | IE (eV) | EA (eV) | Η (eV) | S (eV) | χ (eV) | ω (eV) | ΔN |
|---|---|---|---|---|---|---|---|
| Vacuum | 6.106 | 3.658 | 1.224 | 0.816 | 4.882 | 9.735 | 0.865 |
| ETOH | 6.456 | 3.240 | 1.608 | 0.621 | 4.848 | 7.308 | 0.669 |
| DMSO | 6.466 | 3.231 | 1.617 | 0.618 | 4.848 | 7.266 | 0.665 |
| H2O | 6.471 | 3.226 | 1.622 | 0.616 | 4.848 | 7.244 | 0.663 |
Table 7: Quantum chemical parameters for compound (4) in the media of (vacuum, ETOH, DMSO, and H2O)
Electron affinity (EA)
EA is the amount of energy released when adding an electron to an atom or molecule. The EA is associated with (ELUMO) by the relation in Equation 2.
EA = -ELUMO (2)
A high value of EA means less stable inhibitor. Particles with high electron affinity realized as a good corrosion inhibitor. The electron affinity of compound (4) in the vacuum is (3.658 eV), be higher on using solvents of EtOH (3.240 eV), DMSO (3.231 eV) and H2O (3.226 eV), Table 7.
Chemical hardness (η)
It is a measure of the ability of atom or molecule to transfer the charge. Increasing (η) decreases the stability of the molecule. It is calculated by using Equation 3:
η = (IE −EA)/2 (3)
Compound possess a high value of (η) is considered to be a good inhibitor. The value of (η) for compound (4) in the vacuum was (1.224 eV), be lower in EtOH (1.608 eV), DMSO (1.617 eV) and H2O (1.622 eV), Table 7.
Chemical softness (S)
The measure of flexibility of an atom to receive electrons (S) was calculated using Equation 4:
S = 1/η (4)
Molecules of the high value of S are considered to be a good inhibitor. The values of (S) in the vacuum is (0.816 eV), decreased in ETOH, DMSO and H2O to (0.621, 0.618, and 0.616 eV) respectively, Table 7. The electronegativity (χ)
The ability of an atom or a group to pull electrons (χ) can be calculated by using equation 5:
χ = (IE+EA)/2 (5)
Molecules of high electronegativity indicate to be good inhibitors. The calculated (χ) for compound (4) in the vacuum was found to be (4.882 eV), decreased in solvents to be (4.848 eV), Table 7.
Global electrophilicity index (ω)
ω is the measure of the stability of atom after gaining an electron. Good inhibition compounds are of a low value of (ω) which is calculated by using Equation 6.
ω = χ2/ 2η (6)
The values of (ω) are shown in Table 7. In the vacuum was (9.735 eV), decreased in EtOH (7.308 eV), DMSO (7.266 eV) and H2O (7.244 eV) solutions.
ΔN (Difference in number of electrons transferred)
The fraction of electrons transferred for an inhibitor to carbon steel surface was also calculated using theoretical values of χFe and ηFe for mild steel (7.0 eVmol-1 and 0.0 eV mol-1) respectively. The ΔN values are correlated to the inhibition efficiency resulting from electron donation. According to Lukovits et al. [12] if ΔN< 3.6, the inhibition efficiency increases with increasing electron-donating ability at the metal surface. Table 7, according to DFT calculations; shows that the highest value of ΔN in the vacuum and solvent was related to compound (4) by the tendency of it to receive electrons from the metallic surface to unoccupied orbital (3d) of S atoms. This ability increases the inhibition efficiency. When two systems, Fe, and inhibitor, are brought together, electrons will flow from lower χ(inhibitor) to higher χFe, until the chemical potentials become equal. The number of transferred electrons (ΔN) was calculated by using Equation 7.
ΔN = χFe − χinhib/[2 ηFe + ηinhib] (7)
Local reactivity of the one 5-nitro isatin derivatives
The local of reactivity of the calculated compound is investigated through of the reactive centers of molecules (nucleophilic and electrophilic centers) using the DFT Mulliken charges population analysis. The molecule regions where the electronic charge is large are chemically softer than the regions where the electronic charge is small, so the electron density plays an important role in calculating the chemical reactivity. Chemical adsorption interactions are either by orbital interactions or electrostatic. Electrical charges in the molecule considered driving force of electrostatic interactions. Proven charges are important in physic-chemical properties of compound reactions [13]. Table 8 shows the order of the negative active sites for adsorption (nucleophilic reactive sites) as N14< O13< O17< S21, and the order of the positive active sites for adsorption (electrophilic reactive sites) as C3< C2< C8< C20.
| Atom No . | Electronic charge/ ecu |
Atom No . | Electronic charge/ecu |
Atom No . | Electronic charge/ecu |
Atom No . | Electronic charge/ecu |
|---|---|---|---|---|---|---|---|
| C1 | -0.238V | C7 | -0.300V | O13 | -0.450V | H19 | 0.308V |
| -0.224E | -0.320E | -0.509E | 0.313E | ||||
| -0.223D | -0.321D | -0.511D | 0.313D | ||||
| -0.223W | -0.321W | -0.512W | 0.313W | ||||
| C2 | 0.389V | C8 | 0.635V | N14 | -0.195V | C20 | 0.743V |
| 0.438E | 0.672E | -0.203E | 0.741E | ||||
| 0.440D | 0.673D | -0.203D | 0.741D | ||||
| 0.441W | 0.674W | -0.203W | 0.741W | ||||
| C3 | 0.277V | C9 | -0.269V | C15 | 0.257V | S21 | -0.688V |
| 0.306E | -0.299E | 0.242E | -0.738E | ||||
| 0.309D | -0.300D | 0.242D | -0.740D | ||||
| 0.306W | -0.301W | 0.241W | -0.741W | ||||
| C4 | -0.575V | N10 | 0.006V | C16 | -0.043V | N22 | -0.105V |
| -0.548E | 0.061E | -0.001E | -0.107E | ||||
| -0.547D | 0.063D | -0.003D | -0.107D | ||||
| -0.547W | 0.064W | -0.004W | -0.107W | ||||
| C5 | -0.025V | O11 | -0.154V | O17 | -0.471V | H23 | 0.270V |
| -0.020E | -0.208E | -0.520E | 0.282E | ||||
| -0.021D | -0.210D | -0.522D | 0.282D | ||||
| -0.021W | -0.211W | -0.522W | 0.282W | ||||
| C6 | 0.072V | O12 | 0.118V - | N18 | -0.226V | C24 | -0.343V |
| 0.093E | 0.186E | -0.213E | -0.282E | ||||
| 0.093D | 0.189D- | -0.212D | -0.279D | ||||
| 0.009W | -0.190W | -0.211W | -0.278W |
V: vacuum, E: ethanol; D: dimethyl sulfoxide (DMSO); W: water; blue color: increase in electronic charge to more positive; red color: increase in electronic charge to more negative
Table 8: DFT Mulliken charges population analysis for the calculated inhibitor molecule compound (4) in media (vacuum, ETOH, DMSO, and H2O)
Corrosion measurement of compound (4)
Potentiostatic polarisation measurements
The electrochemical kinetics of metallic corrosion process can be characterized by determining at least three polarisation parameters, such as corrosion current density (Icorr), corrosion potential (Ecorr) and Tafel slopes (ba and bc) listed in Table 9 [14]. However, a requirement for this method to be used is the graph of E versus log I must have at least one straight line [15]. Moreover, for an accurate evaluation of Icorr by Tafel method, the linear regions should extend over about one decade on the log Icorr Axis [16]. The error in the numerical values of Tafel slopes can reduce the accuracy of the values calculated for Icorr [17]. Potentiodynamic polarisation curves for carbon steel in 3.5% NaCl at (298, 308, 318) K in the absence and in the presence of different concentration of compound (4) are shown in Figure 5. The effect of increasing concentration and temperature on Ecorr, Icorr, and Tafel slopes (bc and ba) are shown in Table, as well as protection efficiency PE%, and surface coverage Ө, which were calculated by using the following equations:
| Inhib. conc. ppm |
T/K | Ecorr (mV) |
Icorr (μA.cm-2) |
bc (mV.dec-1) |
ba (mV.dec-1) |
IE % | Ө |
|---|---|---|---|---|---|---|---|
| 0 | 298 | -621 | 121.69 | -146.9 | 82.1 | --- | --- |
| 308 | -785.7 | 164.53 | -26.3 | 73.8 | --- | --- | |
| 318 | -608 | 191.16 | -102 | 315.2 | --- | --- | |
| 5 | 298 | -607.6 | 17.37 | -84.8 | 56.9 | 85.726 | 0.857 |
| 308 | -583 | 27.37 | --- | 77.2 | 83.365 | 0.834 | |
| 318 | -610.6 | 35.51 | -191.5 | 82.5 | 81.424 | 0.814 | |
| 10 | 298 | -560.3 | 13.71 | -106.1 | 68.7 | 88.733 | 0.887 |
| 308 | -576.8 | 22.05 | -121.1 | 68.3 | 86.598 | 0.865 | |
| 318 | -567.6 | 30.17 | -152.6 | 88.3 | 84.217 | 0.842 | |
| 20 | 298 | -588.1 | 5.62 | -97.5 | 59.8 | 95.381 | 0.953 |
| 308 | -608.1 | 8.83 | -138.3 | 77 | 94.633 | 0.946 | |
| 318 | -616.8 | 16.79 | -180.1 | 72.9 | 91.216 | 0.912 |
Table 9: Corrosion data of carbon steel in 3.5% NaCl in absence and presence of various concentrations at a temperature of 298-318 K
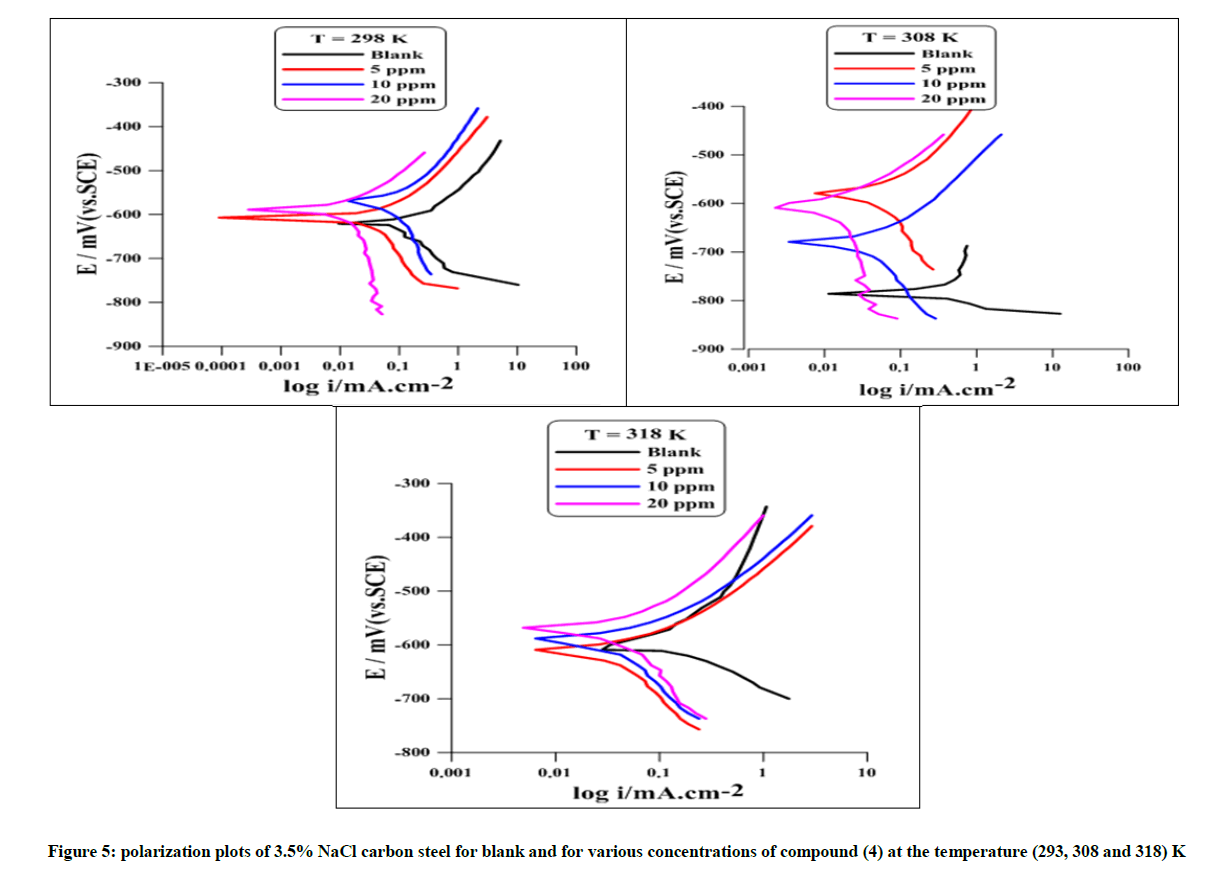
Figure 5: polarization plots of 3.5% NaCl carbon steel for blank and for various concentrations of compound (4) at the temperature (293, 308 and 318) K
%PE = (Iₒ−I)/ I₀ x 100 (8)
Where Iₒ and I: the corrosion current densities in the absence and presence inhibitor, respectively.
Ө = %PE/100 (9)
Adsorption isotherm behavior
Adsorption isotherms describe the role of the inhibitors and contribute information about their interplay with the metal surface. These isotherms require the degree of surface coverage (Ө) for different inhibitor concentrations, which is calculated according to Equation 9. The adsorption behavior of compound (4) was found to obey Langmuir isotherms. The Langmuir adsorption isotherm, given by Equation 10.
Cinh/Ө = 1/ Kads + Cinh (10)
Where, Cinh. is the inhibitor concentration (mol. l-1), Kads. is the adsorption/desorption equilibrium constant (l. mol-1). The plot of (Cinh/Ө) versus Cinh. gave a straight line and the intercept represents (1/Kads.) with a slight deviation of the slope from unity as shown in the correlation coefficient values, Figure 6. Kads. is related to the standard Gibbs free energy of adsorption (ΔGads.), Equation 11.
ΔGads.= -2.303 RT [log 55.5Kads.] (11)
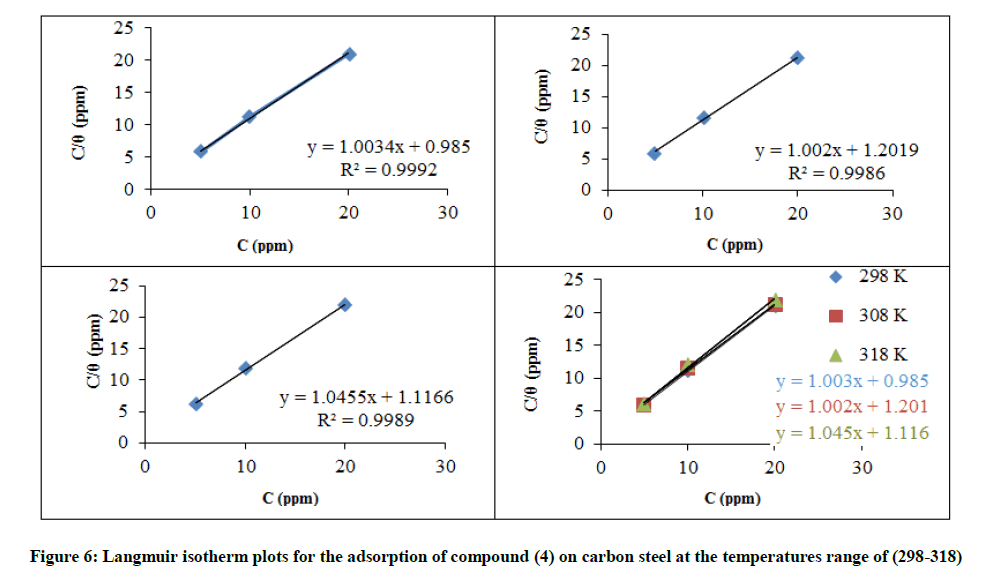
Figure 6: Langmuir isotherm plots for the adsorption of compound (4) on carbon steel at the temperatures range of (298-318)
Where R is the gas constant 8.314 J. mol-1. K-1, T is the temperature (K), and 55.5 is the molar concentration of water (mol. l-1).
The free energy of adsorption (ΔGads.) was calculated from Equation 12.
ΔGads = ΔHads.–TΔSads (12)
Where ΔHads., ΔSads. are the change in enthalpy and entropy of adsorption respectively, calculated from plotting Log Kads. vs. (1/T), Equation 13. Equations 11 and 12 are combined to obtain Equation 13.
Log Kads. = −ΔHads/2.303RT + ΔSads/2.303R + Log 1/55.5 (13)
The high values of Kads. mean a strong interplay of compound (4) with the carbon steel surface in 3.5% NaCl, the optimum inhibition temperature is 298 K, Table 10. The heterogeneous surface properties (i.e. flaws, impurities, cracks, and vacancies) of the steel are responsible for the differential ΔGads. values obtained for compound (4) as the surface coverage value changes [18]. The negative values of ΔGads. ensure the tendency of the adsorption process and stability of the adsorbed layer on the C-steel surface [19]. Moreover, it is found that ΔGads. is slight decreases in temperature. Generally, the values of the ΔGads negative sign are usually characteristic of a strong interaction. Generally, values of ΔGads. around -20 kJ mol-1 or lower negative are the electrostatic interaction between the molecules and the metal (physisorption). Whereas, the more negative values than -40 kJ mol-1 involve charge sharing to form a coordinate type of bond (chemisorption). Calculated ΔGads values indicate that the adsorption mechanism of the synthesized inhibitor on carbon steel in 3.5% NaCl solution is physical adsorption [20]. In the present study, the value of ΔGads. is of -9.99 to -9.68 kJ. mol-1. Figure 6 shows the plotting of Cinh./Ө versus Cinh., a straight line were obtained, the adsorption of the compound (4) takes the Langmuir adsorption isotherm The thermodynamic parameters got ΔHads from slope and. the intercept represents ΔSads, Figure 7. A low value of ΔHads. shows an increase in the stability of the adsorbent inhibitor. ΔHads. of the negative value means exothermic adsorption process. Generally, an exothermic process purports either physisorption or chemisorption while an endothermic process is attributable unequivocally to chemisorptions [21], Table 10. ΔSads. refers to random interaction (4). Corrosion inhibition of C-steel in 3.5% NaCl solution by compound (4) can be explained on the basis of molecular adsorption. It is a mixed complex type comprehensive adsorption. This assuming is confirmed by data obtained for the temperature dependence of the inhibition process [22] and value of ΔGads..
| T/K | Kads. | ΔG KJ. mol-1 |
R2 | ΔHads. KJ. mol-1 |
ΔSads. J. mol-1.K |
|---|---|---|---|---|---|
| 298 | 1.01523 | -9.99235 | 0.999 | -5.03378 | 0.2016003 |
| 308 | 0.83264 | -9.50104 | 0.998 | ||
| 318 | 0.89606 | -9.68294 | 0.998 |
Table 10: Thermodynamic parameters for adsorption of compound (4) on C-steel surface in 3.5% NaCl at different temperatures
Corrosion kinetic and thermodynamic activation parameters
Activation parameters were calculated for blank and different concentration (5, 10, 20 ml/l ) of compound (4). To decide the activation vitality of the corrosion process, activation parameters are taken at different temperatures (298, 308, 318) K in the blank and different concentrations of compound (4). For calculating the activation parameters, Table 11, Arrhenius and Arrhenius transition state equations (14, 15) were used respectively.
| Conc. (ppm) |
ΔG kJ/ mol |
ΔH* kJ/ mol |
ΔS* kJ/ mol. K |
Ea kJ/ mol |
A Molecule/ cm. s |
||
|---|---|---|---|---|---|---|---|
| 298 K | 308 K | 318 K | |||||
| 0 | 61.037 | 62.572 | 64.107 | 15.293 | -0.154 | 17.853 | 1.006E+29 |
| 5 | 65.840 | 67.188 | 68.535 | 25.676 | -0.135 | 28.242 | 9.5851E+29 |
| 10 | 66.443 | 67.714 | 68.985 | 28.568 | -0.127 | 31.133 | 2.41322E+30 |
| 20 | 68.799 | 69.750 | 70.701 | 40.458 | -0.095 | 43.024 | 1.13135E+32 |
Table 11: Corrosion kinetic parameters for carbon steel in 3.5% NaCl in the blank and presence of different concentrations of compound (4)
Log (Icorr) = Log A – Ea/2.303RT (14)
Log (Icorr/T) = Log (R/Nh) + ΔS*/2.303R - ΔH*/2.303RT (15)
Where (Icorr) is corrosion current density, (Ea) is the apparent activation energy, (R) is the gas constant (8.314 J mol-1 K-1), (T) is temperature in K, (A) is the Arrhenius factor, (h) is the Plank's constant (6.626 x 10⁻³⁴ J.s), (N) is the Avogadro’s number (6.022 x 10²³ mol-1), (ΔH*) is the enthalpy of activation and (ΔS*) is the entropy of activation.
The plot of log Icorr against 1/T presented a linear relation with a slope (-Ea / 2.303R) and the intercept of the extrapolated line log A. Figure 8. The events showed that the value of Ea for an inhibited solution is higher than that for the blank solution, suggesting that dissolution of carbon steel (C.S) is slow in the presence of inhibitor, Table 11.
The enthalpy of activation ΔH* is obtained from the slope (ΔH*/ 2.303R) obtained from scheming (log Icorr/T) versus (1/T) with ΔS* which obtained from an intercept of [(log (R/ Nh) + (ΔS*/2.303R)], Figure 9. The positive sign of enthalpies ΔH* reflects the endothermic nature of dissolution process. The ΔH* for corrosion reaction increasing in the different concentration of compound (4). The entropy of activation ΔS* in the blank and inhibitor has negative value, was changed when compound (4) was added at a temperature range (298-318 K) (Table 11), it indicates a decrease in entropy takes place ongoing from blank to the inhibitor [23]. The activation free energy demonstrates that the corrosion reaction of C-steel is non-spontaneous and increase with increasing temperature, assume that corrosion reaction increase with increasing temperature.
Conclusion
Synthesis of novel 5-Nitroisatin derivatives (1-4) was found to be effective inhibitors for carbon steel corrosion in 3.5% NaCl solution. Quantum mechanical methods showed the compound (4) best inhibitor than others. The potentiodynamic polarization measurements showed that the compound (4) can be classified as a mixed inhibitor in 3.5% NaCl solution. The adsorption of compound (4) on mild steel surface follows the Langmuir adsorption isotherm model. Isatin derivatives possess a wide range of biological activities, therefore, they used as a safety and nontoxic inhibitors.
References
- M. Pal, N. Sharma, K. Priyanka, J. Adv. Sci. Res., 2011, 2, 2, 35-44.
- G. Mathur, S. Nain, Med Chem., 2014, 4, 4, 417-427.
- Z. Hussain, E. Yousif, A. Ahmed, A. Altaie, Org. & Med. Chem. Letters, 2014, 4-1.
- H.M. Abd El-Lateef, M. Ismael, I. M. Mohamed, Corros Rev, 2015, 33, 1-2, 77-97.
- R.M. Kubba, D.A. Challoob, S.M.H. Al-Majidi, Int. J. Sci.& Res., 2017, 6, 1656-1669.
- S. Chitra, K. Parameswari, A. Selvaraj, Int. J. Electrochem. Sci., 2010, 5, 1675-1697.
- R.M. Kubba, A.S. Alag, S.M.H. Al-Majidi, Int. J. Sci. & Nat., 2017, 8, 3, 591-603.
- S.M.H. Al-Majidi, L. Hamma, J. Zank. Sula., 2015, 17, 1, 49-59.
- S.M.H. Al-Majidi, R. Abdul-Hussein, J. Zank. Sula., 2015, 17, 1, 33-48.
- A. Becke, J. Chem. Phys., 1993, 98, 5648-5652.
- M. Frisch, W. Trucks, G. Schlege, H. Scuseria, G. Robb, M. Cheeseman, J. Montgomery, J. Vreven, T. Kudin, K. Burant, J. Millam, J. Iyengar, S. Tomasi, J. Barone, V. Mennucci, B. Cossi, M. Scalmani, G. Rega, N. Petersson, G. Nakatsuji, H. Hada, M. Ehara, M. Toyota, K. Fukuda, R. Hasegawa, J. Ishida, M. Nakajima, T. Honda, Y. Kitao, O. Nakai, H. Klene, M. Li, X. Knox, J. Hratchian, H. Cross, J. Bakken, V. Adamo, C. Jaramillo, J. Gomperts, R. Stratmann, R. Yazyev, O. Austin, A. Cammi, R. Pomelli, C Ochterski, J. Ayala, P. Morokuma, K. Voth, G. Salvador, P. Dannenberg, J. Zakrzewski, V. Dapprich, S. Daniels, A. Strain, M. Farkas, O. Malick, D. Rabuck, A. Raghavachari, K Foresman, J. Ortiz, J. Cui, Q. Baboul, A. Clifford, S. Cioslowski, J. Stefanov, B. Liu, G. Liashenko, A. Piskorz, P. Komaromi, I. Martin, R. Fox, D. Keith, T. Al-Laham, M. Peng, C. Nanayakkara, A. Challacombe, M. Gill, P. Johnson, B. Chen, W. Wong, M. Gonzalez, C. Pople, J. A. Gaussian, Gaussian. Inc. Pittsburgh PA, 2009, 3.
- R. M. Kubba, A.S. Alag, Int. J. Sci. & Res., 2017, 6, 6, 1632-1643.
- S. Safak, B. Duran, A. Yurt and G. Turkog˘lu, Corros. Sci., 2012, 54, 251-259.
- R.M. Kubba, D.A. Challoob, Int. J. Sci. & Nat., 2017, 8, 3, 1-18.
- S. Wolynec, Técnicas Eletroquímicas em Corrosão, Editora da Universidade de São Paulo, São Paulo, 2003.
- H. Flitt, D. Schweinsberg, Corros. Sci., 2005, 47, 3034-3052.
- M. Amin, S. Rehim, H. Abdel-Fatah, Corros. Sci., 2009, 51, 882-894.
- O. Abiola, Corros. Sci., 2006, 48, 3078-90.
- J. Cruz, R. Martinez, J. Genesca, E. Ochoa, J. Electroan. Chem., 2004, 566, 1, 111-121.
- M. Bahrami, S. Hosseini, P. Pilvar, Corros. Sci., 2010, 52, 2793–2803.
- W. Durnie, R. DeMarco, A. Jefferson, B. Kinsella, J. Electrochem. Soc., 1999, 146, 5, 1751-1756.
- M. Solomon, S. Umoren, I. Udosoro, A. Udoh, Corros. Sci., 2010, 52, 4, 1317-1325.
- N. Soltani, M. Behpour, S. Ghoreishi, H. Naeimi, Corros. Sci., 2010, 52, 4, 1351-1361.


