Research Article - Der Pharma Chemica ( 2018) Volume 10, Issue 8
Telmisartan and Hydrochlorothiazide Simultaneous Quantitative Estimation in Bulk and Marketed Tablet Formulation Study by Hptlc- By Stability Indicating Method
Rahul Shukla1*, Vijay Nigam2 and Shweta1
1School of Pharmaceutical Science, Shri Venkateshwara University, Gajraula, Amroha, U.P., India
2Patanjali yogpeeth, Haridwar, India
- *Corresponding Author:
- Rahul Shukla
School of Pharmaceutical Science
Shri Venkateshwara University
Gajraula, Amroha, U.P., India
Abstract
A stability indicating High Performance Thin Layer Chromatography (HPTLC) method is proposed for the simultaneous estimation of Telmisartan and hydrochlorothiazide in bulk and tablet formulation. Well resolved chromatogram was obtained on TLC plates coated with silica gel 60F254 with densitometric detection at 233 nm. Two drugs were satisfactorily resolved with Rf 0.21 ± 0.02 and 0.53 ± 0.02 for Telmisartan and Hydrochlorothiazide respectively. Linearity was found in the range of 0.18-5.76 μg / band (r2 = 0.999) for telmisartan and 0.056-1.6 μg/ band (r2=0.999) for Hydrochlorothiazide. The % recovery for analytes were in the range of 98.5%-101.6% w/w. Drugs were subjected to stress conditions like acid, base, neutral hydrolysis, oxidative, photolytic and thermal stress. Hydrochlorothiazide was found to be more prone to degradation than telmisartan. Both drugs were oxidised fast as compared under other stress conditions. Peak purity has indicated no interference from numerous degradation products formed with the analysis of drugs.
Keywords
Telmisartan, Hydrochlorothiazide.
Introduction
Telmisartan (TEL), chemically is 2-(4-{[4-methyl-6-(1-methyl-1H-1,3-benzo-diazol-2-yl)-2-propyl-1H-1,3-benzo-diazol-1-yl]-methyl}-phenyl)-benzoic acid and is used in the management of hypertension [1]. Hydrochlorothiazide (HCT) used as an antihypertensive, chemically is 6-chloro-3,4-dihydro-2H-1,2,4-benzothiadiazine-7-sulfonamide-1,1-dioxide [2]. Their combination is available with different brand names with dose of HCT as 12.5 mg and TEL with varying strengths as 20 mg, 40 mg or 80 mg. Telmisartan is estimated alone or in combination with other actives by Reversed Phase High Performance Liquid Chromatography (RP-HPLC) [3], Ultra Performance Liquid Chromatography (UPLC) [4] and High Performance Thin Layer Chromatography (HPTLC) [5,6]. Hydrochlorothiazide alone or in combination is estimated by LC [7-11] and HPTLC [9,12,13]. Methods developed for simultaneous analysis of both these drugs include HPLC [14-16], UPLC [17], orthogonal polynomial method [18], spectrofluorimetry and HPTLC [19].
It is important to establish quality of drug substance or drug product over a period of time under a variety of environmental and microenvironmental conditions of a drug. The factors like temperature, humidity, light or change in pH due to microenvironment can accelerate drug degradation. Hence, an established stability indicating method is very helpful in recommending storage conditions, shelf life and order of degradation reaction. Although stability indicating methods are established for single drug formulation, there are limited methods for combination drug formulations. Since, it is more challenging to develop chromatographic conditions that resolve both drugs from numerous degradation products formed during various stress conditions. Apart, the proportion of different drugs in multicomponent formulation varies and it becomes challenging to develop a method that detects the degradation products of a potent drug. Until now, there is no report on stability indicating HPTLC method for simultaneous analysis of TEL and HCT in pharmaceutical formulation whereas ICH insists on development of stability indicating analytical method for assay [20]. Hence, an attempt is made to develop and validate a method to quantify these drugs in presence of their degradation products.
Materials and Methods
Chemicals and reagents
Pure drugs of TEL and HCT were kindly provided by Cipla Ltd. as a gift sample. All chemicals and reagents used were of analytical grade and were purchased from Merck Chemicals, India. Methanol was purchased from Suma.
Instrumentation and chromatographic conditions
Chromatography was performed on 20 cm × 10 cm aluminum-backed TLC plates, coated with 250 μm layer of silica gel 60 F254 (E. Merck, Darmstadt, Germany). A unidirectional air flow was maintained in the laboratory. Samples were applied to the plates as 8 mm bands, by means of 25 microlitre Linomat V applicator (Camag, Muttenz Switzerland) equipped with a Hamilton syringe (Bonduz., Switzerland). The slit dimension was 6.00 mm × 0.30 mm and the scanning speed was 20 mms-1. A constant application rate of 1 μL/s was used and the space between two bands was 5 mm. The monochromator bandwidth was set at 20 nm, each track was scanned thrice and the baseline correction was used. Ascending development of the plates was performed with Ethyl acetate: 1,4 dioxane: Methanol: Ammonia (15: 1.5: 3: 1.5 v/v/v/v) as mobile phase, in a Camag 20 cm × 10 cm twin trough glass chamber (Camag, Muttenz, Switzerland. The optimized chamber saturation time for mobile phase was 30 min at room temperature. The length of chromatogram run was 8 cm. After development, plates were dried. Densitometric scanning was performed on Camag TLC Scanner 3 in the reflectance absorbance mode at 233 nm for all measurements. The source of radiation utilized was deuterium lamp, which emits UV spectrum between 190 nm to 400 nm. Wincats software version 3.15 supplied by Anchrom technologists, (Mumbai) was used.
Solvent selection
The solubility of TEL and HCT was checked in different solvents and a combination of ammonia with methanol was selected as the solvent for dissolving both the drugs.
Preparation of standard solutions and Selection of analytical wavelength
Ten milligram of each drug TEL and HCT were weighed separately, 1 ml of ammonia was added. The volume was made to 10 ml with methanol so as to get the concentration of 1 mg/ml. Standard stock solutions were further diluted with methanol to concentration of 100 μg/ml for each drug separately. The solution containing 15 μg/ml of TEL and 5 μg/ml of HCT were scanned on UV Visible spectrophotometer for selection of analytical wavelength.
Optimization of mobile Phase
Optimization of mobile phase was initially started with the use of neat solvents like methanol, chloroform, and toluene. Various ratios of toluene with methanol, chloroform with acetonitrile were tried. Various solvent mixtures were tried to achieve optimum resolution between HCT and TEL. After several trials, mixture of Ethyl acetate: 1,4 dioxane: Methanol: Ammonia (15: 1.5: 3: 1.5, v/v/v/v) was chosen as the mobile phase for analysis. The selection was based on peak shape, compactness and resolution.
Assessment of solution stability
Individual and mixed standards were analysed using the developed chromatographic conditions for variation in the peak area for 12 h.
Assay of marketed tablet formulation
Telma H (Glenmark) containing 40 mg of TEL and 12.5 mg of HCT was used for analysis. A powder equivalent to 45 mg of TEL and 14 mg of HCT from triturated tablet formulation was accurately weighed and dissolved in methanol and ammonia, sonicated and volume was made to 25 ml with methanol. The solution was filtered through Whatman filter paper no. 41 and volume was adjusted to 25 ml with methanol. 1 ml of solution was diluted with 10 ml of methanol to concentration of 0.18 μg/μl of TEL and 0.056 μg/μl of HCT. 6 μl of this solution was applied on the plate. The amount of HCT and TEL present in tablet formulation was calculated by comparing peak area of sample with that of standard.
Method validation
Validation of the TLC method was carried out as per ICH guidelines with the following parameters.
Linearity and range
22.5 mg of TEL and 7 mg of HCT were weighed in 25 ml volumetric flask and diluted with methanol and ammonia (2.5 ml). 2 ml of this stock were further diluted to 10 ml to get the concentration of 0.18 μg/μl of TEL and 0.056 μg/μl of HCT. TEM and HCT were separately spotted on the TLC plate to obtain final concentration 0.18-5.76 μg /band and 0.056-1.6 μg /band respectively. The plate was developed using previously described mobile phase. The procedure was replicated thrice. The peak areas were plotted against the corresponding concentrations to obtain the calibration graphs. Densitometric scanning was performed at 233 nm for the detection of TEL and HCT with Rf value of 0.21 ± 0.02 and 0.53 ± 0.02 respectively. Residuals for both the drugs were plotted by calculating the distance of response from the regression line and plotting it against the concentration of analyte.
Limit of detection (LOD)
LOD was calculated from the formula LOD=3.3σ/S, where σ=Standard deviation of y intercept of calibration curve, S=Slope of the calibration curve.
Limit of quantification (LOQ)
LOQ was calculated from the formula LOQ=10σ/S, where σ=Standard deviation of y intercept of calibration curve, S=Slope of the calibration curve.
Specificity
The specificity of the method was ascertained by comparing densitogram of formulation with that of mobile phase, standard drug sample of TEL and HCT. The spot for TEL and HCT in formulation was confirmed by comparing the Rf and spectra of the standard.
Accuracy
Accuracy of the method was determined by applying the method to sample to which known amount of TEL and HCT standard powder corresponding to 80%, 100% and 120% of label claim were added. The mixtures were analyzed by running chromatogram in optimized mobile phase.
Precision
Sample solution of concentration 1.08 μg/ band for TEM and 0.336 μg /band for HCT were used for studying degree of precision of the developed method. The repeatability of the method was established by preparation and measurement of peak area of this solution six times.
Intra-day and Inter-day precision was determined by repeating this procedure three times on the same day at different time intervals and on different days respectively.
Stress testing of TEM and HCT individually
10 mg of TEL was weighed and subjected to following stress conditions as shown in Table 1 in different 10 ml volumetric flasks. 2 ml of the above solution was diluted to 10 ml with methanol to achieve concentration of 0.2 μg/μl for HCT. 11 μl of this solution was applied to get a concentration of 2.2 μg/ band. The % drug degradation was calculated from calibration curve. Similarly, HCT was stressed and diluted as described above. 8 μl of this solution was applied to get a concentration of 1.6 μg/ band. The amount of drug degraded was calculated from calibration curve.
| S. No. | Stress Condition | Stress reagent | Temperature/ time |
|---|---|---|---|
| 1 | Acid | 1 N HCl | 80°C/8 h |
| 2 | Base | 1 N NaOH | 80°C/8 h |
| 3 | Neutral | Distilled water | 80°C/8 h |
| 4 | Oxidation | 5% H2O2 | 80°C/8 h |
| 5 | Photolytic | Short and long wave UV radiations | R.T./28 h |
| 6 | Thermal | Heat in oven | 80°C/8 h |
Table 1: Stress test conditions performed for assessing stability of TEM and HCT separately and in combination
Stress testing of HCT and TEM in combination
To the mixture of 45 mg of TEL and 14 mg of HCT, stressing reagent was added to make up the volume to 25 ml. Various stress conditions used are given below in Table 1. 1 ml of the above solution was diluted to 10 ml with methanol resulting in the concentration of 0.18 μg /ml of TEL and 0.056 μg /ml of HCT. 8 μl of this solution was applied on the TLC plate to get concentration of 1.44 μg /band of TEL and 0.45 μg /band of HCT. % degradation of each drug was calculated using calibration curve.
Results and Discussion
The objective of this study was quantitative assessment of TEL and HCT in presence of their degradation products. The relative rates of degradation of both drugs under various stress conditions were compared. A simple, economic and validated HPTLC method was developed for the simultaneous estimation of TEM and HCT from tablet formulation, employing mobile phase of Ethyl acetate: 1,4 dioxane: Methanol: Ammonia (15: 1.5: 3: 1.5 v/v/v/v) with UV detection at 233 nm. The overlay obtained was in the ratio of 3: 1 concentration of TEL and HCT as in the dosage form. 233 nm was selected so as to achieve optimum response for HCT which is present in lower concentration in the dosage form.
Analysis of tablet formulation
The results of analysis of tablet formulation are given in Table 2. The assay was found to be 97.54%-102.88% w/w for TEL and 98.48%-102.6% w/w for HCT.
| S no. | Peak Area TEL | Conc TEL (µg/band) | Peak Area HCT | Conc HCT (µg/band) | % Assay TEL | % Assay HCT |
|---|---|---|---|---|---|---|
| 1 | 2262 | 1.079 | 2439 | 0.338 | 99.98 | 100.72 |
| 2 | 2210 | 1.053 | 2394 | 0.331 | 97.54 | 98.49 |
| 3 | 2314 | 1.106 | 2478 | 0.345 | 102.42 | 102.67 |
| 4 | 2253 | 1.075 | 2469 | 0.343 | 99.56 | 102.22 |
| 5 | 2324 | 1.11 | 2394 | 0.331 | 102.88 | 98.48 |
| 6 | 2288 | 1.093 | 2478 | 0.345 | 101.2 | 102.67 |
| MEAN | 100.59 | 100.88 | ||||
| SD | 1.985 | 1.986 | ||||
| RSD | 1.974 | 1.96 | ||||
Table 2: Assay of TEL and HCT in the marketed formulation
Method validation
The method was validated as per ICH guidelines.
Linearity
Linearity was assessed by visual inspection of a plot of concentration versus the peak area. The graphs were found to be linear in the range of 0.18-5.76 μg / band (r2=0.999) for TEL and 0.056-1.6 μg/ band (r2=0.999) for HCT. Method linearity was proved from regression coefficients and from scatter which do not show any tendency.
Limit of detection and limit of quantitation
The LOD and LOQ for TEL and HCT were found to be 0.034 and 0.12 μg/band for TEL while it was 0.0063 and 0.019 μg/band for HCT respectively. The lower value of limit of detection indicates sensitivity of the method.
Specificity
The chromatogram of formulation showed only two peaks for TEL and HCT (Figure 1), indicating that there is no interference of the excipients of the formulation. It was also proved from peak purity data as shown in Table 1.
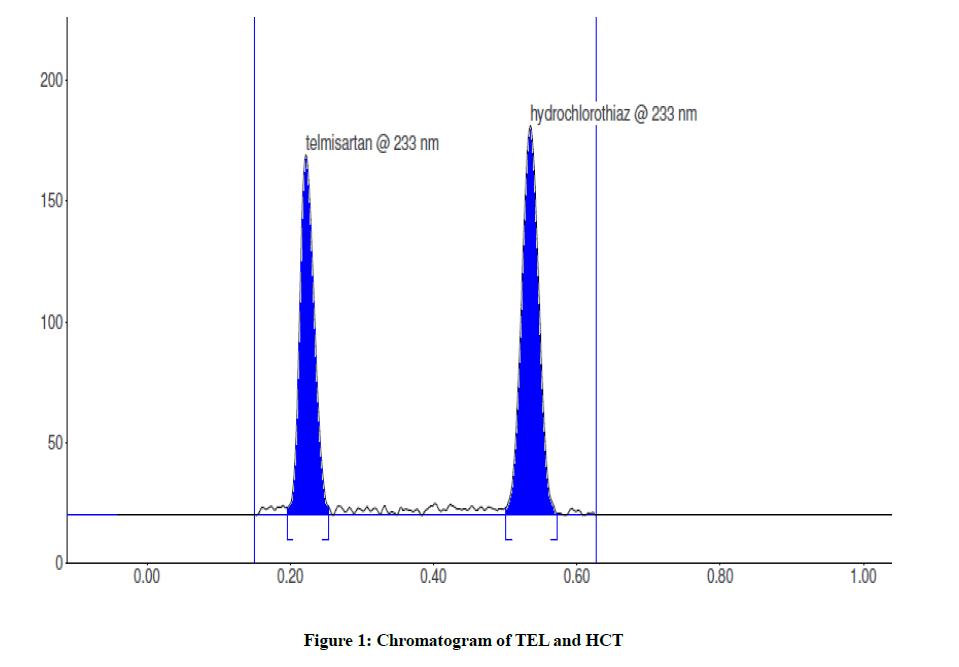
Figure 1: Chromatogram of TEL and HCT
Accuracy
The % recovery was found to be in the range of 98.5%-101.6% w/w for both drugs.
Precision
The repeatability of sample application and measurement of peak area were expressed in terms of % RSD and was found to be less than 2%. Precision of the method was assessed in terms of intra-day and inter-day precision as per the recommendations stated in the ICH guidelines. The %RSD of peak area for Intra-day precision was thus found to be 0.5678 and 0.8956 for TEL and HCT respectively. The %RSD of peak area for Inter-day precision was found to be 1.79 and 1.68 for TEL and HCT respectively as shown in Table 3.
| Sample stock no | TEL | HCT | |||||
|---|---|---|---|---|---|---|---|
| Peak area | Mean | S.D. | % RSD | Peak area | Mean | S.D. | |
| 1 | 2289 | 2307 | 32.92 | 1.43 | 2398 | 2405 | 44.91 |
| 2287 | 2453 | ||||||
| 2345 | 2364 | ||||||
| 2 | 2312 | 2265.3 | 44.6 | 1.97 | 2377 | 2423.3 | 40.13 |
| 2223 | 2447 | ||||||
| 2261 | 2446 | ||||||
| 3 | 2357 | 2306 | 44.6 | 1.94 | 2358 | 2388 | 44.39 |
| 2274 | 2367 | ||||||
| 2287 | 2439 | ||||||
| Mean | 2292.7 | 41.1 | 1.79 | Mean | 2405.44 | 40.42 | |
Table 3: Interday precision on the method
Stress testing of TEL under various conditions
In order to establish difference in the extent of degradation of the drugs under varied stress conditions, degradation was studied for individual drug. A representative chromatogram obtained after stress testing of TEL is shown in Figure 2. The drug was found to undergo degradation faster under oxidative conditions as compared to all other conditions (Table 4). This may be due to oxidation of hydrocarbon chains present on the aromatic rings. TEL was found to be stable under photolytic and thermal conditions. The degradation products were not found at the Rf value of HCT.
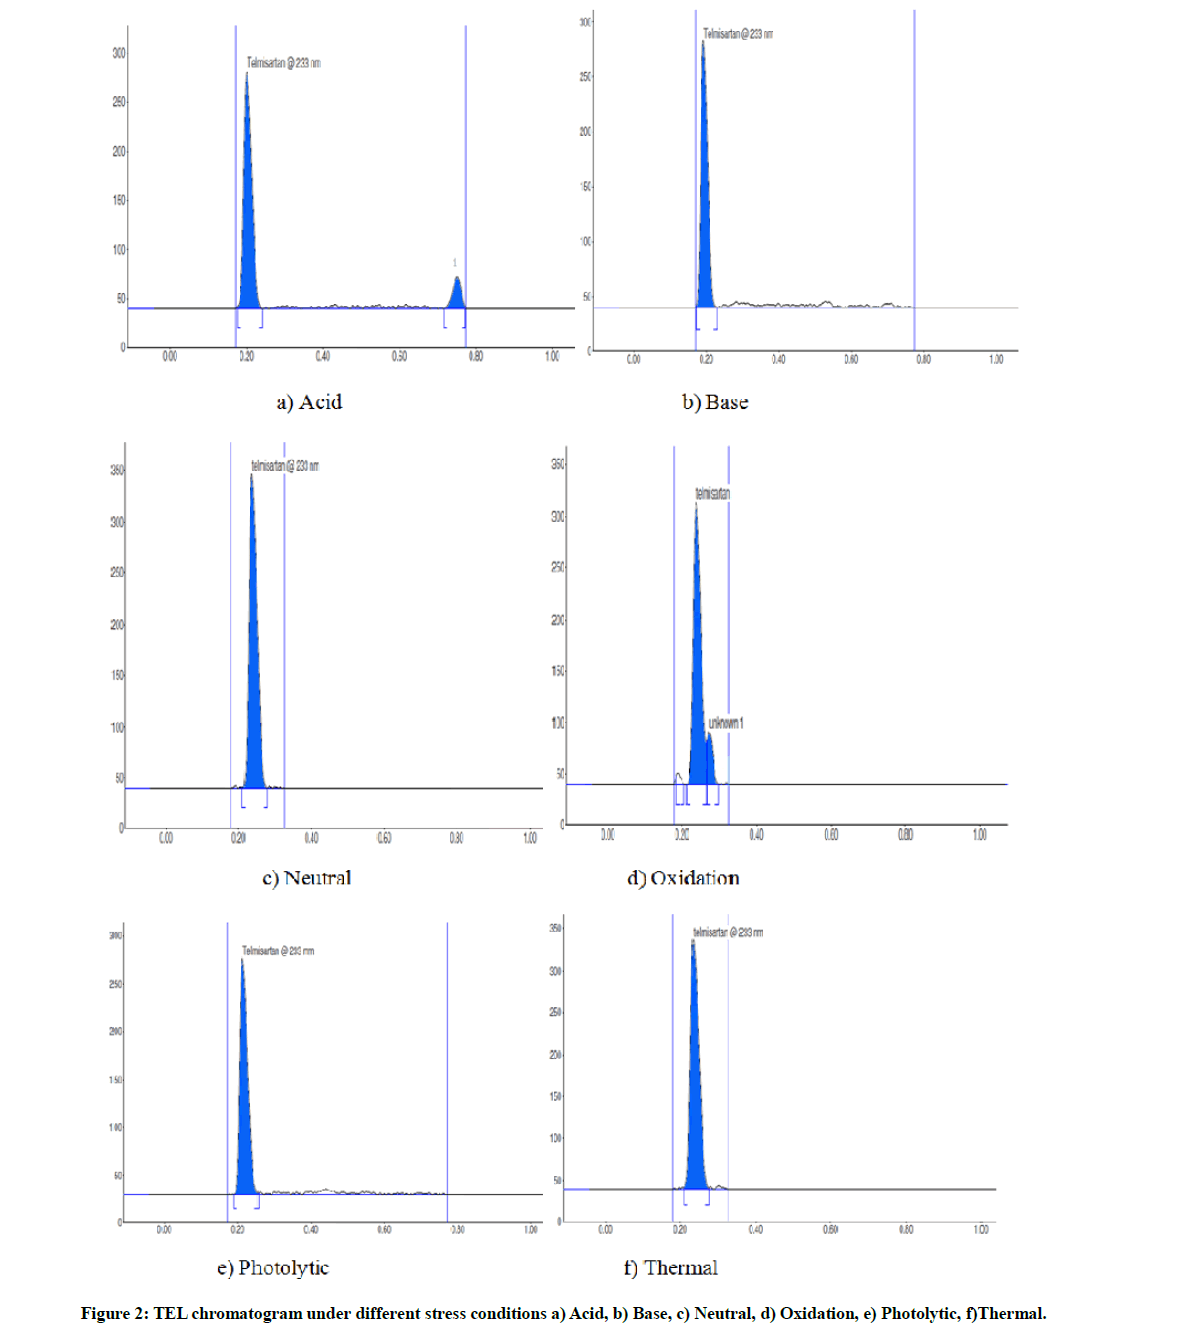
Figure 2: TEL chromatogram under different stress conditions a) Acid, b) Base, c) Neutral, d) Oxidation, e) Photolytic, f)Thermal.
| Stress conditions | Peak area | Concentration left µg /band | % Drug left | % Degradation | No. of chromophoric degradation products | Rf Values of DP |
|---|---|---|---|---|---|---|
| Acid | 4037.5 | 1.97 | 91.61 | 8.38 | 1 | 0.75 |
| Base | 4240.8 | 2.08 | 96.37 | 3.62 | Nil | - |
| Neutral | 4039.3 | 1.97 | 91.65 | 8.34 | Nil | - |
| H2O2 (Oxidation) | 3746.1 | 1.83 | 84.77 | 15.22 | 1 | 0.27 |
| Thermal | 4392 | 2.15 | 99.92 | 0.07 | Nil | - |
| Photolytic | 4386 | 2.15 | 99.77 | 0.22 | Nil | - |
Table 4: Degradation of TEL and number of chromophoric degradation products formed.
Stress testing of HCT under various conditions
A representative chromatogram obtained after stress testing of HCT is shown in Figure 3. The drug was found to undergo degradation under oxidative conditions as compared to all other conditions (Table 5). Due to oxidation, HCT was found to give three chromophoric degradation products. In case of acidic, basic and neutral hydrolysis, it has produced one chromophoric degradation product. The degradation products were not found at the Rf value of TEL.
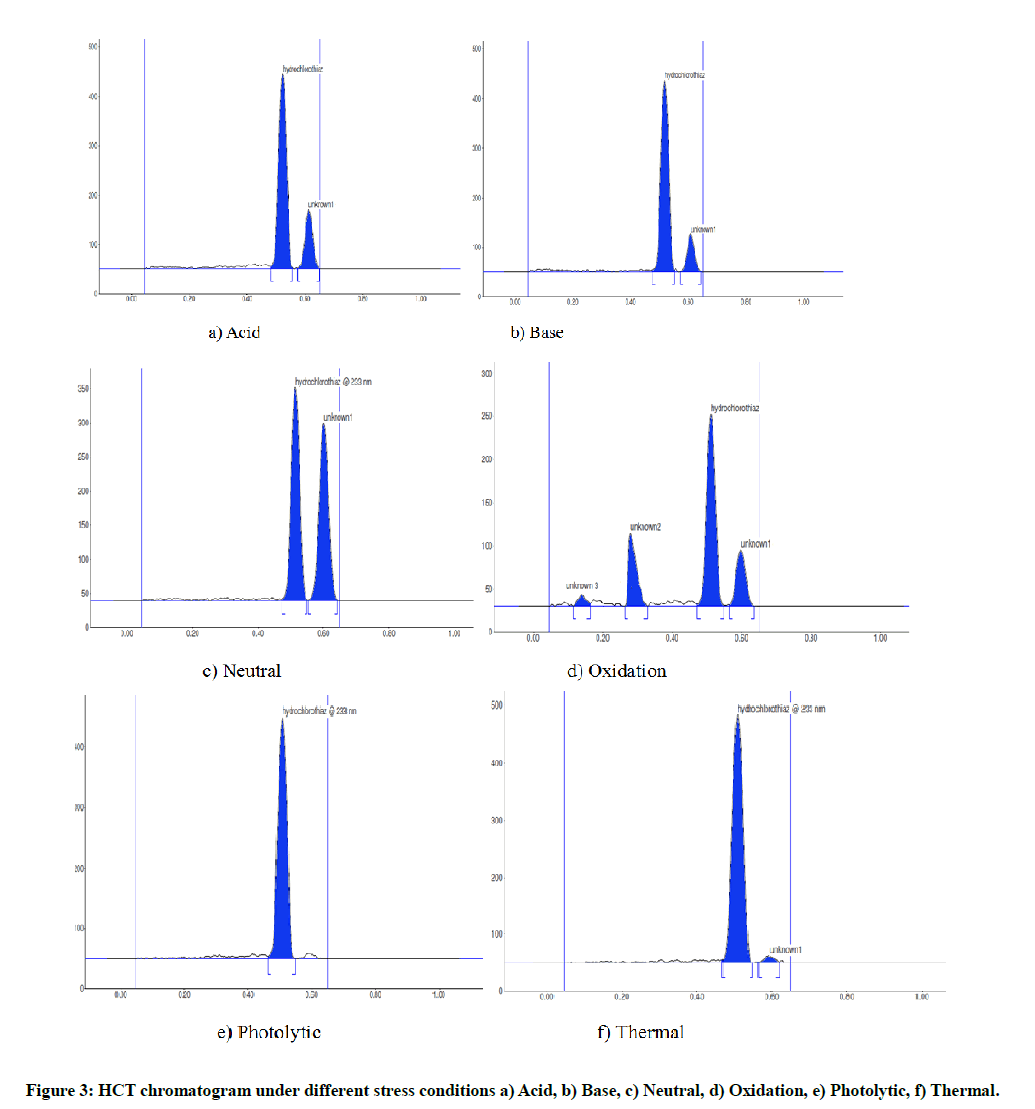
Figure 3: HCT chromatogram under different stress conditions a) Acid, b) Base, c) Neutral, d) Oxidation, e) Photolytic, f) Thermal.
| Stress Condition | Peak area | Concentration left µg /band | % Drug left | % Degradation | No. of chromophoric degradation products | Rf Values of DP |
|---|---|---|---|---|---|---|
| Acid | 9269.6 | 1.48 | 92.69 | 7.3 | 1 | 0.57 |
| Base | 9039 | 1.44 | 90.28 | 9.71 | 1 | 0.61 |
| Neutral | 6912 | 1.088 | 68 | 31.9 | 1 | 0.6 |
| H2O2/Oxidation | 4788 | 0.73 | 45.75 | 54.2 | 3 | 0.14, 0.26, 0.6 |
| UV | 9953 | 1.59 | 99.85 | 0.14 | Nil | Nil |
| Photolytic | 9745 | 1.56 | 97.67 | 2.32 | Nil | Nil |
Table 5: Degradation of HCT and number of chromophoric degradation products formed.
Stress testing of HCT and TEL under various conditions
A representative chromatogram obtained after stress testing of HCT and TEL in combination as proposed in the marketed formulation is shown in Figures 4 and 5. Both drugs were found to undergo degradation under oxidative conditions as compared to all other conditions. All degradation products were well resolved from drugs. This was confirmed from the peak purity analysis as shown in Table 6. The peak purity was confirmed by comparing the spectrum at three different regions of the band namely, peak start (s), peak apex (m) and peak end (e). The Rf values of the degradation products and drugs were significantly different.
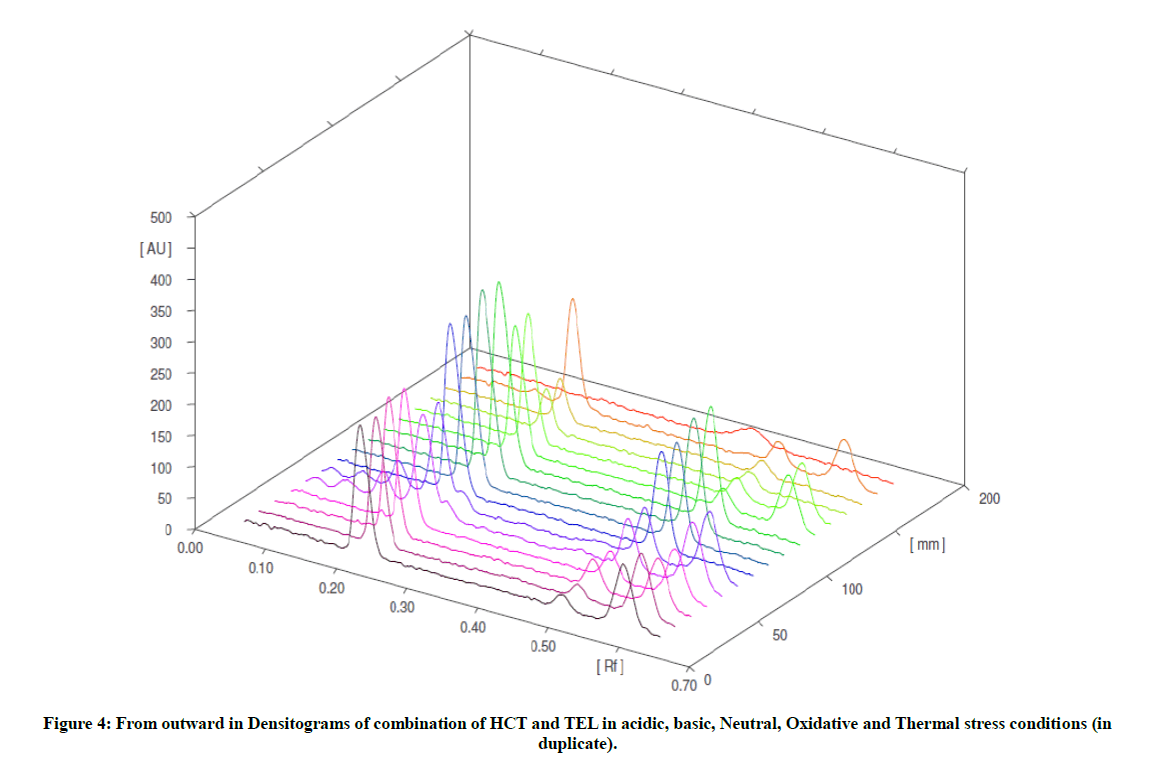
Figure 4: From outward in Densitograms of combination of HCT and TEL in acidic, basic, Neutral, Oxidative and Thermal stress conditions (in duplicate).
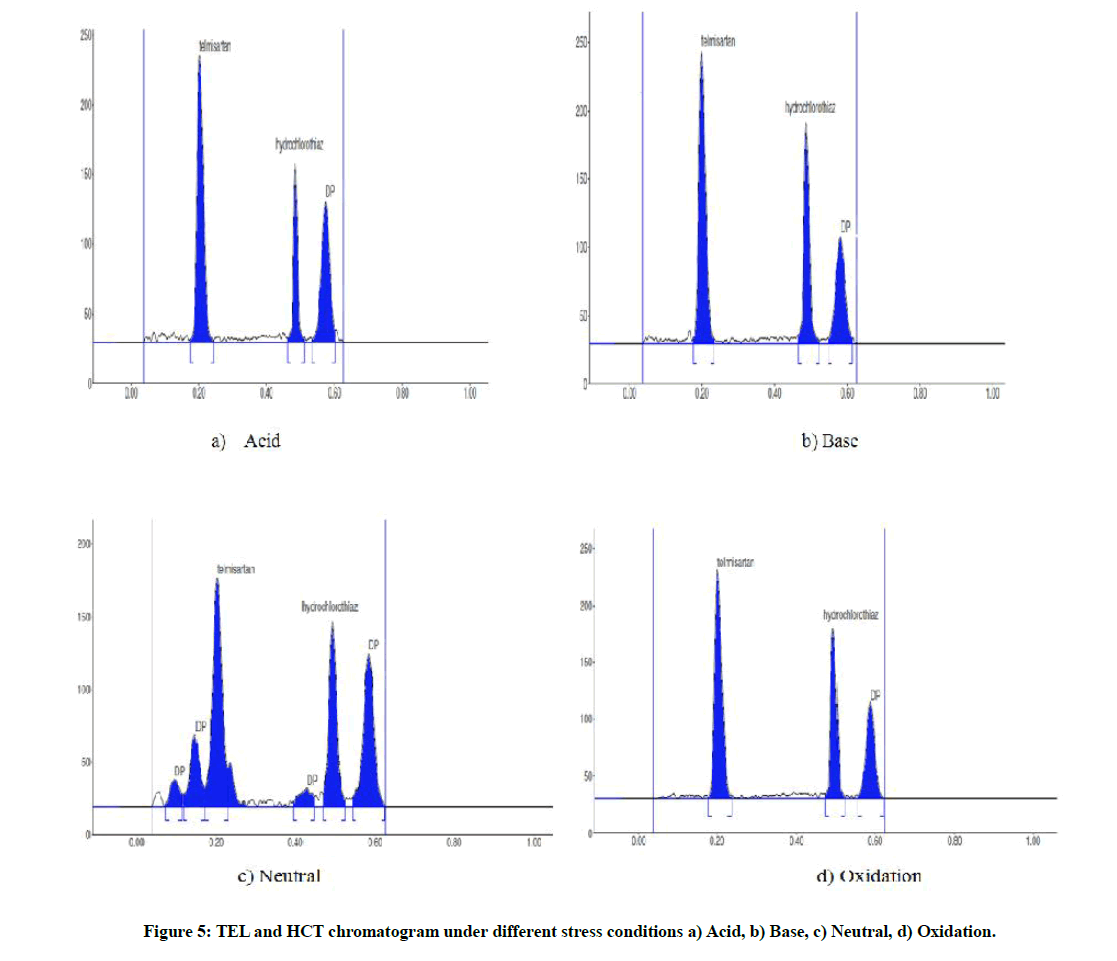
Figure 5: TEL and HCT chromatogram under different stress conditions a) Acid, b) Base, c) Neutral, d) Oxidation.
| Stress condition | Acid | Base | Neutral | H2O2 | Thermal | Photolytic | |
|---|---|---|---|---|---|---|---|
| TEM | Peak area | 2856.3 | 2901.4 | 2868.4 | 2734.7 | 2967.5 | 2948.9 |
| Conc (µg/band) | 1.38 | 1.4 | 1.38 | 1.31 | 1.43 | 1.42 | |
| % left | 95.8 | 97.4 | 96.3 | 91.6 | 99.7 | 99.1 | |
| % degradation | 4.11 | 2.52 | 3.69 | 8.39 | 0.2 | 0.85 | |
| Peak purity,rs,m | 0.999 | 0.999 | 0.999 | 0.998 | 0.999 | 0.999 | |
| Peak purity,rm,e | 0.999 | 0.999 | 0.999 | 0.995 | 0.999 | 0.999 | |
| HCT | Peak area | 1689.2 | 1665.8 | 1587.6 | 1601.6 | 2990.4 | 3008.2 |
| Conc (µg/band) | 0.21 | 0.2 | 0.192 | 0.198 | 0.43 | 0.43 | |
| % left | 80.8 | 83.6 | 77 | 44 | 95.7 | 96.4 | |
| % degradation | 19.19 | 16.34 | 22.97 | 55.97 | 4.25 | 3.58 | |
| Peak purity,rs,m | 0.999 | 0.999 | 0.999 | 0.998 | 0.999 | 0.999 | |
| Peak purity,rm,e | 0.999 | 0.999 | 0.999 | 0.995 | 0.999 | 0.999 | |
| No. of DP | 1 | 1 | 1 | 5 | Nil | Nil | |
| Rf Values of DP | 0.57 (DP of HCT) | 0.57 (DP of HCT) | 0.57 (DP of HCT) | 0.14, 0.26,0.60 (DP HCT) 0.19, 0.27 (DP TEM) |
- | - |
Table 6: Degradation of HCT and TEL in combination and number of chromophoric degradation products formed.
Conclusion
A simple stability indicating HPTLC method was developed for quantitative analysis of telmisartan and hydrochlorothiazide in pharmaceutical combination formulation. The results have ascertained methods precision, accuracy, linearity and specificity. Method can be used for routine analysis of formulations and to check the stability of both drugs either individually or in combination. HCT and TEM were found to undergo extensive degradation under oxidative conditions. They were found to have considerable stability under photolytic and thermal conditions. HCT was found to undergo hydrolysis irrespective of pH resulting in formation of one chromophoric product. Both drugs can be quantitatively estimated in presence of degradation products as no degradation product was found to coelute with both drugs as established from peak purity analysis.
Acknowledgement
Authors are very thankful to Patanjali yogpeeth for providing help to carry out this research work. Authors are also thankful to chairman of Shri Venkateshwara Group Dr Sudhir Giri for his support.
References
- Goodman and Gilmans, The pharmacological basis of Therapeutics, 10th (Edn.), Mc. Graw Hill publishing division, 833, 873.
- Indian Pharmacopoeia, Govt. of India, Ministry of health and family welfare, the controller and publication, 2010, II, 1452.
- V.M. Kumar, P.M. Muley, 2005, 4, 69-72.
- V. Bhavani, R. Siva, Int. J. Scientific Res. Publ., 2013, 3, 2250-3153.
- C. Prabhu, G.S. Subramanian, J. Planar. Chromat., 2007, 20(6), 477-481.
- L.V. Potale, M.C. Damle, A.S. Khodke, BotharaKG, Int J Pharm Sci Rev Res 2010, 2(2), 35-9.
- R.N. Rao, K.G. Prasad, J. Pharm. Biomed. Anal., 2011, 56, 471-478.
- F.D. Franolic, G.J. Lehr, J. Pharm. Biomed. Anal., 2001, 26, 651-663.
- A.E. Gindy, A. Ashour, J. Pharm. Biomed. Anal., 2001, 25, 171-179.
- P.S. Jain, M.K. Patel, J. Chromatogr. Sci., 2012, 50, 680-687.
- V.P. Rane, K.R. Patil, J. Chromatogr. Sci., 2010, 48, 595-600.
- A.S. Khodke, L.V. Potale, Pharm. Methods., 2010, 1, 39-143.
- G.B. Bhavar, V.A. Chatpalliwar, Indian J. Pharm. Sci., 2008, 70, 529-531.
- S.B. Wankhede, M.R. Tajne, Indian J. Pharm. Sci., 2007; 69:298-300.
- D.V. Psrchnp, A.R. Lakshmana, Int. J. pharm chem. Boil. Sci., 2012, 2, 382-391.
- T.S. Gopala, K. Nagaraju, Int. J. Drug. Dev. Res., 2011, 3, 362-368.
- P. Vani, S. Kalyana, Der Pharmacia Lettre, 2013, 5, 81-89.
- V. Subramanian, K. Nagappan, Int. J. Pharm. Pharm. Sci., 2013, 5, 0975-1491.
- L.I. Bebawy, S.S. Abbas, Farmaco., 2005, 60, 859-867.
- ICH guidelines Q2A (R1), Validation of Analytical procedures: Text and Methodology, 2005.


