Research Article - Der Pharma Chemica ( 2018) Volume 10, Issue 7
The Relevance of Adsorption Mechanism on Spectrometric Colour Removal: Investigation of Optimum Operation Parameters
Onukwuli OD1*, Obiora-Okafo IA2 and Omotioma M3
1Department of Chemical Engineering, Nnamdi Azikiwe University, Awka, Nigeria
2Department of Chemical Engineering, Madonna University, Elele, Nigeria
3Department of Chemical Engineering, Madonna University, Elele, Nigeria
- *Corresponding Author:
- Onukwuli OD
Department of Chemical Engineering
Nnamdi Azikiwe University
Awka, Nigeria
Abstract
A recent improvement in the utilization of natural biopolymers in coagulation process has been on-going. The adsorption performances of polymer coagulants were studied for colour removal from the aqueous dye. The proximate compositions and surface morphologies of the coagulants were investigated using standard official methods of analysis and Scanning Electron Microscopy (SEM), respectively. Effects of the process parameters including pH, coagulant dosage, Initial Dye Concentration (IDC), settling time, and temperature were tested and their optimum conditions and ranges experimentally determined. The optimum operating conditions established were pH 2, the dosage of 800 mg/l, dye concentration of 20 mg/l, settling time of 420 min, and 303 K. The decreasing order of optimum coagulant removal was VUC > MOC > TOC > VSC > BEC with maximum efficiencies of 93.5%, 91.9%, 90.7%, 88.8%, 73.3%, respectively. Adsorption of particles on the polymer surfaces occurred mostly as a mono-molecular layer following chemisorption mechanism. The agreement of pseudo-second order and Elovich model confirmed the coagulation-flocculation/adsorption kinetics behaving more as a second-order rate process. The precursors’ extract have potentials for application as efficient coagulants while showing significant component of the adsorptive phenomenon.
Keywords
Coagulation-flocculation, Adsorption studies, Crystal ponceau 6R (AR 44), Colour removal, Organic biopolymers.
Introduction
In present studies, Coagulation-flocculation process has been found very efficient in reducing or eliminating organic and inorganic contaminants from different industrial wastewater sources [1,2]. These wastewaters are from the industries such as dye and pigment industries, textile industries, pulp and paper industries, pharmaceutical industries, and refinery industries. Colour is an organic pollutant found in most wastewater sources but of higher content in textile, paper, and pigment industrial wastewaters, and has been effectively removed using coagulation-flocculation technique [2,3].
Studies on improving the performance of coagulation-flocculation process have attracted lots of attention. The efficiency of the process has been affected largely by the type of coagulant used. A good choice of coagulant enhances the particles aggregation for larger flocs formation capable of rapid settling through charge neutralization, enmeshment in a precipitate, double-layer compression, inter-particle bridging, electrostatic patch, and adsorption mechanisms.
Due to the present era of increasing quest for sustainable development, research on wastewater treatment is been refocused on the use of natural organic polymers (NOPs) as coagulants in wastewater treatment [4]. The recent adoption of natural coagulants is due to their advantages such as abundant source, cost-effective, no pH alteration in water, environment-friendly, multifunction, and biodegradable in water purification. NOPs may be anionic, cationic or non-ionic in nature and are collectively termed polyelectrolyte due to their ionic nature. A comprehensive account of water-soluble polyelectrolyte coagulants has been given by Bolto and Gregory [5].
Mechanisms of particles flocculation by using natural polymers could be described by charge neutralization, sweep-flocculation, and interparticle bridging [5]. These mechanisms are all dependent on the polymer adsorption of particles on the polymer surfaces. Polymer adsorption occurs when there is some affinity between polymer segments and particle surfaces. Adsorption interactions are possible by electrostatic interaction, hydrogen bonding and ionic bonding [5]. Electrostatic interaction occurs when polyelectrolytes with a charge opposite to that of the surface (cationic polyelectrolytes on negative surfaces) absorb strongly, simply because of attraction between opposite charge ionic groups. Hydrogen bonding occurs when polymers adsorb on surfaces with suitable hydrogen bonding sites. Ionic bonding occurs when anionic polyelectrolytes are adsorbed on negatively-charged surfaces, despite electrostatic repulsion.
The efficacies of using Cowpea seed (Vigna unguiculata), Fluted pumpkin seed (Telfairia occidentalis), Black Timber seed (Brachystegia eurycoma), Bambara nut seed (Vigna subterranean) and Horseradish seed (Moringa oleifera), as plant-based cationic coagulants have been studied here. The use of these precursors was established because animal-based precursors are expensive and difficult in sourcing [6]. Crude extract from the seeds contain a soluble cationic protein and some of them have shown the ability to act as a natural polymeric coagulant [7-12].
Therefore, the potentials and performances of bio-polymers were studied for colour removal from AR 44 dye. Physicochemical characterizations of the precursors were conducted. Comprehensive factor interactions on the coagulation-flocculation process were investigated and their optimum conditions established. The adsorption studies of the polymer–particles interactions were examined extensively following adsorption capacity, adsorption isotherms and adsorption kinetics.
Materials and Methods
Preparation of coagulants
Sample 1: Vigna unguiculata
Sample 2: Telfairia occidentalis
Sample 3: Brachystegia eurycoma
Sample 4: Vigna subterranean
Sample 5: Moringa oleifera
Coagulant precursors were prepared as follows:
Dried seeds of Vigna unguiculata were purchased from local market of Enugu city.
Matured pods containing Telfairia occidentalis seeds were purchased from local market of Enugu city. The seeds were removed from the pod, dried under the sun for 5 days, and the external shells were removed.
Wet seeds of Brachystegia eurycoma were purchased from local market of Enugu city. The seeds were sun-dried for 5 days.
Dried seeds of Vigna subterranean were purchased from local market of Enugu city.
Moringa oleifera seed pods were purchased from local market of Enugu city. The seeds were de-hulled and sun-dried.
Matured seeds showing no signs of discolouration, softening or extreme desiccation were all selected from the five samples. The dry seeds were ground to fine powder (63-600 μm) using an ordinary food processor (Model BL 1012, Khind) to achieve solubilization of active ingredients. The seed powders were then ready for protein extraction of the active components.
Extraction of active component
The active component from coagulants was extracted by adding 2 g of powdered samples to 100 ml distilled water. A magnetic stirrer (Model 78HW-1, U-Clear England) stirred the stock solution vigorously for 20 min at room temperature to promote water extraction of the coagulant proteins. Filter paper (What. no. 42, 125 mm diameter) filtered the suspension. The filtrate portions were used as coagulant at required dosages. Fresh solutions were prepared daily and kept refrigerated to prevent any ageing effects (such as a change in pH, viscosity and coagulation activity). Before each experiment, solutions were shaken vigorously and used immediately for each sequence of the experiment.
Characterization of the coagulants
Yield, bulk density, moisture content, ash content, protein content, fat content, fibre content and carbohydrate content of the seed powders were determined by the standard official methods of analysis as reported elsewhere [13]. Surface structures and morphologies of the seed powders were studied using Scanning Electron Microscope (SEM), supplied by Phenom Prox., world Eindhoven, Netherlands.
Decolourization procedures
Preparation of dye simulated wastewater and absorption spectrum determination
AR 44, water-soluble dye was provided by May & Baker, England with the molecular structure as shown in Figure 1. The dye characteristics are summarized in Table 1. Dye with commercial purity was used without further purification. The absorption spectrum of the dye was obtained by dissolving 1000 mg/l of AR 44 in distilled water. A sample of the solution was scanned against the blank (distilled water) in the range of 250 – 850 nm using UV-Vis spectrophotometer (Shimadzu, Model UV-1800). The maximum wavelength (λmax) of 511 nm was obtained as shown in Figure 2. A stock solution of 1000 mg/l of dye was prepared by dissolving accurately weighed amounts of AR 44 dye in separate doses of 1 l distilled water. The desirable experimental concentrations of 10-100 mg/l were prepared by diluting the stock solution with distilled water when necessary. The calibration curve analysis was used to accurately determine the colour concentrations (mg/l) by tracing the absorbance values. The use of spectrophotometric method establishes an accurate method for determining the colour concentrations in aqueous solution [14].
| Property | Data |
|---|---|
| Chemical name | Crystal Ponceau |
| Chemical formula. | C20H12N2 O7 S2 Na2. |
| Molecule weight (g/mol) | 502.43 |
| CAS number | 2766 -77 - 0 |
| EC number | E 126 |
| UV/Visible absorbance | Max (water): 511 +6nm |
| C.I number | 16250 |
| Class | AZ0 |
| C.I name | Acid Red 44. |
| Common name | AR 44 |
Table 1: Physical properties of AR 44 dye
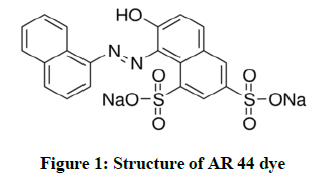
Figure 1: Structure of AR 44 dye
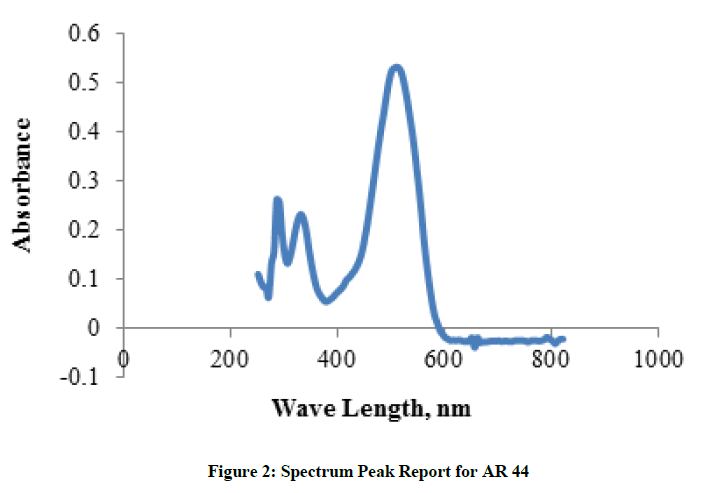
Figure 2: Spectrum Peak Report for AR 44
Coagulation studies
A conventional jar test apparatus (Phipps and Bird, VA, USA) equipped with six beakers of 1 l capacity and six paddle stirrers was used to perform the coagulation-flocculation experiment. The jar test was conducted to evaluate the performances of the active agent extracted based on standard methods [15,16]. The procedure involved 4 min of rapid mixing at 100 rpm. The mixing speed was reduced to 40 rpm for another 25 min. The additional centrifuging (5000 rpm for 5 min) was performed to obtain clearer liquid for all samples before analysis. All the suspensions were left for settling (60-540 min). Supernatant samples were withdrawn (after settling) for absorbance analysis using UV-Vis spectrophotometer (752 W, China) at a set maximum wavelength of 511 nm. The preliminary experiments were conducted in order to establish the operating optimums. The final experiments were carried out at varying operating conditions as shown in Table 2. Colour concentration (mg/l ) measurement was determined by comparing absorbance to concentration on a calibration curve [17]. Buffered solutions as shown in Table 3 were prepared by the standards established according to the National Bureau of Standards (NBS, US) and standardized using a digital HANNA pH meter. The solution pH was adjusted to the desired value using 0.1 M HCl and 0.1 M NaOH. Coagulant dosages and dye concentrations were prepared by using standard dilution formula [14]. Solution temperatures were attained using magnetic stirrer with hot plate supplied by 78HW-1, U-Clear England. Removal efficiency was obtained according to Equation 1:
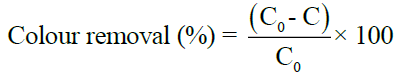 (1)
(1)
| Operational parameters | pH | Coagulant dosages (mg/l) | Dye concentration (mg/l) | Settling time (min) | Temperature (K) |
|---|---|---|---|---|---|
| Effect of pH | 2, 4, 6. 8, 10 and 12 | 600 | 20 | 420 | 303 |
| Effect of Coagulant dosage | 2 | 200, 400, 600, 800 and 1000 |
20 | 420 | 303 |
| Effect of Dye concentration | 2 | 200 | 20, 40, 60, 80 and 100 | 420 | 303 |
| Effect of Settling time | 2 | 200 | 20 | 60, 120, 180, 240, 300, 360, 420, 480 and 540. |
303 |
| Effect of Temperature | 2 | 200 | 20 | 420 | 303, 313, 323, 333, 343, 353 |
Table 2: Experimental conditions for decolourization process
| BUFFERS | PREPARATIONS |
|---|---|
| 2 | 25 ml of 0.2 M Potassium chloride was mixed with 6.5 ml of 0.2 M Hydrochloric acid, diluted and made up to 100 mL using distilled water. |
| 4 | 50 ml of 0.1 M Potassium hydrogen phthalate was mixed with 3.0 ml of 0.1 M Sodium hydroxide, diluted and made up to 100 ml using distilled water. |
| 6 | 50 ml of 0.1 M Potassium hydrogen phosphate was mixed with 5.6 ml of 0.1 M Sodium hydroxide, diluted and made up to 100 ml using distilled water. |
| 8 | 50 ml of 0.1 M with respect to both Potassium chloride and Boric acid was added to 3.8 ml of 0.1 M Sodium hydroxide, diluted and made up to 100 mL using distilled water. |
| 10 | 50 ml of 0.1 M with respect to both Potassium chloride and Boric acid was added to 43.7 ml of 0.1 M Sodium hydroxide, diluted and made up to 100 ml using distilled water. |
| 12 | 25 ml of 0.2 M Potassium chloride was mixed with 6.0 ml of 0.2 M of Sodium hydroxide, diluted and made up to 100 ml using distilled water. |
Table 3: Buffer solution preparations
Where C0 and C are the initial and final colour concentration (mg/L) in dye solutions before and after coagulation-flocculation treatment, respectively.
Polymer adsorption studies
The adsorption mechanism study shows the extent and ability of particle adsorptions on to polymer surfaces. Polymer adsorption chains mostly occur due to an attraction between the polymer segments and particle surfaces. The extent of adsorption depends greatly on the interaction of polymer segments with particle surfaces and particle concentration. The parameter widely used in adsorption processes to show the extent of surface interactions is the adsorption capacity (q) [4]. Adsorption capacity (qt) at any time was determined according to the following Equation (2):
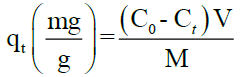 (2)
(2)
Where C0 is the initial contaminant concentration (mg/l), Ct is the contaminant concentration at time t in the bulk solution (mg/l), V is the volume of solution (l), and M is the coagulants mass (mg).
Adsorption isotherm theory
An isotherm shows the relationship of the distribution of adsorbate between the adsorbed phase and the solution phase equilibrium. The capacity of the polymers is described by its equilibrium adsorption isotherm. The purpose of the adsorption isotherms is to relate the particles concentration in the bulk solution and the number of particles adsorbed at the interface.
Langmuir model is based on the assumption that each site is capable of adsorbing one molecule, resulting in a monolayer (one molecule) thick over the entire surface [18]. The linear form of Langmuir isotherm is given as:
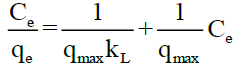 (3)
(3)
Where qmax is the maximum capacity (mg of contaminant/g of coagulants) for complete monolayer adsorption and KL (l/mg) is Langmuir adsorption constant. The essential characteristics of Langmuir equation can be expressed in terms of dimensionless separation factor, RL, defined as [19];
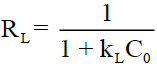 (4)
(4)
RL value implies the adsorption to be unfavourable (RL>1), linear (RL=1) favourable (0<RL<1), or irreversible (RL= 0). Freundlich model is based on sorption onto a heterogeneous surface of varied affinities [20]. The linear form of the isotherm is given as:
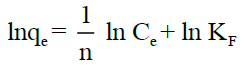 (5)
(5)
Where KF (mg/g (l/mg)1/n) is a Freundlich constant that indicates the sorption capacity of the polymer. n is a Freundlich adsorption order (dimensionless) that represents the parameter characterizing the quasi-Gaussian energetic heterogeneity of the adsorption surface [21].
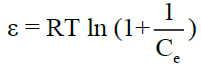
Temkin model was derived from Langmuir adsorption isotherm by inserting the condition that the heat of adsorption decreases linearly with surface coverage [22]. Temkin model is expressed in Eq. (6) as:
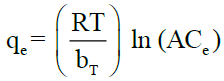 (6)
(6)
Where, RT/bT = B (J/mol), which is the Temkin constant related to the heat of sorption, whereas A (L/g) is the equilibrium binding constant corresponding to the maximum binding energy. R (8.314 J/mol K) is the universal gas constant and T (K) is the absolute solution temperature.
Dubinin-Radushkevich (D-R) model [23] is generally applied to express the adsorption mechanism with a Gaussian energy distribution over the heterogeneous surface. D-R isotherm has been used in the linear form of:
lnqe = ln qm- βε2 (7)
Where qe (mg/g) is the equilibrium solid phase concentration, qm is the theoretical saturated capacity, ε is the Polanyi potential given as:
 (8)
(8)
β is a constant related to the adsorption energy by the Eq. (9):
E = (2β)-1/2 (9)
Where E (sorption mean free energy which is the energy required to transfer one mole of the contaminant from infinity in solution to the surface of solid. R is the gas constant (8.314 Jmol-1K-1) and T is the temp (K).
Adsorption kinetics theory
Adsorption kinetic provides an invaluable insight into the rate controlling mechanism of adsorption processes which in turn governs mass transfer and the residence time [24]. The kinetic data were analyzed using pseudo-first order, pseudo-second order, Elovich and intra-particle diffusion model.
Lagergren proposed pseudo-first order kinetic equation [25]. In the form of:
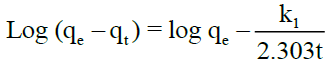 (10)
(10)
Where, qt is the amount of adsorbate adsorbed at time t (mg/g), qe the adsorption capacity at equilibrium (mg/g), k1 the Pseudo-first order rate constant (min-1), and t is the time (min). The value of the adsorption rate constant, k1, for the dye was determined from the plot of log (qe - qt) against t.
Pseudo-second order equation [26] predicts the particle behaviour over the whole range of adsorption with chemisorptions being the rate controlling step and it is represented by:
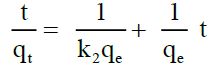 (11)
(11)
Where, k2 is the Pseudo-second order rate constant (gmg-1min-1). The linear plot of  versus t will give
 as the slope and
 as the intercept. The initial adsorption rate h (mg-1 min-1) at t = 0 is defined as follows [27]:
h = k2qe2 (12)
Elovich kinetic model [28], gave more insight into the chemisorption process. It is defined as:
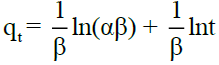 (13)
(13)
Where α (mgg-1min-1) is the initial sorption rate and β (gmg-1) is related to the extent of surface coverage and activation energy for chemisorptions. The value of  is indicative of the available number of sites for adsorption.
Intra-particle diffusion model [29] was calculated in order to gain insight into particle adsorption mechanisms and rate controlling steps affecting the kinetics of the process. The model is expressed as:
qt = k3t½ + C (14)
Where k3 is the intra-particle diffusion rate constant (mgg-1min-1/2) and C is the intercept. k3 and C can be evaluated from the intercept and slope of the plot of qt versus t½. The large value of C implies the greater effect of the boundary layer [30].
Validation of the Kinetic Models
The kinetic models were validated for suitability check on adsorption process using the normalized standard deviation, Δq (%) given by:
 (15)
(15)
Where df is the degrees of freedom of the fitting equation. The number of degree of freedom as follows N-np, where N is the number of data points and np is the number of parameters. qexp (mg/g) and qcal (mg/g) are the experimental and calculated adsorption capacities, respectively.
Results and Discussion
Characterization result
Proximate analysis
The proximate analyses of precursors were summarized in Table 4. The moisture contents show the ability of coagulants to absorb water and consequently, enhance surface adsorption of the particles. High crude protein contents recorded in all the precursors indicates the presence of protein, which is in agreement with the literature that the protein contents of the precursors are cationic polypeptides [7-11]. Fibre contents present established that the precursors were of an organic polymer with repeating small molecules that could extend as tails and loops when dispersed in water [5]. The particle attachment on the extended tails enhances particle adsorption because there are more surface sites available. The proximate results justify the use of these seed powders as a potential source of coagulant in this work.
| S. No. | Parameters | Values | ||||
|---|---|---|---|---|---|---|
| Vigna unguiculata (Cowpea) | Telfaria occidentalis (fluted pumpkin seed) | Brachystegia eurycoma (Black timber) | Vigna subterranean (Bambara nut) | Moringa oleifera seed | ||
| 1 | Yield | 11.5 | 38.4 | 28.31 | 14.6 | 32.68 |
| 2 | Bulk density (g/ml) | 0.299 | 0.354 | 0.235 | 0.241 | 0.425 |
| 3 | Moisture Content (%) | 9 | 12.58 | 7.25 | 10 | 5.02 |
| 4 | Ash content (%) | 3.48 | 1.52 | 3.48 | 2.97 | 2.12 |
| 5 | Protein content (%) | 25.14 | 55.09 | 19.77 | 18.15 | 39.34 |
| 6 | Fat content (%) | 0.53 | 17.17 | 10.53 | 6.3 | 19.47 |
| 7 | Fibre content (%) | 6.78 | 0.87 | 2.2 | 1.64 | 1.16 |
| 8 | Carbohydrate (%) | 55.07 | 12.77 | 56.76 | 60.94 | 32.89 |
Table 4: Proximate compositions determination of the coagulant precursor
SEM result
The SEM technique is used to analyse the surface morphology of the polymeric coagulants. Figure 3 shows micropores of different shapes and sizes. Observed too on the SEM images were rough surfaces. Particles could be adsorbed or attached themselves to the rough surfaces of polymer chains forming bridges or by electrostatic contacts. The pores and rough surfaces shown on the SEM images confirm that adsorption would play an important role in the colour removal process. The morphologies of the coagulants also possess the compact-net structures. The compact-net structure is more favourable in particles removal due to bridge aggregation formation among flocs and clogging of the particles on the adsorption sites.
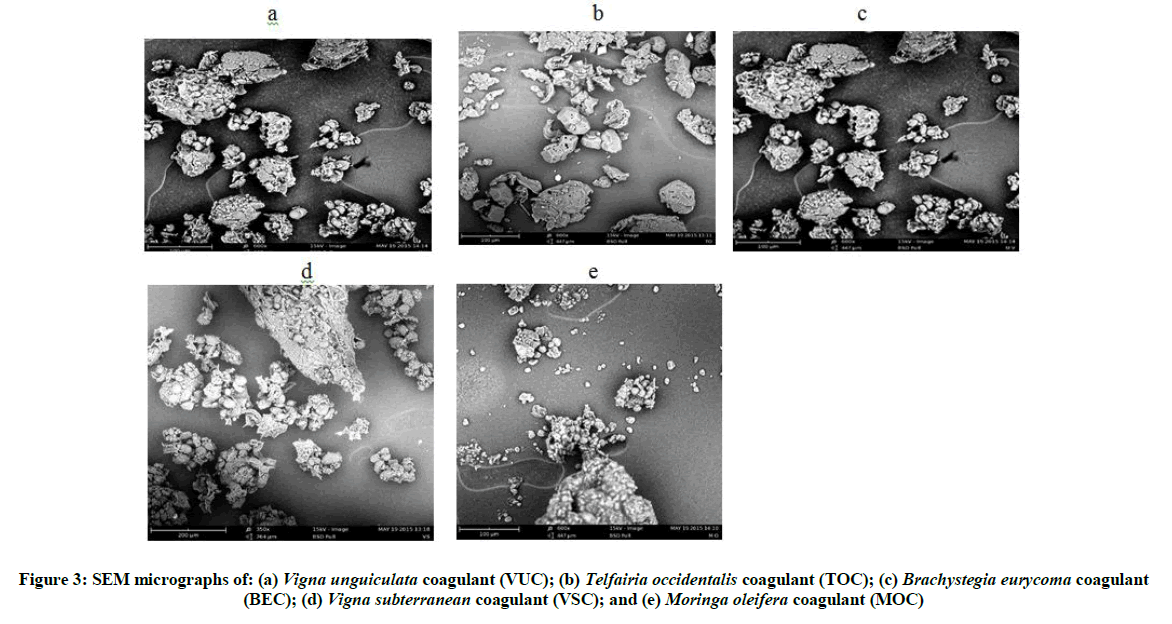
Figure 3: SEM micrographs of: (a) Vigna unguiculata coagulant (VUC); (b) Telfairia occidentalis coagulant (TOC); (c) Brachystegia eurycoma coagulant (BEC); (d) Vigna subterranean coagulant (VSC); and (e) Moringa oleifera coagulant (MOC)
Effects of Process Parameters in Decolourization Procedure
Effect of pH on the colour removal efficiency
pH plays an important role in the coagulation-flocculation process. An optimum pH must be established for an efficient operation. The higher removal efficiency was at low pH values as shown in Figure 4, indicating an influx of positively charged ions (H+). The highest removal efficiency was observed in MOC followed by VUC, TOC, VSC, and BEC giving efficiencies of 92.1%, 91.7%, 84.43%, 71.74%, and 62.91%, respectively. The charge on the hydrolysis products of dye particles and precipitation of polymeric hydroxides are both controlled by pH variations [31]. As functional group of the acid dye is anionic, hydrolysis products of the organic bio-polymers can neutralize the negative charges on dye molecules followed by flocculation mainly by polymer adsorption due to charge neutralization and bridging mechanisms. As pH value increases, natural organic compounds become more negatively charged (-ve) and polymer hydrolysis species become less positively charged, resulting in less adsorption tendency. At this point, charge reversal results in re-stabilization and flocs breaking which in turn reduces the removal efficiency. This was observed in Figure 5 at alkaline pH values which recorded less than 50% removal in all the coagulants. For these reasons, coagulation-flocculation of natural organic contaminants (NOC) in wastewaters is more efficient at low pH conditions. Similar results have been reported by [1,4,32].
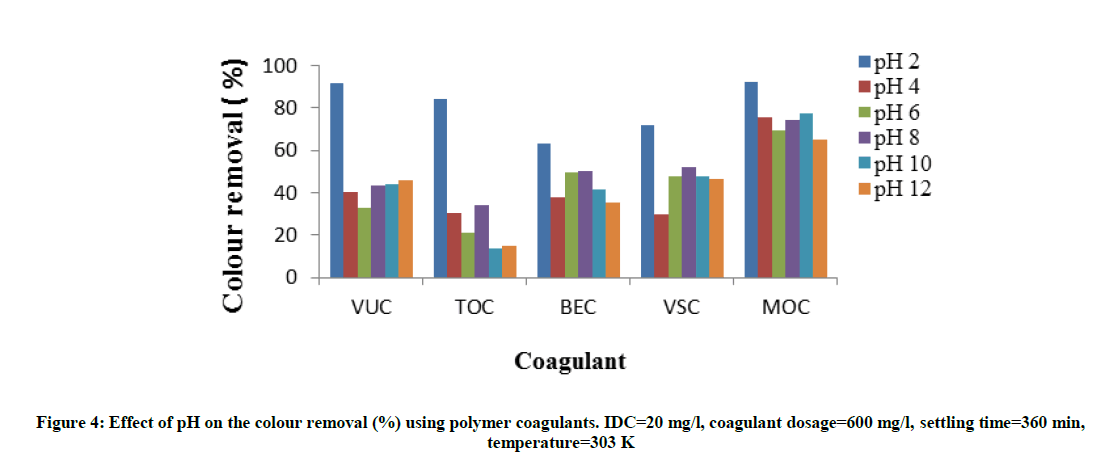
Figure 4: Effect of pH on the colour removal (%) using polymer coagulants. IDC=20 mg/l, coagulant dosage=600 mg/l, settling time=360 min, temperature=303 K
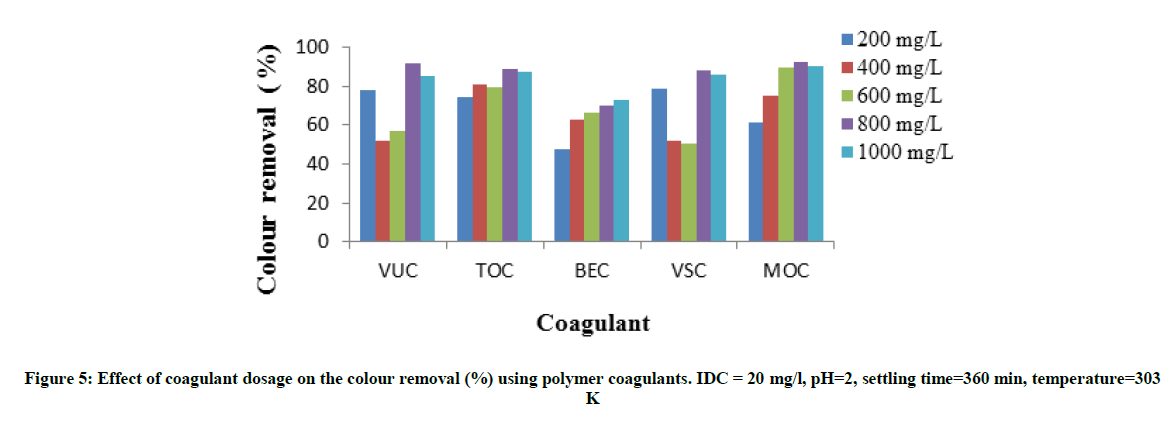
Figure 5: Effect of coagulant dosage on the colour removal (%) using polymer coagulants. IDC = 20 mg/l, pH=2, settling time=360 min, temperature=303 K
Effect of coagulant dosages on the colour removal efficiency
The result is shown in Fig. 5 indicates that the removal efficiencies increased with increasing dosages and the maximum removal efficiency was achieved at coagulant dosages 800 mg/l with MOC efficiency of 92.2% followed by VUC with the efficiency of 91.9%. The high removal efficiencies of >70% found in all the coagulants for the 800 mg/l dosages confirms it as an accurate amount of coagulants (+ve) which is required to destabilize the wastewater charge (-ve). Positive charge species of the bio-coagulant particles are responsible for removal of particles by charge neutralization, sweep-flocculation, and adsorption mechanisms. The use of cationic bio-polymers for coagulation-flocculation of negatively-charged colour particles is needed because strong adsorption affinity and neutralization of the particle charges could occur. With the increase of coagulant dosages, the removal efficiency steadily increased and no “re-stabilization zones” with negative dye removals were found even at the applied maximum dosage (800 mg/l). The coagulant apparently served as condensation nuclei and the dye particles were enmeshed as the precipitate was settled. The high dosages of the organic polymer could also give rise to chain bridging and adsorption mechanism [1].
Furthermore, sudden decrease in the removal efficiency at 1000 mg/L found in some coagulants was as a result of re-stabilization which might have occurred due to particle overdosing. Overdosing deteriorates supernatant quality which makes particles not to coagulate well. Also, excess polymer causes charge reversal.
Effect of initial dye concentration (IDC) on the colour removal efficiency
The concentrations of dye particles in the solution provide a driving force for all the mass transfer between the aqueous particles and solid surfaces. Dye concentrations also play an important role in the coagulation-flocculation process because it determines the extent of particle transfer. As observed in Figure 6, dye concentrations slightly have a significant effect on colour removal efficiency. A lower concentration gradient may be causing a slower transport due to a decreased diffusion coefficient or decreased mass transfer coefficients [33]. Highest efficiency was observed at 20 mg/l for BEC with removal efficiency of 96.04%. Excessive dye loading rate is not required for effective particle transfer as observed in Figure 6. In conclusion, as the influent concentration increased, dye loading rate increased and the concentration driving force increased for mass transfer.
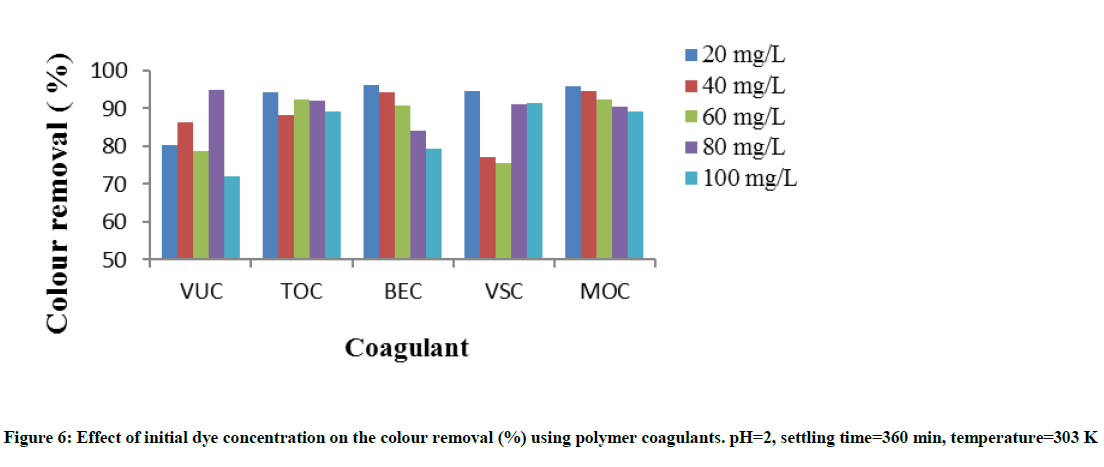
Figure 6: Effect of initial dye concentration on the colour removal (%) using polymer coagulants. pH=2, settling time=360 min, temperature=303 K
Effect of temperature on the colour removal efficiency
The removal efficiency decreases with increasing solution temperature as shown in Figure 7. The optimum solution temperature was at 303 K for all the coagulants. This could be as a result of high solution temperature breaking polymer chains, thus, reducing the surface adsorption sites of the coagulants. Also, high temperature reduces the flocs growth which in turn retards the coagulation-flocculation process.
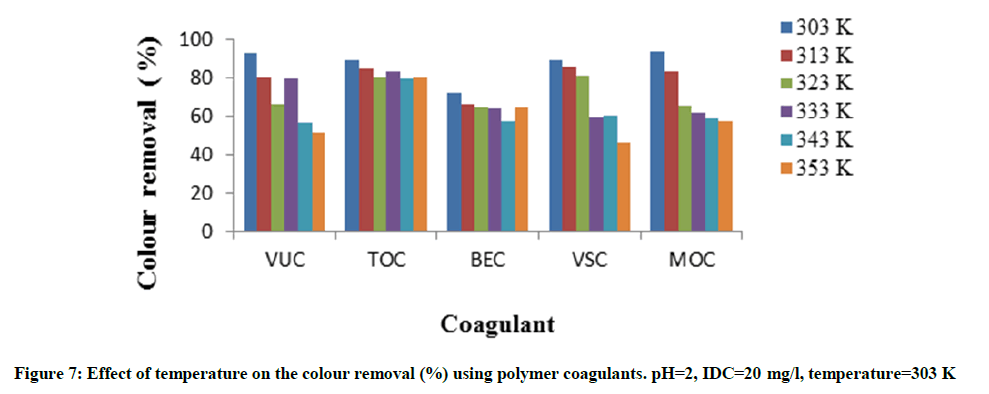
Figure 7: Effect of temperature on the colour removal (%) using polymer coagulants. pH=2, IDC=20 mg/l, temperature=303 K
Effect of settling time on the colour removal (%)
Coagulation-flocculation performance is usually evaluated through the time-dependent process as shown in Figure 8. Flocculation involves both interactions of coagulant hydroxide precipitate following hydrolyses reaction and contact with particles. This decrease in the concentration of particles coincides with the growth of aggregates. The highest reduction in concentration was observed in 800 mgVUC/l followed by 800 mgMOC/l resulting in removal efficiencies of 93.5% and 91.9%, respectively. This rapid reduction indicates a rapid coagulation-flocculation process, which was fast at onset resulting in over 65% removal at first 120 min. This is probably because of complex coagulation-flocculation mechanisms that may involve a net-like structure formation, which does not need a very long time. A gradual concentration reduction between 120-360 mins indicates that the limited available sites are becoming filled up. The concentrations did not vary significantly after 420 min showing that equilibrium has been achieved after 420 min and destabilization of the aggregate flocs could set in if the time is prolonged. At this point, the saturation of the active sites does not allow further particles flocculation.
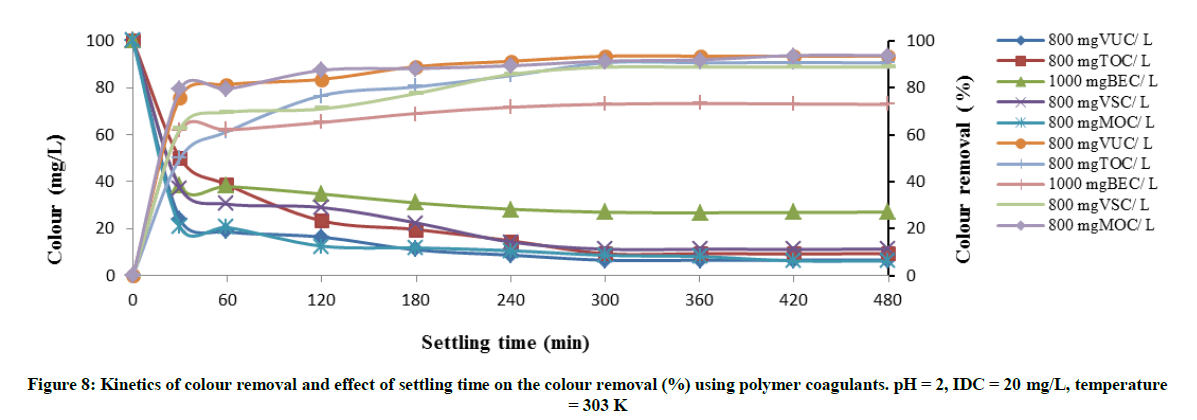
Figure 8: Kinetics of colour removal and effect of settling time on the colour removal (%) using polymer coagulants. pH = 2, IDC = 20 mg/L, temperature = 303 K
Polymer adsorption results
Polymer adsorption capacity for colour removal from dye wastewater
The sorption capacity as shown in Figure 9. shows that there was a rapid polymer adsorption during the first 60 min. The fast adsorption at the initial stage (0-60 min) may be due to the higher driving force (contaminants concentration) making the fast transfer of particles from the bulk of contaminant region to the polymer surface. The second portion is attributed to the gradual adsorption stage. The adsorption capacity remains constant after a constant time of about 360 min (i.e. equilibrium time). This shows that the time profile of the dye uptake is single, smooth, and continuous curve leading to saturation, suggesting the possible monolayer coverage of the particles on to the polymer surfaces.
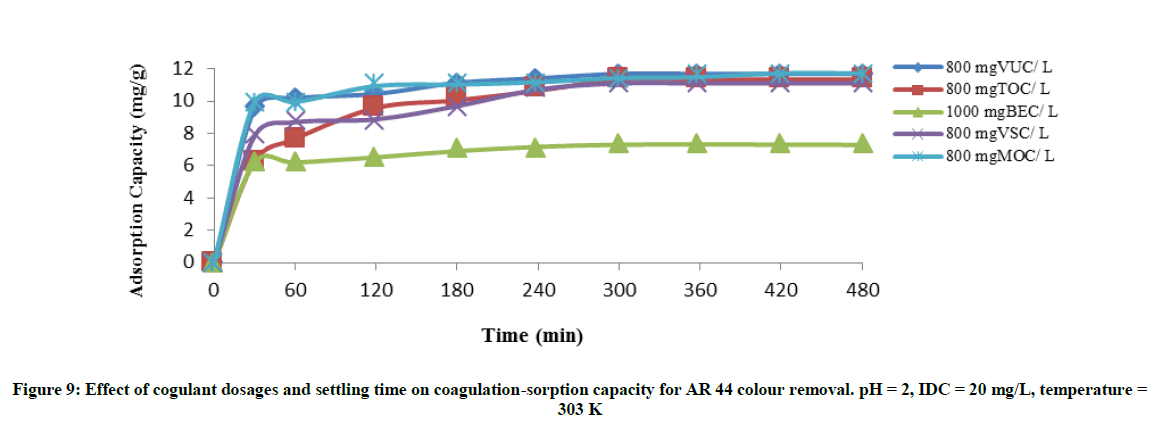
Figure 9: Effect of cogulant dosages and settling time on coagulation-sorption capacity for AR 44 colour removal. pH = 2, IDC = 20 mg/L, temperature = 303 K
Polymer adsorption isotherm
Figures 10-13 shows the Langmuir, Freundlich, Temkin, and D-R isotherm plots. Table 5 stated the summaries of the isotherm parameters and correlation coefficient (R2). From the table, the Langmuir model gave the highest correlation value of >0.991 as compared to other models. This indicates a monolayer adsorption and that adsorption of contaminant particles on the polymer surfaces occurred more according to the mechanism of chemisorption which shows that sharing of electrons between the adsorbate molecules and the polymer surface resulted in a chemical reaction. The value of RL obtained gave a favourable adsorption onto polymer surfaces.
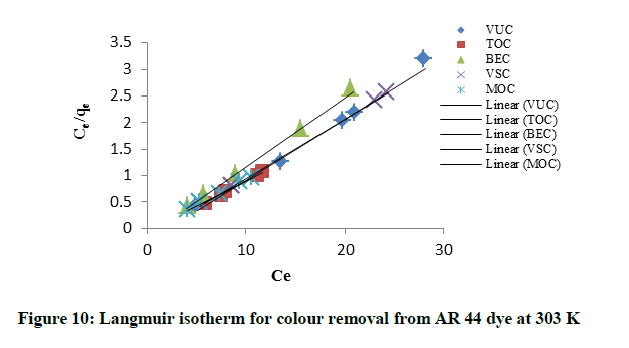
Figure 10: Langmuir isotherm for colour removal from AR 44 dye at 303 K
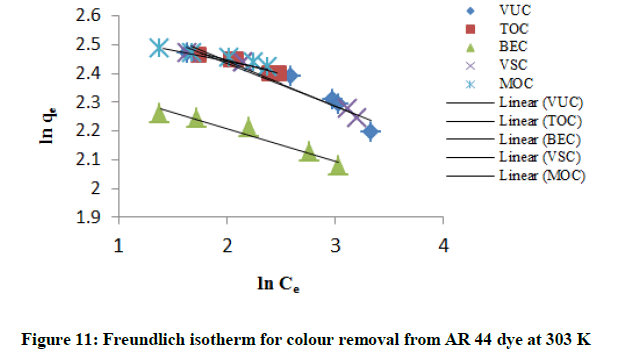
Figure 11: Freundlich isotherm for colour removal from AR 44 dye at 303 K
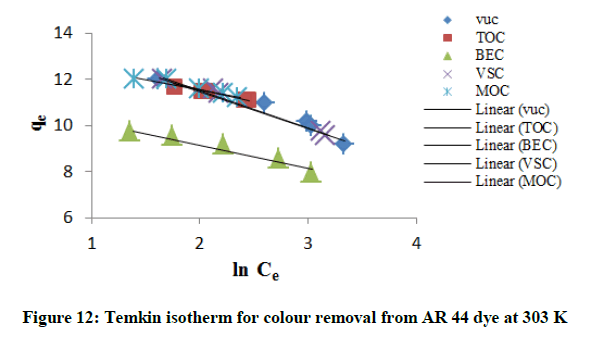
Figure 12: Temkin isotherm for colour removal from AR 44 dye at 303 K
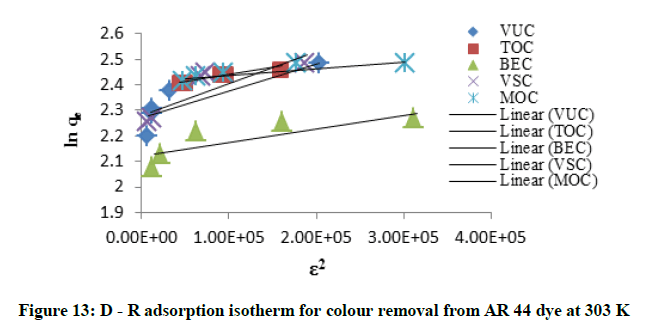
Figure 13: D - R adsorption isotherm for colour removal from AR 44 dye at 303 K
| Polymers | Langmuir | Freundlich | Temkin | D - R | ||||||||||
|---|---|---|---|---|---|---|---|---|---|---|---|---|---|---|
| qmax (mg l/mg) |
KL (l/mg) |
RL2 | RL | KF (mg/g (l/mg)1/n) |
n | RF2 | A (l/mg) | B | RT2 | qm (mol/g) | ß (mol2KJ-2) | RD-R2 | E (KJmol) |
|
| VUC | 10.89 | 0.44 | 0.991 | 0.022 | 15.44 | 6.67 | 0.919 | 9.80E-05 | 1.58 | 0.941 | 9.68 | 1.00E-06 | 0.701 | 707.11 |
| TOC | 10.42 | 1.33 | 0.999 | 0.008 | 13.93 | 10.8 | 0.988 | 2.70E-06 | 1.07 | 0.99 | 10.86 | 5.00E-07 | 0.912 | 1000 |
| BEC | 7.63 | 0.89 | 0.997 | 0.011 | 11.45 | 8.77 | 0.948 | 1.60E-05 | 1.01 | 0.958 | 8.32 | 5.00E-07 | 0.699 | 1000 |
| VSC | 8.93 | 0.58 | 0.999 | 0.017 | 15.72 | 6.41 | 0.971 | 1.30E-04 | 1.65 | 0.976 | 9.79 | 1.00E-06 | 0.718 | 707.11 |
| MOC | 10.75 | 2.02 | 0.999 | 0.005 | 13.36 | 13.5 | 0.98 | 2.00E-07 | 0.86 | 0.983 | 11.13 | 3.00E-07 | 0.878 | 1291 |
Table 5: Isotherm parameters for AR 44 adsorption on to bio-polymers at 303 k
Adsorption kinetics results
Pseudo-first-order kinetics, pseudo-second-order kinetics, Elovich kinetics and Intra-particle diffusion plots for colour removal were shown in Figures 14-17. The kinetic constant for the four models is summarized in Table 6. The correlation coefficients for the models were relatively low as compared with those for the pseudo-second-order model and also the experimental data shows a good agreement with the pseudo-second-order kinetic model data, with the normalized standard deviation, Δq (%) values ranging from 0.96% and 3.15%. The fitting of the pseudo-second-order kinetic model with a high coefficient of determination (R2 ≥ 0.993) further validates coagulation-flocculation process a second-order process, showing that the rate depends on the square of the particle concentration (Table 7). Thus, at high particle concentrations, flocculation rates become very high [5]. Elovich model agreement also gave a further insight into the adsorption-chemisorption process. This suggested that the overall rate of the adsorption process was controlled more by chemisorption which involved valence forces through electrons sharing between the polymer and contaminant. Intra-particle diffusion kinetic model is not the only controlling step because the linear plot of qt vs t1/2 did not pass through the origin [34]. The first portion of the intraparticle plot as shown in Figure 17 is the quick adsorption of the particles showing high adsorbate concentrations in the solution. The second portion demonstrated gradual uptake of particles were the intraparticle diffusion is rate limiting. The third portion shows the final equilibrium stage were intraparticle diffusion starts to diminish due to low adsorbate concentration in the solution.
| Coagulants dosages (mg) |
Pseudo-first-order kinetics | Pseudo-second-order kinetics | Elovich kinetics | ||||||||||
|---|---|---|---|---|---|---|---|---|---|---|---|---|---|
| qe, exp (mg/g) | qe, cal (mg/g) | KF1 (min-1) | R2 | Δq (%) | qe, cal (mg/g) | K2 (g/mg min) |
R2 | h (mg/g min) |
Δq (%) | a | ß | R2 | |
| 800 mgVUC/l | 11.68 | 4.78 | 0.009 | 0.963 | 20.881 | 12.05 | 0.0887 | 0.999 | 12.88 | 1.12 | 2214.88 | 1.183 | 0.965 |
| 800 mgTOC/l | 11.34 | 24.78 | 0.023 | 0.823 | 41.903 | 12.35 | 0.0303 | 0.999 | 4.62 | 3.15 | 1.843 | 0.518 | 0.971 |
| 1000 mgBEC/l | 7.3 | 1.95 | 0.01 | 0.911 | 25.911 | 7.52 | 0.0836 | 0.999 | 4.73 | 1.07 | 3362.83 | 2.028 | 0.925 |
| 800 mgVSC/l | 11.1 | 4.899 | 0.009 | 0.851 | 19.75 | 11.76 | 0.0395 | 0.997 | 5.46 | 2.1 | 14.77 | 0.759 | 0.933 |
| 800 mgMOC/l | 11.73 | 4.78 | 0.012 | 0.824 | 20.95 | 12.05 | 0.0853 | 0.999 | 12.39 | 0.96 | 21368.29 | 1.404 | 0.953 |
Table 6: Kinetics parameters for AR 44 adsorption on polymer coagulants at 303 k
| Intra-particle diffusion | |||
|---|---|---|---|
| Coagulants dosages (mg) | C | Kid (mgg-1 min1/2) | R2 |
| 800 mgVUC/l | 9.059 | 0.135 | 0.912 |
| 800 mgTOC/l | 5.489 | 0.305 | 0.899 |
| 1000 mgBEC/l | 5.731 | 0.08 | 0.914 |
| 800 mgVSC/l | 6.862 | 0.216 | 0.924 |
| 800 mgMOC/l | 9.337 | 0.116 | 0.934 |
Table 7: Intra-particle parameters for the AR 44 adsorption on polymer coagulants at 303 k
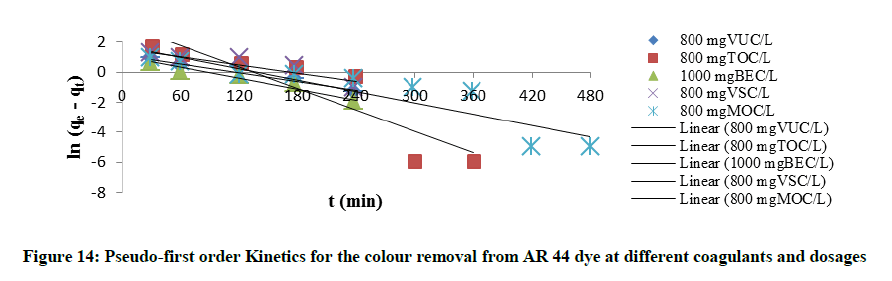
Figure 14: Pseudo-first order Kinetics for the colour removal from AR 44 dye at different coagulants and dosages
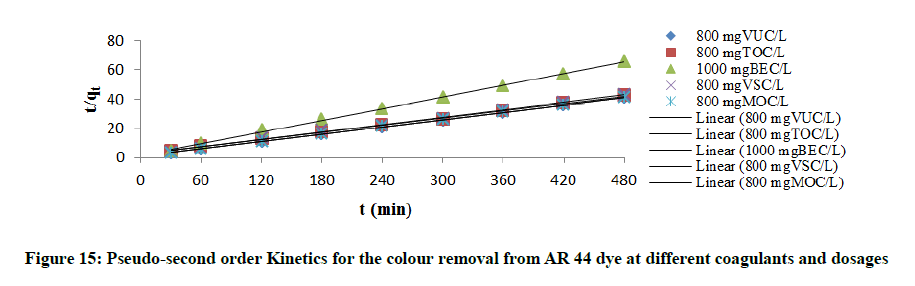
Figure 15: Pseudo-second order Kinetics for the colour removal from AR 44 dye at different coagulants and dosages
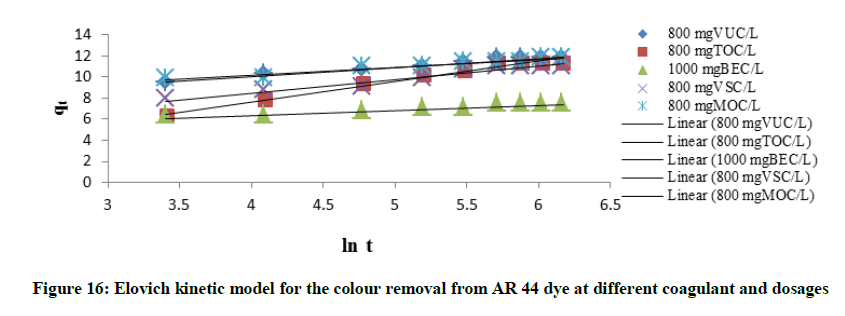
Figure 16: Elovich kinetic model for the colour removal from AR 44 dye at different coagulant and dosages
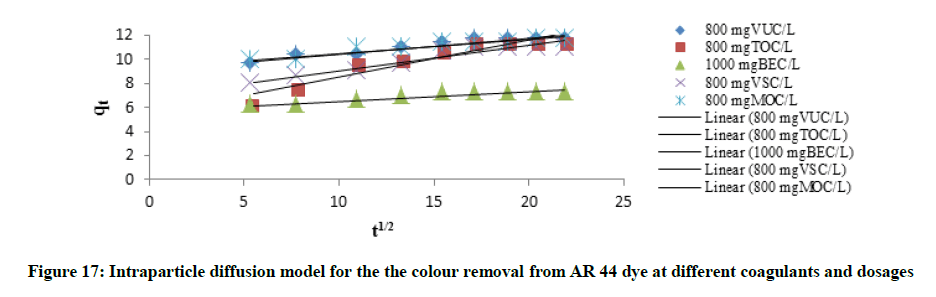
Figure 17: Intraparticle diffusion model for the the colour removal from AR 44 dye at different coagulants and dosages
Conclusion
The present study analyzed the feasibility of colour removal from AR 44 dye using natural organic polymers as coagulants. The precursors studied have been found to be highly effective in the decolourization process due to their adsorptive and coagulative characteristics. The extraction method employed in deproteinization of the coagulants precursor was effective and a lot suitable for sludge load reduction. Operational parameters studied (pH, coagulant dosage, initial dye concentration, settling time and temperature) extremely influenced the colour removal process. VUC gave an optimum removal efficiency of 93.5% at pH 2, the dosage of 800 mg/l, the dye concentration of 20 mg/l, 420 min and 303 K. Colour removal efficiency increased at low pH values. Effective monitoring and control of coagulant dosages were required for optimum coagulation. Dye concentration was a driving force that shows the extent of particle transfer. The extent of mass transfer of particles was evaluated through a time-dependent decrease in particle concentrations and consequently, flocs growths. High temperatures did not affect positively the coagulation-flocculation process. Adsorption mechanism is very important in the coagulation-flocculation process using natural (plant-based) coagulants. The coagulation-adsorption process occurred more as a second-order rate process, showing that the rate depends on the square of the particle concentration. Thus, at high particle concentrations, flocculation rate becomes very high. In conclusion, the coagulants studied were very effective for colour removal from AR 44 dye and could be adopted as conventional coagulants.
Acknowledgement
The authors wish to thank the Department of Chemical Engineering, Nnamdi Azikiwe University, Awka, Nigeria; Energy Research Centre, University of Nigeria, Nsukka, Nigeria; and Department of Chemical Engineering, Madonna University, Akpugo, Nigeria; for all support provided.
References
- G. Zhu, H. Zheng, Z. Zhang, T. Tshukudua, P. Zhang, X. Xiang, Chem. Eng. J., 2011, 178, 50-59.
- A. Anouzla, Y. Abrouki, S. Souabi, M. Safi, H. Rhbal, J. Hazardous Mater., 2009, 166, 1302-1306.
- J. Beltrán-Heredia, J. Sánchez-Martín, A. Delgado-Regalado, C. Jurado-Bustos, J. Hazardous Mater., 2009, 170, 43-50.
- J. Beltrán-Heredia, J. Sánchez-Martín, M.A. Davila-Acedo, J. Hazardous Mater., 2011, 186, 1704-1712.
- B. Bolto, J. Gregory, Water Res., 2007, 41, 2301-324.
- M.G. Antov, B. Marina, N.J. Petrovic, Bioresource Technol., 2010, 101, 2167-2172.
- S.S.D. Mariângela, O.C. André, M.G. Valdirene, Biol. Plant., 2003, 44, 417-421.
- A. Kuku, U.J. Etti, I.S. Ibironke, Plant Physiol. Biochem., 2014, 39, 137-146.
- O.J. Ikegwu, N.U. Oledinmma, V.N. Nwobasi, I.C. Alaka, J. Food Technol., 2009, 7, 34-37.
- F.J. Massawe, S.S. Mwale, S.N. Azan-Ali, J.A. Roberts, African J. Biotechnol., 2005, 4, 463-471.
- A. Ndabigengesere, K.S. Narasiah, B.G. Talbot, Water Res., 2005, 29, 703-710.
- I.A. Obiora-Okafo, M.C. Menkiti, O.D. Onukwuli, Inter. J. of Appl. Sci. Maths., 2014, 1, 15-21.
- A.O.A.C., Official Methods of Analysis. 15th (Edn.), Association of Official Analytical Chemists. Washington D. C, U.S.A., 1990.
- G.H. Jeffrey, J. Bassat, J. Mendham, R.C. Denney, Textbook of Quantitative Chemical Analysis. 5 (Edn.), Longman Scientific & Technical, 2005, 649-720.
- A. Ndabigengesere, K.S. Narasiah, B.G. Talbot, Water Res., 1995, 29, 703-710.
- I.A. Obiora-Okafo, O.D. Onukwuli, Nigerian Journal of Technology (NIJOTECH)., 2017, 36, 482-495.
- L.S. Clesceri, A.E. Greenberg, A.D. Eaton, Standard Methods for the Examinations of Water and Wastewater. 20th (Edn.), American Public Health Association (APHA), Washington DC, USA, 1999, 362- 372.
- I. Langmuir, J. Ame. Chem. Soc., 1918, 40, 1361-1403.
- H.R. Hall, L.C. Eagleton, A. Acrivos, T. Vermeuten, I and EC Fundamentals., 1996, 5, 212-223.
- H. Freundlich, Colloid and Capillary Chemistry, Mathuen, London, 1926, 110-134.
- G. Roop, G. Meenakshi, Taylor and Francis Group, 2005, 120.
- M.J. Temkin, V. Pyzhev, Acta Physiochem., 1940, 12, 217-222.
- M.M. Dubinin, L.V. Radushkevich, Proc. Acad. Sci. USSR Phys. Chem. Sec., 1947, 55, 331-337.
- T. Zhang, Q.R. Li, Y. Liu, Y.L. Duan, W.Y. Zhang, Chem. Eng. J., 2011, 168, 665-671.
- S. Lagergren, B.K. Svenska, Kungsven Velenska-Psad. Hand., 1898, 24, 1-6.
- Y.S. Ho, G. McKay, Process Biochem., 1999, 34, 451-465.
- Khated A. Nemr, AE. El-Sikaily, A Abdelwahab O, Removal of Direct N-Blue 106 from artificial textile dye effluent using activated carbon from orange peel: adsorption isotherm and kinetic studies. J. Hazard. Mater., 2008 165, 100–110.
- C. Aharoni, F.C. Tompkins, In: D.D. Eley, H. Pines, P.B. Weisz, (Eds.), Adv. Catal. Related Subj., Academic Press, New York, 1970, 21.
- W.J. Weber, J.C. Morris, J. Saint. Eng. Div. Proceed. Am. SOC. Civil Eng., 1963, 89, 31-59.
- V. Vimonses, S. Lei, B. Jin, C.W.K. Chow, C. Saint, Appl. Clay Sci., 2009, 43, 465-472.
- G. Li, J. Gregory, Water Res., 1991, 25, 1137-1143.
- S.S. Moghaddam, M.R. Alavi Moghaddam, M. Arami, J. Hazard. Mater., 2010, 175, 651-657.
- B.H. Hameed, D.K. Mahmoud, A.L. Ahmad, J. Hazard. Mater., 2008, 158, 65-72.
- M. Ozacar, I.A. Engil, H. Turkmenler, Chem. Eng. J., 2008, 143, 32-42.


