Research Article - Der Pharma Chemica ( 2020) Volume 12, Issue 5
Uv-Spectrophotometric Determination of Trapidil in Formulation
Prerna L Tiwari, Anvesha V Ganorkar, Milind J Umekar and Krishna R Gupta*Krishna R Gupta, Department of Pharmaceutical Chemistry, Smt. Kishoritai Bhoyar College of Pharmacy, New Kamptee, Nagpur, India, Email: krg1903@gmail.com
Received: 17-Sep-2019 Accepted Date: Aug 20, 2020 ; Published: 30-Aug-2020
Abstract
Quantitative estimation of Trapidil and its formulation by UV spectroscopy methods was developed. The Shimadzu UV 1700 double beam UVvisible spectrophotometer and Jasco v-63 UV-spectrophotometer was used for the determination of Trapidil in the formulation. In the UV method, trapidil was quantified at 304 nm and 225.4 nm by A1%,1 cm value and by comparison with standard at both the wavelength while for zero order derivative 293.8 nm and 316.4 nm for first order derivative in 0.1N NaOH were selected. Recovery studies of 98.8-101.14%, percentage relative standard deviation (RSD less than 2%) and correlation coefficient (linearity range) that developed methods were accurate and precise. This method can be employed for the routine analysis of formulation containing trapidil.
Keywords
Trapidil, UV spectrophotometry, Validation
Introduction
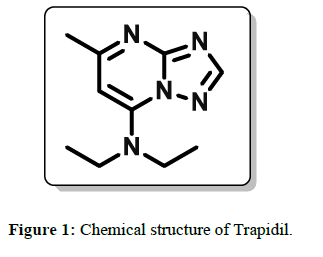
Trapidil is chemically known as N, N-diethyl-5-methyl [1, 2, 4] triazolo [1, 5 α] pyrimidine7-amine 1 (Figure 1). It’s Molecular weight is 205.26 g/mol with the Molecular Formula: C10H15N5
It is a platelet-derived growth factor antagonist, was originally developed as a vasodilator and anti-platelet agent and has been used to treat patients with ischemic coronary heart, liver and kidney. It is freely soluble in water, 0.1N NaOH, 5% HCl and Methanol [1]. It acts by inhibiting vascular smooth muscle cell proliferation and antagonize the platelet-derived growth factor (PDGF) [2].
For the quantitative analysis of dosage forms huge no. of analytical methods are available. Literature survey revealed several analytical methods such as UV, HPTLC [3], RP-HPLC [3, 4], Automated high-performance liquid chromatography assay [5], determination of Trapidil in serum and urine by derivative UV spectrophotometry for the determination of Trapidil [6]. No methods have been reported for determination of Trapidil in bulk and in formulation by UV method using low cost solvent. The main objective of the method development is to validate a simple, sensitive, rapid, economic and accurate UV spectrophotometric method for the estimation of Trapidil in bulk and in formulation
Material and Methods
Chemicals and Reagents
All the chemicals and solvents used for the experimental work procured from MERCK, FISHER (QUALIGENS), RANKEM (RFCL). The bulk drug and tablet formulation of Trapidil was gifted from Ajanta Pharmaceuticals Mumbai. All solvents and reagents used were of HPLC (or) Analytical grade respectively.
Instrumentation
Shimadzu® UV 1700 double beam UV-visible spectrophotometer was used along with 1.0cm path length matched pair of quartz and Jasco v-63 were used for UV-Spectrophotometric method. Weighing balance of Shimadzu AUX220 was used for weighing the chemicals. Calibrated glassware’s were used throughout experimental work.
Preparation of Standard and Sample Solution
Standard Stock Solution (A1): A 1 mg/mL of trapidil standard stock solution was prepared in 0.1 N NaOH.
Working Stock Solution (A2): A 1.0 mL of standard stock solution (A1) was transferred in 10.0 mL of volumetric flask and volume was made up to the mark with 0.1 N NaOH. (Conc. 100 μg/mL)
Working standard solution (A3): Aliquots of working stock solution (A2) were transferred using micropipette in 10.0 mL of volumetric flask and volume was made up to the mark with 0.1 N NaOH to get concentration in range of 2 μg/mL-10 μg/mL respectively.
Selection of Wavelength for Method I & Method II
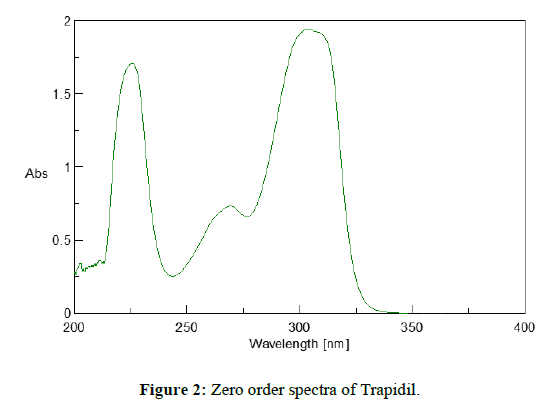
The working standard solution (A3) of trapidil (10 μg/ml) prepared as earlier mentioned procedure was scanned in the range of 200 nm-400nm in 1.0 cm matched quartz cell against solvent blank (0.1N NaOH) and spectrum was recorded. The spectrum so recorded is shown in Figure 2.
The study of spectra indicated that Trapidil shows maximum absorbance at 304 nm and 225.4 nm.
Selection of Wavelength for First Order Derivative (Method III)
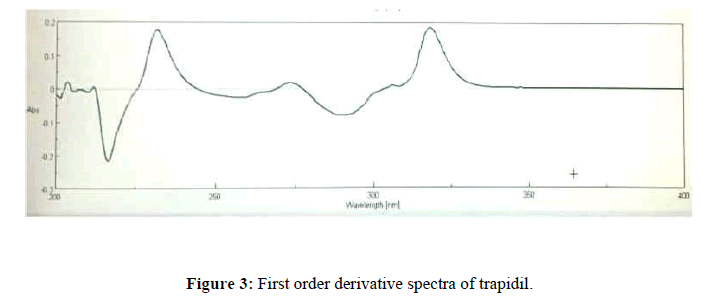
The working standard solution of Trapidil (6 μg/mL) was scanned in range of 200 nm-400 nm and a first order derivative spectra was recorded as shown in Figure 3.
The study of Figure 2 shows that the λ max of trapidil was found to be 293.8 nm and 316.4 nm. Hence, two wavelengths 304 and 225.4 nm were selected for method I and method II while 293.8 nm and 316.4 nm selected as detection wavelength for method III.
Method Development
Determination of a 1%, 1 cm value
The specific absorbance of Trapidil for method I was found to be 134.25 and 116.04 respectively for the selected wavelength.
Estimation of Trapidil in in-house pharmaceutical formulation
Formulation containing Trapidil was not available in market; therefore, the laboratory mixture of Trapidil was prepared Table 1. The formula for laboratory prepared mixture of Trapidil is as follows:
Table 1: Laboratory Prepared mixture of Trapidil.
| Sr. No. | Ingredients | Quantity (mg) |
|---|---|---|
| 1. | Trapidil standard drug | 200 |
| 2. | HPMC-15 | q.s. |
| 3. | Methyl cellulose | q.s. |
| 4. | Microcrystalline cellulose | q.s. |
| 5. | Talc | q.s. |
| 6. | Magnesium stearate | q.s. |
The present study describes development of simple and accurate UV-spectrophotometric methods for the estimation of trapidil from its laboratory mixture are as follows:
Application of Proposed Method to Prepared Laboratory Mixture of Trapidil
Preparation of sample solution
An accurately weighed and powdered mixture of trapidil and quantity of powder equivalent to about 10.0 mg of trapidil were transferred to 10.0 mL volumetric flask, dissolved in sufficient quantity of 0.1N NaOH, shaken properly and volume was made up to the mark with 0.1N NaOH and filtered through whatmann filter paper. From the above filtrate 1ml of solution was pipette out and volume was made up to the mark with 0.1N NaOH to get concentration 100 μg/mL. Above solution was further appropriately diluted with 0.1N NaOH to get the final concentration. Similarly, six such sample solutions were prepared. All the prepared solutions were recorded at the selected wavelength against blank as 0.1N NaOH (Table 2). Percent of label claim were calculated:
Table 2: Result for % label claim
| Methods | M I | M II | M III | |||
|---|---|---|---|---|---|---|
| 304 nm | 225.4 nm | 304 nm | 225.4 nm | 293.8 nm | 317.4 nm | |
| %Label claim | 98.91 | 98.97 | 99.55 | 99.51 | 98.28 | 98.88 |
| ± SD | 0.367 | 1.672 | 0.612 | 1.649 | 0.666 | 0.616 |
MI- A1%1cm method; MII-By comparison with standard and MIII-derivative method
Validation of the Proposed Method
The proposed method is validated according to the International Conference on Harmonization ICH guide lines.
Linearity
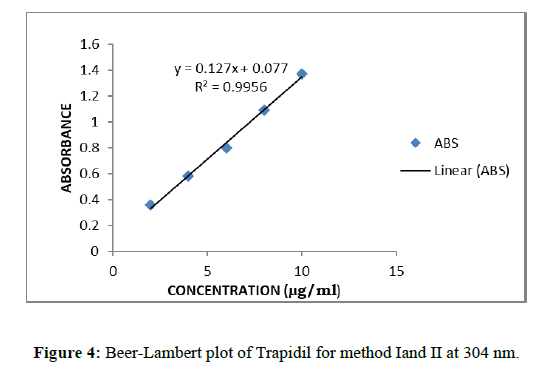
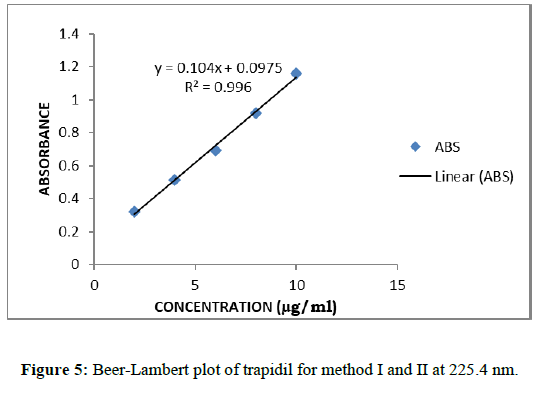
Calibration curves for trapidil were plotted in the various concentration ranges such as 2-10 μg/ml for all the methods. Accurately measured standard working solutions of Trapidil, Aliquots of working stock solution of standard (A2) were diluted with 0.1NaOH to get a concentration in the range of 2-10 μg/mL. The absorbance of each solution was measured at selected wavelengths for method I, II and III respectively. Absorbance was measured at a wavelength 225.4 nm and was plotted absorbance versus concentration to give calibration curve for method I and from this curve regression equation was calculated. First derivative curves of 2-10 μg/ml concentration solutions were obtained, which shows maxima at 304 nm and minima at 225.4 nm. The calibration curve of amplitude against concentration of the drug showed linearity for method II (Figures 4 & 5).
Also For method III wavelength selected as 293.8 and 317.4nm.
Accuracy (% Recovery)
Accuracy of the proposed method was ascertained on the basis of recovery studies performed by standard addition method. Known amounts of standard solutions of Trapidil were added in various levels to prequantified sample solutions of Trapidil. At each level of the amount 3 determinations were performed. The amount of Trapidil was estimated by applying obtained values to regression equation. Calculate the amount found and amount added for Trapidil and calculate the individual recovery and mean recovery values. The observations and results are shown in Table 3.
Table 3: Result for accuracy studies
| Sr. no. | Weight of Sample taken (mg) | Weight of pure Drug Taken (mg) | % Label claim | ||||||
|---|---|---|---|---|---|---|---|---|---|
| M I | M II | M III | |||||||
| Wavelength in nm | |||||||||
| 304 | 224.5 | 304 | 224.5 | 293.8 | 316.4 | ||||
| 1. | 18.6 | 5.3 | 98.67 | 100.56 | 99.05 | 101.13 | 99.62 | 99.81 | |
| 2. | 19.4 | 10.2 | 100.98 | 99.21 | 101.17 | 99.70 | 99.60 | 99.70 | |
| 3. | 19.3 | 12.7 | 101.73 | 101.33 | 101.96 | 101.73 | 98.50 | 101.14 | |
| Mean ± SD | 100.46 | 100.36 | 100.72 | 100.85 | 99.24 | 100.21 | |||
| 1.594 | 1.073 | 1.504 | 1.042 | 0.640 | 0.801 | ||||
Precision
Precision of any analytical method was expressed as SD and RSD of series of measurements generally n=5. Precision of estimation of Trapidil by proposed methods were ascertained by replicate analysis of homogenous samples of tablet content. Results are shown in Table 4.
Table 4: Result for precision.
| Weight | % Label claim(nm) | Weight | % Label claim | ||||||||||||||||||
|---|---|---|---|---|---|---|---|---|---|---|---|---|---|---|---|---|---|---|---|---|---|
| Of | Of | (nm) | |||||||||||||||||||
| Sr.no. | Sample | Wavelength in nm | sample | Wavelength in nm | |||||||||||||||||
| Taken | M I | M II | Taken | M III | |||||||||||||||||
| (mg) | 304 | 225.4 | 304 | 224.5 | (mg) | 293.8 | 316.4 | ||||||||||||||
| 1. | 18.0 | 100.62 | 101.29 | 101.53 | 101.80 | 18.2 | 98.75 | 98.86 | |||||||||||||
| 2. | 18.0 | 100.63 | 100.63 | 101.26 | 101.12 | 18.2 | 98.75 | 98.86 | |||||||||||||
| 3. | 18.0 | 99.54 | 100.42 | 100.44 | 100.12 | 18.2 | 98.50 | 99.20 | |||||||||||||
| 4. | 18.0 | 99.60 | 100.91 | 100.50 | 101.40 | 18.2 | 98.50 | 99.20 | |||||||||||||
| 5. | 18.0 | 100.47 | 100.74 | 101.38 | 101.26 | 18.2 | 98.75 | 98.86 | |||||||||||||
| Mean | 100.17 | 100.79 | 101.02 | 100.97 | Mean | 98.65 | 98.99 | ||||||||||||||
| ± SD | 0.553 | 0.327 | 0.513 | 0.581 | ± SD | 0.136 | 0.186 | ||||||||||||||
Intermediate precision (Reproducibility)
An accurately measured quantity of mixture powder equivalent to about 10.0 mg with 5 mg, 10 mg and 12.5 mg of pure drug was transferred to different 10.0 mL volumetric flask, sufficient quantity of 0.1N NaOH added to each flask and shaked for 10 min. and diluted up to the mark with 0.1N NaOH. The content in each flask was filtered through whattman filter paper. The filtrate was further diluted to with 0.1N NaOH to get final concentration of Trapidil. The absorbance of the final resulting solution was recorded at 0th hr, 1st hr, 2nd hr. Similarly, the absorbance of the same solution was measured on 1th to 3rd day and the percent
Labeled claim was calculated using formulae as described under marketed formulation. The results are shown in Table 5 and Table 6 for intraday and interday respectively.
Table 5: Results of intraday study.
| Percent Label claim (Method I) | ||||||
|---|---|---|---|---|---|---|
| 0 h | After 1 h | After 2 h | ||||
| 304 | 225.4 | 304 | 225.4 | 304 | 225.4 | |
| Mean | 100.68 | 102.06 | 100.54 | 101.23 | 101.23 | 100.25 |
| ±SD | 0.077 | 0.028 | 0.107 | 0.635 | 0.635 | 0.117 |
| Percent Label claim (Method II) | ||||||
| Mean | 100.13 | 101.46 | 100.11 | 101.20 | 99.50 | 100.25 |
| ±SD | 0.264 | 0.582 | 1.032 | 0.672 | 0.428 | 0.117 |
| Percent Label claim (Method III) | ||||||
| Mean | 99.01 | 99.12 | 98.20 | 97.84 | 96.60 | 98.01 |
| ±SD | 1.131 | 0.475 | 1.288 | 0.710 | 1.102 | 0.616 |
Table 6: Results of interday study.
| Percent Label claim (Method I) | ||||||
|---|---|---|---|---|---|---|
| 0 day | After 1 day | After 2 day | ||||
| 304 | 225.4 | 304 | 225.4 | 304 | 225.4 | |
| Mean | 98.73 | 100.27 | 97.07 | 98.23 | 96.70 | 97.27 |
| ± SD | 0.495 | 0.040 | 2.105 | 0.427 | 0.703 | 0.49 |
| Percent Label claim (Method II) | ||||||
| Mean | 99.50 | 101.24 | 98.21 | 99.19 | 97.65 | 97.87 |
| ± SD | 0.800 | 0.586 | 1.846 | 0.575 | 0.305 | 0.162 |
| Percent Label claim (Method III) | ||||||
| Mean | 99.72 | 99.46 | 99.23 | 99.08 | 97.61 | 98.33 |
| ± SD | 0.842 | 0.646 | 0.842 | 1.125 | 1.974 | 0.652 |
Limit of detection and limit of quantification
LOD: - The detection limit is usually expressed as the concentration of analyte which is the lowest amount of analyte in a sample that can be detected but not necessarily quantities as an exact value under the stated, experimental conclusions.
The standard deviation and response of the slope
LOD=3.3 * standard deviation (σ)/ s
LOQ: The quantitation limit of an analytical procedure is the lowest amount of an analyte in a sample which can be quantitatively determined with suitable precision, accuracy and variability. The standard deviation and response of the slope
LOQ=10* standard deviation (σ)/ s
Table 7: Result for LOD and LOQ.
| Parameter | Trapidil (µg) |
|---|---|
| LOD | 0.806 |
| LOQ | 2.436 |
Conclusion
From all above studies, we can conclude that the proposed UV spectrophotometric method can be used successfully for determination of Trapidil in formulation. The results obtained by UV spectrophotometric method for determination of Trapidil are reliable, accurate and precise. The method can be employed for routine quality control analysis of Trapidil in Formulation. Hence this method is cost effective as it carried by using less costlier solvent.
References
[1] http://en.wikipedia.org/wiki/Trapidil.
[2] M. Hoshiya and M. Awazu. Hypertension. 1998, 31(2), p.665-71.
[3] T. Sudha, V. Vengadesh and V. Ganesan. Am. J. Pharm Tech Res. 2011. 1(3), p. 219-26.
[4] BS. Vijaya, RJ Seshagiri and RP. Seetha. Res. J. Pharm. Biol. Chem. Sci. 2013. 4(4), p. 1385-90.
[5] R. Herrmann. Journal of Pharmaceutical and Biomedical Analysis. 1990. 8(12), p.1045-9.
[6] G. Ragno, A. Risoli, De Luca M et al., Analytical and Bioanalytical Chemistry. 2007. 389(3), p. 923-9.

