Research Article - Der Pharma Chemica ( 2017) Volume 9, Issue 2
A Comparative Study of Physical and Chemical Parameters of Selected Paracetamol Tablets Available in the Pharma Market of Libya
Osama IG Khreit1, Hanan AM Alkailani1 and Wala SK Alqathafi22Departmrent of Pharmacology, Faculty of Pharmacy, Omar Almukhtar University, Elbeida City, Libya
Abstract
Quality of any pharmaceutical product is very important because drugs must be marketed as safe and therapeutically active formulations whose performance is consistent and predictable. Evaluation of the physiochemical properties of the pharmaceutical products can ensure their quality as well as bioavailability and impart optimum therapeutic activity. Paracetamol tablet was chosen for this comparative study because it is widely used worldwide for treating moderate to severe pain and fever. In this present study was compared the weight variation, hardness and assessment of state content of ten brands of paracetamol tablets marketed in Libya following USP/BP guidelines. All ten brands of paracetamol tested conformed to the USP/BP weight variation test. All the brands had average hardness of ≥79 N, which was satisfactory for immediate release of tablet like paracetamol. Nevertheless, the standard deviations in hardness of the most brands were remarkably high. All the brands had shown their friability variation within ± 1% range specified by USP/BP, and standard deviation of friability was calculated among all the brands which were very close to individual percentage friability of all the brands. High performance liquid chromatography was used to determine Paracetamol content, and seven brands showed good chemical analysis profile which would further help in achieving optimum bioavailability and in fulfilling the patient demands. The other three brands (Panadol (Tunisia), Parol (Turkey) and paracetamol tablet (UK)) failed the content of active ingredient and did not comply with specification according to their state of content.
Keywords
Paracetamol, Weight variation, Hardness, Friability, HPLC
Introduction
Certainly sub-standard medications do more harmful than good to people's health and it is dangerous to give such drugs to people, besides, patients may lose confidence in health care professionals including their physician and pharmacist [1]. Paracetamol is an over-the-counter Non-Steroidal Anti-Inflammatory Drug (NSAID) commonly used as an analgesic and antipyretic agent, but it has weak anti-inflammatory effects since it has poor ability to inhibit Cyclooxygenase (COX) in the presence of high concentration of peroxides, as are found at sites of inflammation [2,3].
To date, a number of studies have analysed the physical and chemical characteristics of paracetamol medication in local markets. In the same vein, Chandrasekaran et al. assessed six brands of paracetamol 500 mg tablets by performing the quality control tests for weight variation, hardness and friability. Friability for all brands was below 1% and the weight variation test limit was from 0.5223-0.6315 g. Tablet hardness ranged from 7.0-12.5 kg/square inch. Based on the result from this study, it could be concluded that, despite some apparent minor differences in tablet hardness and disintegration time profiles, the dissolution characteristics of various paracetamol tablets appears to be similar and not significantly different from various manufacturers [3].
In addition, data from several studies suggest that paracetamol tablet was chosen as model drug as it was fast moving and highly consumed by people as well as having significant price differences among brands [4]. In an analysis of two different brands of paracetamol tablets, Verma found the quality of the (Brand B) of paracetamol was deviating much from standard when compared to those of (Brand A). It has been suggested that need for proper control over the manufacture of such drugs is imperative [5].
Furthermore, eight brands of paracetamol 500 mg tablets were assessed in the Nigerian capital city by Oga and his team using the quality control parameters of weight uniformity, active ingredient content and thin layer chromatography profile, it was 50% of the brands fell within the pharmacopoeial standard for active ingredient content, and all the brands complied with the weight variation and identification tests [6].
Most researchers investigating stated content of paracetamol have utilized HPLC assay that was used as an accurate, simple, reproducible and sensitive method for the determination of paracetamol in tablet formulation. Using this approach, some researchers have developed methods for the simultaneous estimation of Paracetamol and other active ingredients in pharmaceutical dosage forms using a C8 and C18 column by isocratic elution. These methods can be used for routine quality control analysis of paracetamol in pharmaceutical dosage form [7,8]. On the other hand, several other methods for the determination of paracetamol in tablet formulation have been described, including rapid TLC method for screening of marketed paracetamol tablets and identification of counterfeit and substandard paracetamol tablets by near infrared spectroscopy [9,10]. This present study was undertaken to evaluate the selected paracetamol tablet in Libyan market.
Material and Methods
This study is based on the comparison of available paracetamol 500 mg tablets brands in Libyan market that are available for consumer use. Ten brands of drug were taken that are coded accordingly, and assessed using the quality control parameters of weight uniformity, hardness, friability, and active ingredient content.
Brand selection and sample collection
There are approximately thirty brands of paracetamol in the pharma market of Libya. Among them ten available brands were selected for the study of physical and chemical parameters. All the brands were labelled as P. They were given the number from one up to ten for the convenience of study.
Weight variation test
Materials
Electronic analytical balance (AND, A & D instruments Ltd., Japan), and Tablets.
Method
For each brand, twenty tablets were taken and weighed individually using the electronic balance. The average weight of all the tablets was calculated and considered as the standard weight of the individual tablet. Then all the tablets were individually weighed and the percentage weight variation was calculated to determine whether the individual weight is within the range or not. The tablets meet the USP/BP test if not more than two tablets are outside the percentage limit and if no tablet differ by more than twice the percentage limit.
Hardness test
Materials
Hardness tester (Erweka GmbH, Germany), and Tablets.
Method
10 tablets were taken from each batch. Individually, tablets were placed between the jaws of the hardness tester individually and crushing value was recorded. The hardness value of each tablet was evaluated and average value was calculated and compared. The average hardness values were reported in Newton (N).
Friability test
Materials
Erweka friability tester (Erweka GmbH, Germany), Electronic Analytical Balance (AND, A & D instruments Ltd, Japan), and Tablets.
Method
At first ten tablets per sample were taken and were carefully dusted prior to testing. Then the ten tablets were weighed which was considered as the initial reading. After weighing, all the tablets were placed in the drum of friability tester and rotated 25 rpm. After 100 revolutions (4 min), the ten tablets were removed and re-weighed. This was the final reading. The percentage was calculated. According to USP/BP the tablets should not lose more than 1% of their total weight. The weight loss was obtained from the differences between the initial weight and final weight. The friability was calculated as the percentage weight loss.
HPLC assay of Paracetamol tablet
Material
Paracetamol reference standard and paracetamol tablet BP 500 mg was donated by Selvium Pharmaceutical Co., Limited, Benghazi City, Libya. HPLC grade acetonitrile was obtained from Fisher Scientific, UK, and water was double distilled.
High performance liquid chromatography (HPLC)
Reverse phase high-performance liquid chromatography was performed with an integrated Spectra SYSTEM Liquid Chromatograph (Thermo Electron Corporation, Waltham, US) fitted with an in-line degasser, 100-place autosampler and single channel, tunable UV absorbance detector (243 nm). Stationary phase (ACE 3 C18, 150 × 4.6 mm i.d., particle size: 3 μm) used was obtained from HiChrom Limited (Reading, UK). The experiments were operated at ambient temperature. The mobile phase was composed of a mixture of water and acetonitrile (90/10, v/v). The flow rate was 1.0 mL min−1 with an injection volume of 20 μL; three replicate injections of each calibration standard were performed. Data analysis was carried out using ChromQuest for LC (Ver. 4.2) software (Thermo, Electron Corporation, Waltham, US).
Calibration standards preparation
Paracetamol was weighed accurately (50.0 mg) into 100.0 mL clear glass volumetric flasks and diluted to volume with mobile phase to give solution containing paracetamol at 0.5 mg mL−1. This solution was then further diluted with mobile phase to give calibration standards containing 05.0 μg mL−1, 10.0 μg mL−1, 15.0 μg mL−1, 20.0 μg mL−1 and 25.0 μg mL-1.
Sample preparation
Twenty tablets were randomly selected from each brand, weighed and crushed. The weight of powder equivalent to 125 ± 10 mg Paracetamol was transferred into a 250 mL volumetric flask, shaken with ca 150 mL of mobile phase for 10 min and sonicated for 20 min. After dissolving, the solution was allowed to settle down and made up to volume. The solution was filtered through a 0.45 mm Sartorius nylon filter; 2 mL were taken and diluted to 50 mL with mobile phase in a volumetric flask to get a test solution of 20 μg mL-1. The sample was analysed using HPLC. Three injections were run on each brand and the area of the paracetamol peaks were quantified with the equation of calibration series of paracetamol standard to get the amount of the paracetamol in percentage present in each brand. The mobile phase was also run with the test samples to serve as the blank. Thermo ChromQuest software was used to integrate and analyse HPLC peak responses for quantitation of the peaks by area percent.
Results and Discussions
Physical appearances of tablets
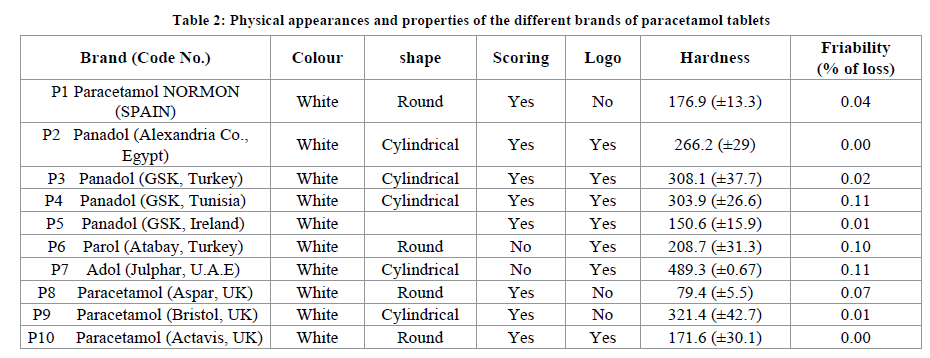
All the Paracetamol tablets investigated were within their shelf lives and immediate release dosage forms with label strength of 500 mg (Table 1). Physical appearance of the various brands of paracetamol tablets are shown in Table 1.
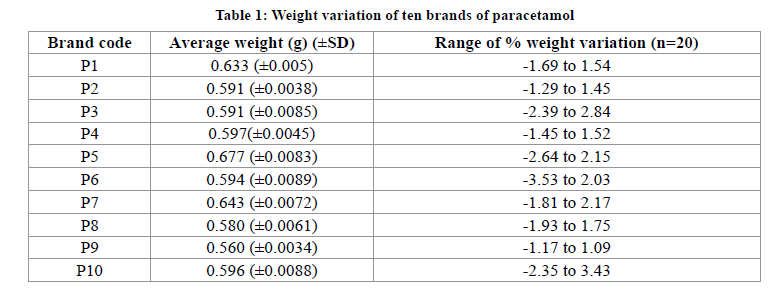
Weight variation test
Weight variation test is a very important quality control parameter because it is related with the content uniformity of a drug. A tablet is designed to contain a specific amount of drug in a specific amount of tablet formulation so it is necessary to measure that the drug contains the appropriate amount. In practice, composite samples of tablets (n=20) are taken and weighed throughout the compression process. The composite weight divided by 20 to reach an average weight of one tablet. Within the composite sample that has an acceptable average weight, there could be tablets excessively overweight or underweight. To help alleviate this problem the USP/BP provides limits for the permissible variations in the weights of individual tablets expressed as a percentage of the average weight of the sample. According to USP, the weight variation test is run by weighing 20 tablets individually in an analytical balance, calculating the average weight, and comparing the individual tablet weights to the average. The tablets meet the USP test if no more than 2 tablets are outside the percentage limit of 5% and if no tablet differs by more than 2 times the percentage limit, Because of the specification of tablet which weight of 324 mg and above should not outside ±5 limit [11]. The results of the weight variation analysis in this study are shown in Table 1. All ten brands of Paracetamol tested complied with the weight variation test and conformed to the USP/BP weight variation test specification. On the other hand, there were differences in the weight of tablet even though all tablets contain 500 mg active. A possible explanation for this might be that different excipients used for the manufacturing which are increasing or reducing the weight of the tablet [12].
Hardness test
Sufficient tablet hardness is essential to ensure damage resistance during handling, packaging and transportation. In order to withstand mechanical shocks of handling during its manufacture, packaging and transport, the tablet requires a certain amount of strength, or hardness. In addition, tablets should be able to withstand reasonable abuse when in the hands of the consumer. Adequate tablet hardness is a necessary requisite for consumer acceptance. During this test, the position of the tablet during the measurement process is critical. The USP states that the position shall be “preferably one that is most readily and easily reproduced by operators.”, the position orientation of the tablet in this study was done automatically by Hardness tester. One unanticipated finding was that most of the brands of paracetamol showed the standard deviation within the unacceptable range. Among the ten brands of paracetamol tested, only P7 and P8 showed comparatively acceptable standard deviation of their hardness (0.67 and 5.46, respectively) than other brands (Table 2). Even though using different excipients or the same excipients in different ratios might be one of the reasons for the observed differences in hardness value among the samples, however the deviation between tablet to tablet in the same brand was unexpected and needs more investigation.
Friability test
The minimal friability values for all the tablet brands is an indication of the ability of the tablet to withstand stress due to abrasive forces, without crumbling during transportation, packaging, handling and dispensing. Shock and frictional forces can cause the tablets to get damaged or break. With this test, it is possible to evaluate the ability of the tablet to withstand abrasion in packaging, handling and shipping which is expressed as a percentage.
When the hardness value of the tablets is increased there is a remarkable decrease in the percentage friability in all formulations. The possible reason for low degree of crumbling during friability may be due to high compressional force of granules being packed strongly [13,14].
A maximum weight loss of not more than 1% of the weight of the tablets being tested during the friability test using a friability test apparatus is considered generally acceptable and any broken or smashed tablets are not picked up. In the present study, among all the brands of paracetamol, P2 showed zero friability percentage. The minimal friability values for all the tablet brands are found and they are an indication of the ability of the tablet to withstand stress due to abrasive forces, without crumbling during transportation, packaging, handling and dispensing, all the brands of paracetamol tablets had passed this friability specification and values of <1% are considered to be highly satisfactory evaluation characteristics (Table 2).
HPLC assay
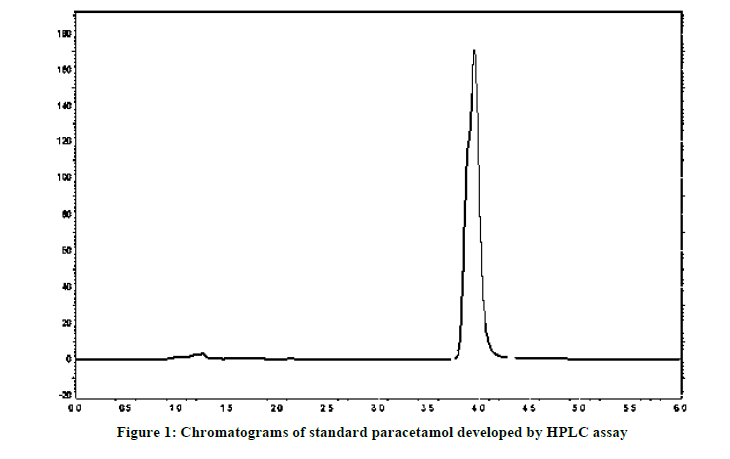
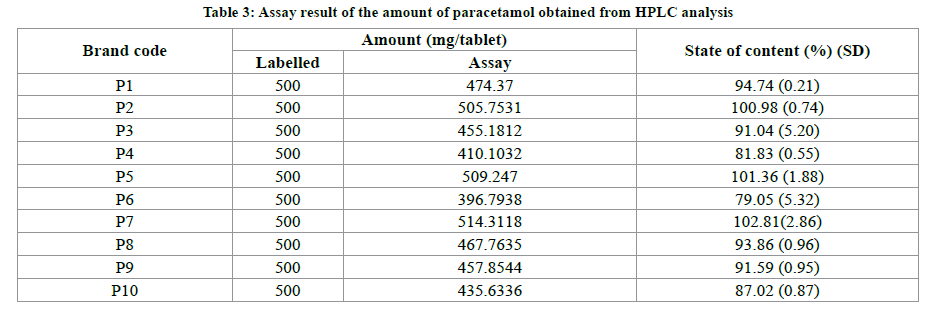
In the present study we have made an attempt to know the quantities difference in the various brands of the Paracetamol tablet formulation. The analysis was performed following the British Pharmacopeia (BP) method. The results of the assay of chemical content using HPLC analysis using an external standard to determine the amount of Paracetamol presents in each brand were presented in Table 3. The paracetamol showed a well-defined chromatographic separation within a run time of 6 min. The retention times of paracetamol at 3.96 min. ± 0.09 with standard error (Figure 1). The concentration of diluted samples extract was determined from calibration curve by substituting the peak areas of the diluted extract sample into the equation for the calibration line. The tablet extract was diluted to achieve concentration within the concentration of series of solutions used to prepare calibration series [15]. According to the USP/BP specification a 90-110% of active drug content [16], the results obtained from the assessment of the percentage content of active ingredient of seven brands of paracetamol tablets tested showed values within the monograph specification 90% to 110% of stated amount of paracetamol as demonstrated in Table 3. However, Brands P4, P6 and P10 were failed this requirement in the HPLC assay. This suggests that these brands did not comply with the label claims and the actual active drug content with USP/BP specification. This may result in underdoing the medicament.
Conclusion
In this study, it was observed that all the brands complied with the USP/BP specifications in terms of weight variation, and met USP/ BP specification standards for friability. However, most of them showed variation in their standard deviation of hardness. Further studies need to be conducted to test the potency and dissolution profile of the brands to confirm their pharmaceutical equivalence. HPLC method could also be suggested for the routine analysis of paracetamol in bulk drug as well as in pharmaceutical dosage formulations, the results of defining the stated content of paracetamol in tablets by the above-mentioned analytical method showed that most of the brands complied with the specification of BP within the range of 90-110% stated content excluding three brands that were considered inappropriate to be used in medical practice.
Conflict of Interest Statement
We declare that we have no conflict of interest.
Acknowledgments
Authors are grateful to Prof. Abdelhafeez H. Nimir, Doctor of Infectious Diseases, University of Khartoum, Sudan, for revisions and encouragement. The authors also gratefully acknowledge financial support of this work through Selvium Pharmaceutical Co., Ltd from Libya and ANOVA J.V. Company Limited-Vietnam.
References
[1] S.E. Nsimba, East. Afr. J. Public. Health., 2008, 5(3), 205-210.
[2] G. Graham, K.F. Scott, American J. Therapeut., 2005, 12(1), 46-55.
[3] A.R. Chandrasekaran, C.A.C. Yang, C.L. Wei, P.L. Sing, Int. J. Pharm. Sci. Nanotechnol., 2011, 4(2), 1403-1407.
[4] T.W. Hettiarachchi, D.B.M. Wickramaratne, S.H.T. Sudeshika, D. Niyangoda, M.H.F. Sakeena, 2015, 5.
[5] S.B. Poonam Verma, S. Pramanik, N. Yadav, World. J. Pharm. Pharm. Sci., 2015, 4(07), 1409-1414.
[6] E.F. Oga, O. Jolaosho, Int. J. Biol. Chem. Sci., 2010, 4(1), 115-121.
[7] ALTUN ML: Hplc method for the analysis of paracetamol, caffeine and dipyrone, Turk. J. Chem., 2002, 26(4), 521-528.
[8] P. Chandra, A.S. Rathore, S. Lohidasan, K.R. Mahadik, Sci. Pharm., 2012, 80(2), 337-351.
[9] J. Roy, P. Saha, S. Sultana, A.S. Kenyon, Bull. World. Health. Organ., 1997, 75(1), 19-22
[10] Y.J. Shek, R.D. Moffat, J. Pharma. Pharmacol., 2006, 58(S1), A-3, A-6.
[11] British Pharmacopoeia Commission, London, 2004.
[12] B. Abdullahu, A. Lajçi, V. Shehu, S. Krasniqi, H. Islami, Med. Arh., 2010, 64(4), 196-198.
[13] J.A. Seitz, G.M. Flessland, J. Pharm. Sci., 1965, 54(9), 1353-1357.
[14] A. Ahmed, S.A. Ali, F. Hassan, S.S. Ali, Pak. J. Pharm. Sci., 2001, 14(2), 47-55.
[15] D.G. Watson, Pharmaceutical analysis. Elsevier Limited, USA, 2007.
[16] http://www.pharmacopeia.cn/v29240/usp29nf24s0_m200.html


