Research Article - Der Pharma Chemica ( 2025) Volume 17, Issue 3
Anti Covid Drug Nanoparticles in the Formulation Controlled Release Dosage Form
Sribhadram Abhishek*Sribhadram Abhishek, Department of Pharmaceutics, Sri Sivani College of Pharmacy andhra Pradesh, India, Email: abhi96@gmail.com
Received: 05-May-2025, Manuscript No. DPC-26-178920; Editor assigned: 08-May-2025, Pre QC No. DPC-26-178920 (PQ); Reviewed: 22-May-2025, QC No. DPC-26-178920; Revised: 01-Aug-2025, Manuscript No. DPC-26-178920 (R); Published: 28-Aug-2025, DOI: 10.4172/0975 413X.17.3.728-736
Abstract
Favipiravir belongs to Biopharmaceutics Classification System Class I drug that has higher solubility and higher permeability. The drug needs to be administered frequently (2-3 times a day) total 1800 mg drug /day and also have shorter half-life it means the drug is eliminating from the body in 2-4.5 hrs. The present study was to overcome the half-life of favipiravir. So, it is formulated into nano-particles were prepared using a hydrophobic polymer-ethyl cellulose by modified solvent evaporation technique. Optimized formulation was selected and prepared into a tablet formulations using different excipients which control the drug release. The favipiravir loaded nanoparticles were sent to (FT-IR) studies and it shown the absence of interactions of drug with other excipients and also other studies like DSC, SEM. At the end of the 10th hour, F1-F6 formulations released 84.71%-96.43% of the drug. Among all the formulations F6 was chosen as a best formulation and used to prepare a various controlled release tablets. Based on many evaluation studies, the best tablet formulation was chosen.
The in vitro dissolution drug release of drug was controlled over extended period of time which was affected by the polymer and its amount of polymer.
Keywords
Nanoparticles; favipiravir; Ethyl cellulose; Controlled release; COVID-19
Introduction
The COVID-19 pandemic has approximately 16 million cases recorded from around the world, making it the worst public health crisis in a century. For the corona virus it would take a lot of time and effort to find a novel antiviral drug that is specifically effective against the SARS-CoV-2. due to this, it has been necessary to use repurposed medications that were previously used to treat viral infections. Favipiravir, an antiviral medication originally developed for influenza, is one of the medications that has recently attracted a lot of attention, particularly in India. Favipiravir activity against different types of viruses like ebola and also inhibits 53 types of influenza viruses.
Favipiravir it is an antiviral drug and mode of action differs from that of other influenza antivirals, which primarily prevents entry and exit of virus from the cells. Favipiravir-RTP, the drug's active form, blocks the viral genome from replicating and selectively inhibiting the RNA polymerase of the virus. This molecule integrated into the viral RNA strand and prevents growth.
According to biopharmaceutical classification systems, favipiravir belongs to class-1 drug that has higher solubility and permeability. favipiravir was required in large doses (to prevent SARS-CoV-2 infection in Vero cells. The medication must be taken often (2-3 times a day). Adults should take favipiravir at a suggested dosage of 1800 mg orally twice day on day 1 and 800 mg orally twice daily for a maximum of 14 days. The medicine must be taken regularly (2-3 times per day), totaling 1800 mg per day. It also has a shorter half-life; it means the drug eliminating from the body in 2-4.5 hours. The goal of the current study was to overcome the half-life of favipiravir.
In the present study favipiravir was formulated as nanoparticles by modified solvent evaporation technique using a hydrophobic polymer ethyl cellulose was used. Among all formulations, Optimized formulation was selected and prepared into an eight tablet formulations using different excipients which control the drug release.
Based on in vitro drug dissolution studies S2 formulation which contains pure drug releasing 96% of drug in 6 hrs. Drug in the remaining formulations extended up to 12 hrs. S1 was selected as the best formulation. From this study we concluded that the use of hydrophobic polymer is an effective rate of controlling polymer reduces the frequency of dosing and increasing the half-life of drug.
Nanoparticles have been versatile properties that make them which are capable of efficient delivery of biologically activemolecules, particularly biopharmaceuticals. Nanoparticles presents numerous advantages such as Targeted nano drug carriers enable for more efficient drug dispersion and administration while reducing medication toxicity [1].
Materials and Methods
Preparation of nanoparticles
A modified solvent evaporation technique was employed to create favipiravir nanoparticles. Favipiravir was weighed and dissolved in an equivalent volume of an organic solvent (methanol and dichloro methane) that included ethyl cellulose polymer. This organic phase-containing drug polymer combination was incorporated into the (aqueous phase) while being agitated mechanically at 5000 revolutions per minute. 0.5 ml/min addition of organic phase using a syringe with a needle inserted into the aqueous phase. The dispersion was constantly agitated for one hour at 5000 rpm. After filtering the resulting dispersion, nanoparticles began to develop as a result of overnight standing (Table 1).
|
Formulation |
F1 |
F2 |
F3 |
F4 |
F5 |
F6 |
F7 |
F8 |
|
Pure drug |
- |
200 |
- |
- |
- |
- |
- |
- |
|
Nanoparticles of favipiravir (equivalent to 200 mg of pure drug) |
334 |
- |
334 |
334 |
334 |
334 |
334 |
334 |
|
HPMC K 100 |
60 |
30 |
50 |
40 |
30 |
20 |
10 |
- |
|
Microcrystalline cellulose |
- |
30 |
10 |
20 |
30 |
40 |
50 |
60 |
|
Magnesium stearate |
3 |
3 |
3 |
3 |
3 |
3 |
3 |
3 |
|
Talc |
3 |
3 |
3 |
3 |
3 |
3 |
3 |
3 |
|
Total weight |
400 mg |
400 mg |
400 mg |
400 mg |
400 mg |
400 mg |
400 mg |
400 mg |
Table 1: Composition of 400 mg favipiravir Nanoparticles loaded Tablet.
Entrapment efficiency
To assess the efficiency of encapsulation, precisely weighed nanoparticles (10 mg) were added to 10 ml of distilled water. Following the achievement of equilibrium solubility, the clear supernatant from centrifugation was filtered and 1 ml of the filtrate was mixed with 4 ml of methanolic HCL. The finished sample was analysed at 276 nm using an ultraviolet-visible spectrophotometer using the formula below.
Encapsulation efficiency (%)=[1-(Drug in supernantant liquid / Total drug added)] × 100.
Results and Discussion
Ratio of yield
After thorough drying, the favipiravir nanoparticles were weighed. In the results, percentage yield data are tabulated.
% Yield= Nanoparticles weight × 100 Total weight of solids
Saturation solubility study
The solubility of favipiravir NPs was measured by incorporating 2 g of extra sample into 10 mL of water. For 24 hours, the samples were left on the water bath shaker. Clear supernatant was filtered once equilibrium solubility was obtained and 1 mL of the filtrate was combined with 4 ml of methanol HCl. A UV-vis spectrophotometer was used to evaluate the final sample at 276 nm [2].
FTIR (Fourier Transform Infrared Spectroscopy)
The formulations were recorded with FTIR (Bruker FTIR, Invinio, Japan) spectra. The prepared samples were examined for compatibility analysis, with the findings given in the results section.
SEM (Scanning Electron Microscopy)
The size of the particle and its surface shape can be determined by SEM examination. Different magnifications were employed with a scanning electron microscope (JEOL JSM-5200) with acceleration voltages of 15 KV and 30 KV at work distances (WD) of 14 mm and 41 mm, respectively.
DSC (Differential Scanning Calorimetry)
Differential scanning calorimetry was used to determine the medication and polymer compatibility (DSC-60, Shimadzu Corporation, Japan). The formulation's drug and the pure drug's melting points were automatically determined.
Invitro disolution studies
10 mg of favipiravir nanoparticles were used to perform in vitro drug release.For the invitro dissolution testing, the USP dissolution test device
| Formulation | F1 | F2 | F3 | F4 | F5 | F6 | F7 | F8 |
| Pure drug | - | 200 | - | - | - | - | - | - |
| Nanoparticles of favipiravir (equivalent to 200 mg of pure drug) | 334 | - | 334 | 334 | 334 | 334 | 334 | 334 |
| HPMC K 100 | 60 | 30 | 50 | 40 | 30 | 20 | 10 | - |
| Micro crystalline cellulose | - | 30 | 10 | 20 | 30 | 40 | 50 | 60 |
| Magnesium stearate | 3 | 3 | 3 | 3 | 3 | 3 | 3 | 3 |
| Talc | 3 | 3 | 3 | 3 | 3 | 3 | 3 | 3 |
| Total weight | 400 mg | 400 mg | 400 mg | 400 mg | 400 mg | 400 mg | 400 mg | 400 mg |
Table 2: Composition of 400 mg favipiravir F6 Nanoparticles loaded tablet.
Evaluation studies of tablets
Weight variation: The weight variation test was run on 20 tablets in accordance with the Indian Pharmacopoeia's guidelines. The maximum allowable divergence of a single weight from the average weight is 7.5%.
Hardness: The hardness of tablets was measured in kg cm2 using a hardness tester of the Monsanto type.
Thickness: Using a Vernier calliper, the thickness of 20 randomly chosen tablets from each formulation was measured and recorded.
Friability: The weight (Wo) of the ten tablets was measured. It rotates for around 100 revolutions and use a Roche friabilator. 4 minutes and 100 rotations of a given speed are followed by another weighting (W) of a known weight (WO). Pharmacopeia states that the%friability shouldn't be higher than 1%.
% Friability= Initial weight (Wo)-final weight(W)/initial(Wo) × 100.
Invitro dissolution studies of tablets
The in vitro dissolution investigation was carried out in the same manner as that for favipiravir-nanoparticles, With the exception of the use of dialysis bags. However, it took 12 hours and the outcomes were documented. Dilutions were created when necessary. The substance was recognised when the wavelength was set to 238 nm.
Invitro release kinetic studies
Zero order: Drug release follows zero order when it is independent of concentration.
C=kot
Where ko is zero order rate constant.
C is the amount of drug release at time t.
Graph: % drug release on y axis and time on x axis.
First order: This model explains the drug release for the dissolution when it is depending upon the concentration.
log C=logCo-kt/2.303,
C is the amount of drug release, t is time,
Co is amount dissolved at t=0,
K is 1st order rate constant.
Graph: log% drug unreleased on y axis and time on x axis.
Higuchi kinetics
Model explains how drug release and dissolution, which are dependent on concentration.
Graph: square root time on the y axis and drug release percentage on the x axis.
Q=Kt ½
K represents the constant that reflects the system's design parameters. The rate of release used here is the rate of drug diffusion.
Korsmeyer-Peppas model:
The korsmeyer and peppas model explains the empericial expression relates the function of time for diffusion controlled mechanism.
Mt/Ma= Ktn.
Mt/Ma denotes the amount of drug released at time,
K is rate constant
n value used to know the release mechanism,
Graph: log % drug release on y axis and log time on x axis.
The following are the results for preparation and evaluation (Tables 3 and 4) (Figures 1 and 2).
| Formulations | Solubility | % of yield | Encapsulation efficiency |
| Pure drug | 8.7 mg/ml | - | - |
| F1 | 6.3 mg/ml | 75.33 | 64.6 |
| F2 | 6.5 mg/ml | 71.22 | 62.3 |
| F3 | 7.5 mg/ml | 68.2 | 68.2 |
| F4 | 7.2 mg/ml | 76.1 | 63.2 |
| F5 | 7.8mg/ml | 73.25 | 61.5 |
| F6 | 8.2 mg/ml | 83.2 | 71.3 |
Table 3: Preparation and evaluation of favipiravir nanoparticles.
| Formulation | Hardness (kg/cm)2 | friability | Weight variation | Thickness |
| S1 | 4.3 ± 0.29 | 0.17 | 400.2 ± 0.5 | |
| S2 | 4.1 ± 0.13 | 0.29 | 399 ± 0.2 | |
| S3 | 4.0 ± 0.32 | 0.33 | 399 ± 0.5 | |
| S4 | 4.1 ± 0.86 | 0.72 | 398.3 ± 0.2 | |
| S5 | 4.0 ± 0.21 | 0.39 | 399.4 ± 0.6 | |
| S6 | 4.0 ± 0.89 | 0.61 | 398 ± 0.9 | |
| S7 | 4.1 ±0.12 | 0.29 | 398.3 ± 1.2 | |
| S8 | 4.2 ± 0.14 | 0.15 | 399 ± 0.8 |
Table 4: Post compression parameters for controlled release tablets.
FTIR (Fourier transformation infrared spectroscopy)
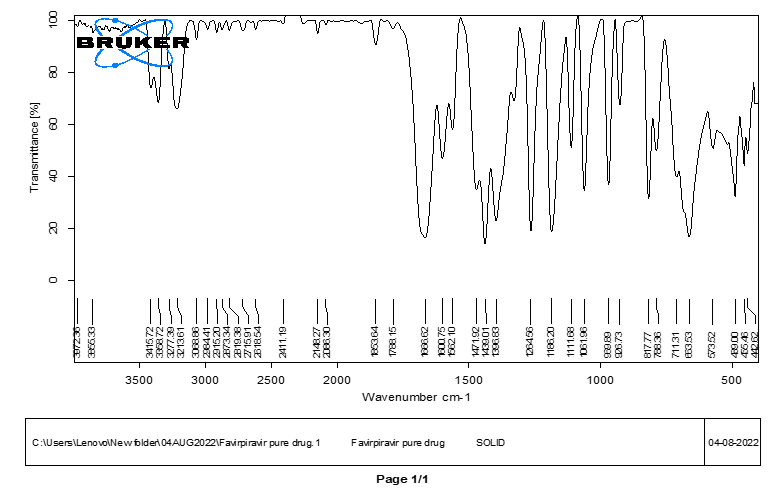
Figure 1: FTIR of pure drug.
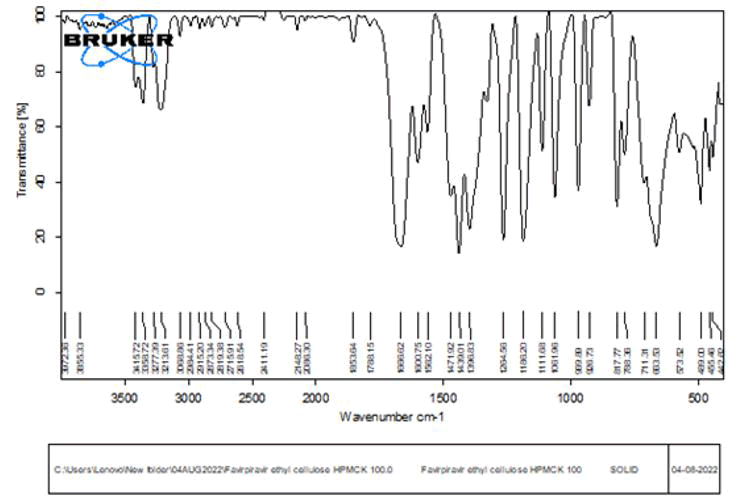
Figure 2: FTIR of optimized formulation.
From the FTIR, there was no significant change in the peaks of pure drug and drug with excipients. Therefore, it can be inferred that there was no significant interaction observed between the drug and the excipients.
DSC (Differential Scanning Calorimetry)
Differential Scanning Calorimetry (DSC) is a powerful thermal analysis technique that measures the heat absorbed or released by a sample compared to a reference as temperature changes, revealing key thermal events like melting, crystallization, glass transitions and purity, crucial for materials science, pharmaceuticals and food analysis to understand material behavior (Figures 3 and 4) [4].
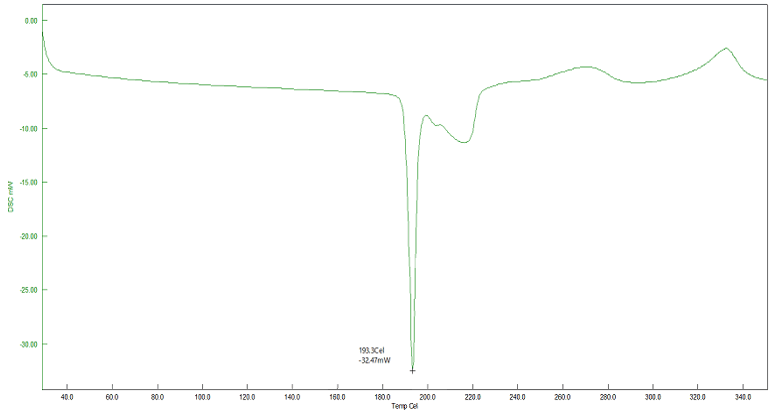
Figure 3: DSC of pure drug.
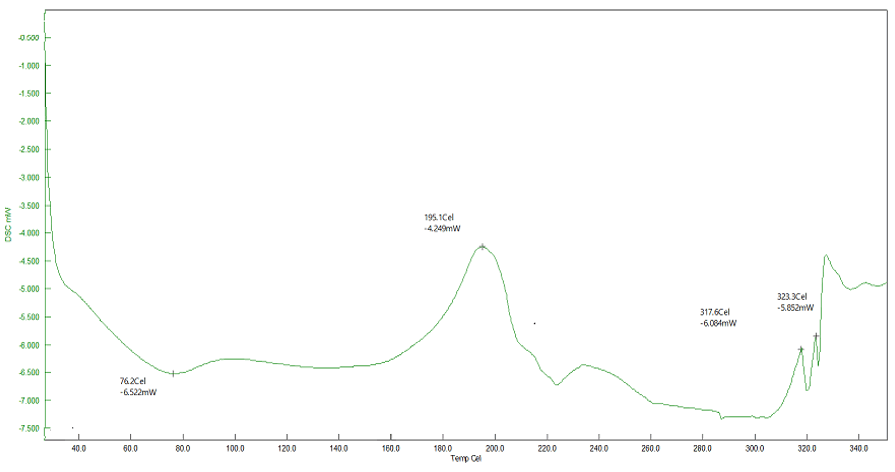
Figure 4: DSC of favipiravir nanoparticles optimized formulation.
DSC thermogram of pure favipiravir shows a sharp peak at 193.3 âÂÃÃÃÃÃÂ?????ÂÃÃÃÃÂ????ÂÃÃÃÂ???ÂÃÃÂ??ÂÃÂ?°C corresponding to its melting point. favipiravir nanparticles showed a similar endothermic peak at 195.1âÂÃÃÃÃÃÂ?????ÂÃÃÃÃÂ????ÂÃÃÃÂ???ÂÃÃÂ??ÂÃÂ?°C, which confirms absence of polymer drug-interaction (Table 5).
| Time (min) | F1 | F2 | F3 | F4 | F5 | F6 |
| 0 | 0 | 0 | 0 | 0 | 0 | 0 |
| 5 | 3.79 | 3.21 | 3.57 | 4.99 | 3.63 | 4.67 |
| 10 | 5.12 | 4.67 | 4.19 | 7.11 | 5.47 | 7.98 |
| 30 | 8.67 | 5.98 | 7.82 | 14.09 | 9.58 | 11.43 |
| 60 | 16.59 | 13.05 | 18.46 | 24.23 | 21.17 | 21.11 |
| 120 | 31.81 | 28.77 | 33.43 | 28.76 | 35.49 | 37.4 |
| 180 | 39.58 | 36.41 | 41.51 | 34.59 | 43.26 | 45.81 |
| 240 | 55.27 | 52.17 | 57.23 | 49.11 | 59.87 | 60.42 |
| 300 | 62.41 | 59.89 | 64.76 | 57.43 | 66.54 | 68.74 |
| 360 | 78.66 | 75.28 | 80.39 | 72.84 | 83.42 | 75.53 |
| 420 | 82.45 | 78.46 | 84.58 | 77.69 | 86.39 | 88.46 |
| 480 | 88.23 | 87.09 | 92.15 | 84.27 | 94.23 | 96.06 |
| 540 | 88.47 | 87.38 | 92.53 | 84.64 | 94.75 | 96.21 |
| 600 | 88.64 | 87.74 | 92.86 | 84.71 | 94.21 | 96.43 |
Table 5: % Drug release of nanoparticles F1-F6.
All the nanoparticle formulation released more than 80% of drug at the end of 10 hrs. Effect of ethyl cellulose on drug release: As the concentration of ethyl cellulose increased in the formulations f1,f2,f3,f4,f5,f6 decreased the percentage drug release from nanoparticles.
Release mechanism of nanoparticles in graphical manner
Nanoparticles (NPs) release encapsulated substances, such as drugs, through three primary mechanisms: diffusion, degradation (or erosion) and stimuli-responsive triggers (Figure 5).
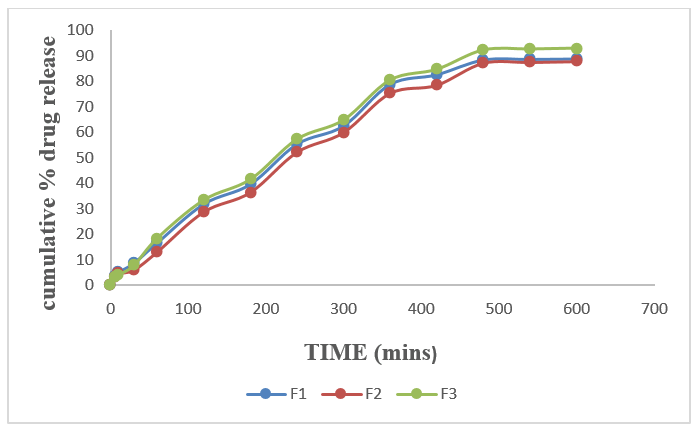
Figure 5: Drug release of nanoparticle formulation F1, F2, F3.
Based on entrapment efficiency, solubility, invitro dissolution studies F6 was selected as an optimized nanoparticle formulation (Table 7).
| Time (mins) | S1 | S2 | S3 | S4 | S5 | S6 | S7 | S8 |
| 0 | 0 | 0 | 0 | 0 | 0 | 0 | 0 | 0 |
| 5 | 4.15 | 24.92 | 3.1 | 3.34 | 3.1 | 3.95 | 3.7 | 3.2 |
| 15 | 7.43 | 36.38 | 6.28 | 4.01 | 4.02 | 7.48 | 5.08 | 5.86 |
| 30 | 8.59 | 46.45 | 7.43 | 7.39 | 7.67 | 10.68 | 8.67 | 8.65 |
| 60 | 13.39 | 56.55 | 11.54 | 8.31 | 9.59 | 13.11 | 10.73 | 11.74 |
| 120 | 22.11 | 63.11 | 18.56 | 18.54 | 16.1 | 25.49 | 12.94 | 12.25 |
| 180 | 29.49 | 70.62 | 26.77 | 28.3 | 24.1 | 30.96 | 20.28 | 18.72 |
| 240 | 39.01 | 84.28 | 35.34 | 39.76 | 33 | 36.7 | 26.45 | 24.1 |
| 300 | 47.25 | 97.15 | 40.65 | 44.96 | 39.14 | 41.85 | 33.53 | 33.31 |
| 360 | 55.35 | 97.32 | 48.04 | 50.1 | 43.39 | 48.01 | 36.82 | 38.64 |
| 420 | 60.1 | 97.4 | 56.97 | 54.76 | 49.5 | 53.42 | 43.37 | 44.6 |
| 480 | 68.12 | 97.6 | 63.4 | 61.6 | 56.37 | 59.07 | 51.44 | 52.15 |
| 540 | 74.81 | 97.67 | 69.96 | 69.74 | 64.78 | 64.03 | 56.68 | 55.74 |
| 600 | 84.19 | 97.74 | 78.8 | 74.84 | 69.15 | 66.3 | 62.52 | 65.68 |
| 660 | 89.95 | 97.26 | 84.19 | 87.8 | 83.72 | 73.96 | 68.55 | 70.09 |
| 720 | 94.13 | 97.79 | 89.29 | 86.53 | 83.72 | 79.19 | 77.27 | 73.87 |
Table 7: % of drug release of 400 mg of favipiravir controlled tablet formulation.
Comparision of drug release between S1&S2: In S1 the nanoparticles of favipiravir were used and in S2 consists a pure drug. In this the % of drug release S1 released 94.13% (fig 59) at the end of 12 th hour and S2 released 97.15% at the 6 th hour.(fig 59). Hydrophobic polymers was presence in nanoparticles , retaining the solubility of nanoparticles loaded drug than pure drug, this may be the reason S1 formulation drug releases at controlled manner compared to S2 [5].
Effect of HPMCK 100 on drug release
The HPMC K 100 controlled the release of drug as the concentration of Hpmc k 100 increased in the formulations (S3, S4,S5) and compared to (S6,S7,S8) The effect of HPMC K100M significantly controlled the drug release from tablets (Figures 7-8).
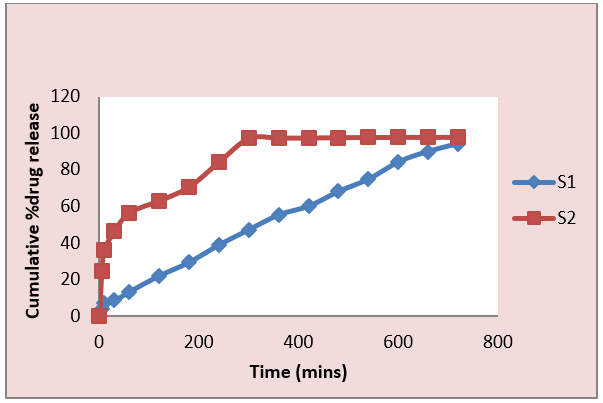
Figure 6: Drug release of favipiravir nanoparticles (S1) & favipiravir pure drug(S2).
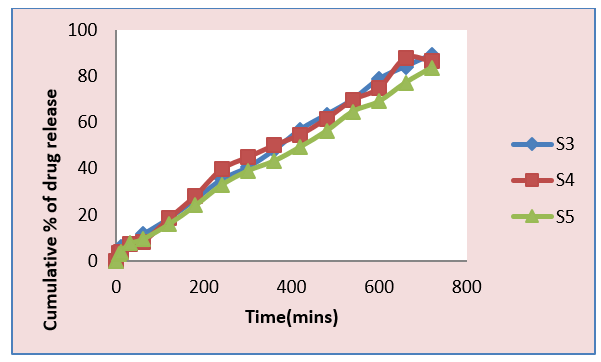
Figure 7: Zero order plot of S3, S4, S5.
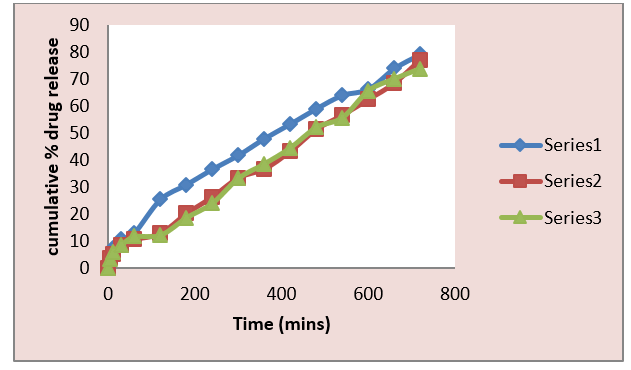
Figure 8: Zero order plot of S6, S7, S8
In vitro kinetic analysis
In vitro drug release kinetics of controlled release tablets for favipiravir nanoparticles.
The drug release data is fitted into the various
pharmacokinetic effects such as zero order, first order, higuchi model, korsemeyer Peppa’s model (Table 8) [6].
| Formulation | Zero order | First order | Higuchi model | Peppa’s and korsemeyer’s model | Peppa’s and korsemeyer’s N values |
| S1 | 0.9463 | 0.9761 | 0.9862 | 0.9784 | 0.6552 |
| S2 | 0.937 | 0.9917 | 0.9905 | 0.99 | 0.678 |
| S3 | 0.9905 | 0.9307 | 0.9539 | 0.9777 | 0.6548 |
| S4 | 0.9476 | 0.9797 | 0.9536 | 0.9841 | 0.6678 |
| S5 | 0.888 | 0.9528 | 0.9849 | 0.9743 | 0.687 |
| S6 | 0.8179 | 0.9342 | 0.9473 | 0.9711 | 0.6595 |
| S7 | 0.9359 | 0.9517 | 0.9507 | 0.9765 | 0.6902 |
| S8 | 0.9981 | 0.9652 | 0.9469 | 0.9687 | 0.7063 |
| Note: All the formulations except S3, S8 followed first order release. | |||||
Table 8: Invitro kinetic analysis (R2 values).
S1 & S2 drug release mechanism is higuchi while other formulations are korsemeyer peppa’s so, the release mechanism for most of the formulations is erosion than diffusion. Based on n value, all the values are between n=0.5 to 1 indicate the diffusion process in controlling release kinetics [7].
Conclusions
Favipiravir is an anti-covid drug belongs to BCS Class-I, which has high solubility and high permeability. The drug needs to be administered frequently (2-3 times a day) total 1800 mg drug /day and also have shorter half-life it means the drug is eliminating from the body in 2-4.5 hrs. So, the nano-particles were prepared using a hydrophobic polymer-ethyl cellulose by modified solvent evaporation technique. Optimized formulation was selected and prepared into a tablet formulations using different excipients which control the drug release. Based on in vitro drug dissolution studies S2 formulation which contains pure drug releasing 96 % of drug in 6 hrs. Drug in the remaining formulations extended up to 12 hrs. S1 was selected as the best formulation.
Acknowledgement
The Chairman of the Board of Directors of the thanks to the Vignan Group of Institutions for providing a bench place for the study.
References
- Furuta Y, Komeno T, Nakamura T. Proceed Japan Acad Ser B. 2017; 93(7): p. 449-463.
[Crossref] [Google Scholar] [PubMed]
- Chemicals T. Pharmaceuticals and medical devices agency: Avigan (favipiravir) review report. 2022; 29:2014.
- Jin Z, Smith LK, Rajwanshi VK, Kim B, et al. PloS one. 2013; 8(7): e68347.
[Crossref] [Google Scholar] [PubMed]
- Sleeman K, Mishin VP, Deyde VM, et al. Antimicrob Agen Chemother. 2010; 54(6): p. 2517-2524.
[Crossref] [Google Scholar] [PubMed]
- Jani GK, Shah DP, Prajapati VD, et al. Asian J Pharm Sci. 2009; 4(5): p. 309-323.
- Krishna LN, Kulkarni PK, Dixit M, et al. IJDFR. 2011; 2(6): p. 54-71.
- Wang M, Cao R, Zhang L, et al. Cell Res. 2020; 30(3): p. 269-271.
[Crossref] [Google Scholar] [PubMed]