Research - Der Pharma Chemica ( 2021) Volume 13, Issue 1
Comparative Chomatographic Study for Determination of Dalfampridine and its Derivative in Pharmaceutical Formulations
Khadiga M. Kelani1,2, Ahmed M. Wafaa Nassar2*, Wael Talaat3 and Samir Morshedy32Pharmaceutical Analytical Chemistry Department, Faculty of Pharmacy, Modern University for technology and Information (MTI), Cairo, Egypt
3Pharmaceutical Analytical Chemistry Department, Faculty of Pharmacy, Modern University for technology and Information (MTI), Cairo, Egypt
4Pharmaceutical Analytical Chemistry Department, Faculty of Pharmacy, Damanhour University, Cairo, Egypt
5Pharmaceutical Analytical Chemistry Department, Faculty of Pharmacy, Damanhour University, Cairo, Egypt
Ahmed M. Wafaa Nassar, Pharmaceutical Analytical Chemistry Department, Faculty of Pharmacy, Modern University for technology and Information (MTI), Cairo, Egypt, Email: ahmedwafa2y86@yahoo.com
Received: 14-Sep-2020 Accepted Date: Jan 21, 2021 ; Published: 28-Jan-2021
Abstract
Two sensitive and precise methods were developed and validated for simultaneous estimation of dalfampridine with its oxidative degradation in pharmaceutical formulations without noticeable interference. Among the techniques adopted were chromatography [coupled TLC-densitometry and HPLC]. Method I: chromatographic separation a Spheri-5 RP C8 (220 X 4.6 X 5μm particle size) column was used in addition to the mobile phase [acetonitrile and 0.05 M KH2PO4 - (pH=5), (65: 35 v /v)], with a flow rate of (1ml.min−1) by detection (UV) at 298 nm. Method II: Densitometric separation of the drugs was performed on aluminium plates precoated with silica gel 60 F254 plates, with mobile phase chloroform, acetonitrile and methanol (volume 6:3:1) and measuring densitometry at 254 nm. HPLC calibration outline were set by the zone (0.2-6 μg mL-1), and retention time (Rt) values for oxidative dalfampridine degradation and intact dalfampridine were setup (2.0+0.03, and 3.5+0.02) minutes respectively. While TLC outline were set by the zone (0.5-6 μg /spot) and retention time (Rt) values were setup to be 0.84 for entire dalfampridine and (0.26 and 0.72) for its degradation, respectively. LOD (μg. ml-1) was (0.054, 0.098) and LOQ (μg. ml-1) was (0.179, 0.325) for HPLC and TLC respectively.
The improved procedural steps were verified with prefect precision, consistency in addition to cost efficient, according to the guidelines requirement of the International Conference on Harmonization (ICH). And statistically, the results were compared and matched to the published method with no considerable interference.
Keywords
Dalfampridine, Dalfampridine oxidative degradate, HPLC, TLC-densitometry
Introduction
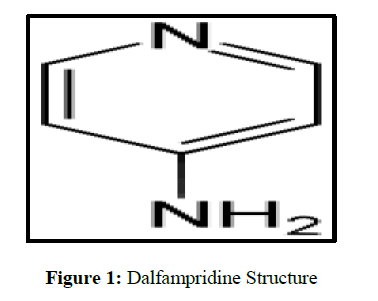
Dalfampridine denomination is: (4-aminopyridine) [1] Figure 1. It is used as a potassium channel research tool for treating some of the symptoms of multiple sclerosis [1] and is suggested for symptomatic improvement of walking in adults with disease alterations.
Several reference analytical techniques were applied for quantitative estimation of dalfampridine including pharmacokinetics methods[2] spectro-photometric methods and HPLC methods[3-14].
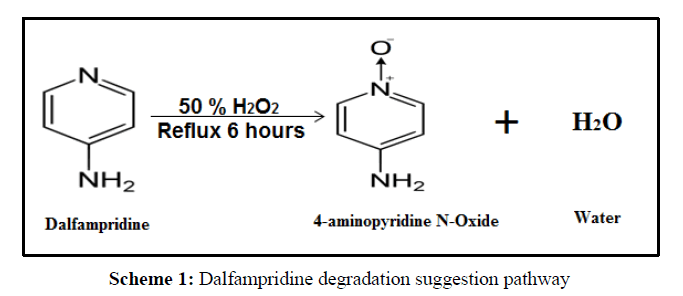
Dalfampridine contains a group of pyridine susceptible to oxidative degradation producing the 4-amino-pyridine-N-oxide degradation product.
Stability comparison analytical processes are not recorded for estimating and evaluating dalfampridine with its degradation product.
The goal of this work is to improve, establish and validate novel, quick, susceptible and selective chromatographic methods for dalfampridine determination and its oxidative-degradation product (4-amino-pyridine-N-oxide) without preliminary separation. The intended methods were found to be fast, effective, and simple and could be implemented in quality control laboratories for their routine analysis.
Experimental
Instruments
• USA LDC Analytical (Milton Roy) -HPLC is fitted out with Diode-array UV-visible detector and automation sampler injector, using a Spheri-5 RP C8 (220 X 4.6 X 5μm).
• Analysis chromatography is done using (EZ Chrom Elit) data analysis program.
• Germany Camag tool consists of : 1-Linomat Camag automation sampler (Muttenzle, Switzerland), 2- Camag microsyringe (100 μL) and 3- Camag 35 / N/30319 TLC win CATS software scanner, 4-ultraviolet (UV) 254 nm wavelength light. Germany TLC Aluminium plates were precoated with simple silica gel film 60 GF254 diameters (20×20 cm).
• Chromatographic simple tank [ 25 ×25×9 cm].
• USA Scientific Hot plate.
• USA Jenway pH meter No: 3510.
• USA rotatory evaporator (Scilogex-RE 100-pro,).
Materials and reagents
Pure standard
Dalfampridine powder is providing by Andalous pharma industry Company Al -Maadi, Cairo, Egypt. (B. NO: D1005).
Pharmaceutical preparation
Dalfarosis 10mg® extended release tablet, is providing by Andalous pharma industry Company Al -Maadi, Cairo, Egypt. (B.NO: 98400).
Reagents and solvents
• Hydrochloric acid (El-Nasr Co., Egypt) was prepared as a methanol solution of 0.1 M and aqueous solution of 1M.
• Sodium hydroxide, (El-Nasr Co., Egypt), was prepared as aqueous solution of 1M.
• 50%.Hydrogen peroxide, (Sigma-Aldrich, Egypt).
• Germany Sigma-Aldrich HPLC grade of (methanol, acetonitrile and chloroform).
• O-phosphoric acid and glacial acetic acid.
• Phosphate buffer solution (0.05M) was prepared by resolving 3.4gm of potassium dihydrogen phosphate (KH2PO4 ) in 500ml distilled water and adjust solution to (pH =5) using o-phosphoric acid.
Degraded sample
100 mg of pure dalfampridine powder was dissolved in 45 ml of distilled water and transferred in addition to 5 ml of 50 %H2O2 into a 100 ml round bottom flask. The solution was heating reflux for 6 hours, and evaporation dryness under vacuum.
Remains and residues were extracted with ethanol (2×10 ml), then filtered and diluted with ethanol into a 100-ml volumetric flask to obtain a labeled stock solution containing degradate derived from 1mg / ml of dalfampridine and a working solution of degradate (100 μg / ml) was obtained by additional dilution of the stock solution with a mobile phase.
Standard solutions
(a)- Dalfampridine stock standard solution (1mg. ml-1) was prepared by resolving 0.1g of dalfampridine in 10 ml 0.1 M methanolic hydrochloric acid and complete to 100 ml with Water.
(b)- Dalfampridine working solution (100 μg.ml-1):10 ml of dalfampridine was carried from its stock standard solution into 100 ml volumetric flask, and complete the volume with water.
(c)- Dalfampridine degradation product stock standard solution of (1mg.ml-1) was prepared by resolving 0.1g of (4-amino-pyridine-N-oxide) in 50 ml methanol and complete to 100 ml with the same solvent.
(d)- Dalfampridine degradation product working solution (100 μg.ml-1):10 ml of dalfampridine degradation product was carried from its stock standard solution into 100 ml volumetric flask, and complete the volume with methanol.
Procedures
Construction of calibration curves (Straight Line Curves)
RP-HPLC method
Dalfampridine aliquots equivalent to (0.2-6 μg) were accurately transferred from its respective working standard solution (100 μg.ml-1) into a set of 10-ml volumetric flasks and the volume was completed with the mobile phase [Acetonitrile: 0.02 M KH2PO4 (65: 35 v/v)] to the Mark.
-A 20-μL aliquot of each solution was injected into a Spheri-5 RP C8 (220 X 4.6 X 5 μm) with flow rate (1.0 ml/min-1) and UV detection at 298 nm.
- Straight line curve was constructed by depicting the peak area against dalfampridine concentrations on a chart.
Densitometry-TLC method
- Aliquots dalfampridine stock standard solution (1mg.ml-1) were spotted onto the TLC plate using micro syringe (50 μL) Camag automation sampler and mobile phase [15,16] chloroform: acetonitrile: methanol] (6:3:1), the ascending technique was then improved on the plate, and the plate was air-dried. The chromatogram was scanned at 254 nm.
- Straight line calibration curve was reveals the relationship between integrated peak area and dalfampridine concentrations.
Application to laboratory prepared mixtures
Small aliquots of dalfampridine were combined with its oxidative degradation to prepare distinct mixtures containing varying ratios of both. The calibration curves were then constructed by mentioning and pointing the steps of the procedure, and then calculating the dalfampridine concentrations.
Application to pharmaceutical formulation
A volume of dalfarosis ® tablet equivalent to 250 mg was taken and resolved in 250 ml flask with 10 ml 0.1 M methanolic hydrochloric acid, and finished with methanol, then filtered to get a labeled solution containing dalfampridine (1 mg . ml-1). After that, 10 ml of the filtrate was transferred into 100 ml volumetric flask, followed by completing the volume with methanol to get a labeled solution containing dalfampridine (100 μg.ml-1).
Results and Discussions
Degradation of dalfampridine
Full oxidative degradation of dalfampridine was observed after drug refluxation with 50 percent H2O2 at 80-100°C for 6 hours, and chloroform TLC method: methanol: acetonitrile (volume 6:1:3) accepted and confirmed the degradation result, Where a suggested degradation pathway is seen in Scheme (1):
Identification of the degradation product
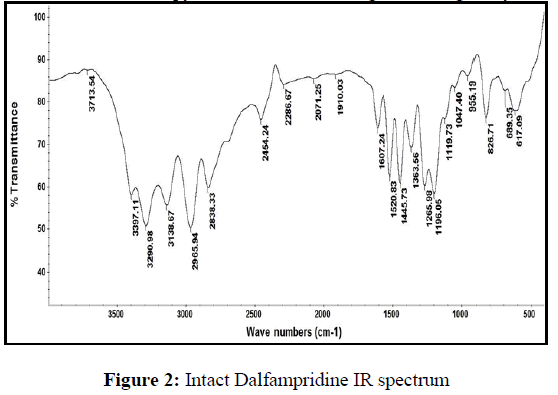
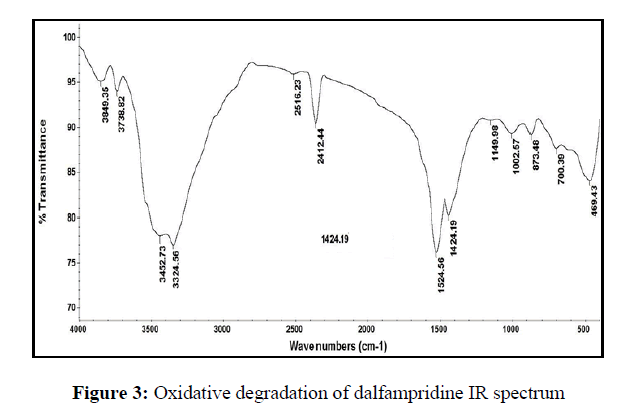
IR spectrum of the entire dalfampridine in Figure 2, was demonstrated peak of (C=N) of pyridine group at 1726.31 cm-1, while IR spectrum of oxidative degradation product in Figure 3, demonstrated ionization of (C=N) stretch of pyridine group result of presence of N-oxide group.
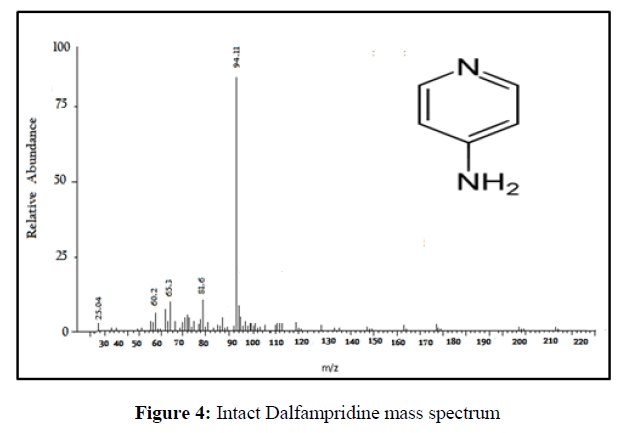
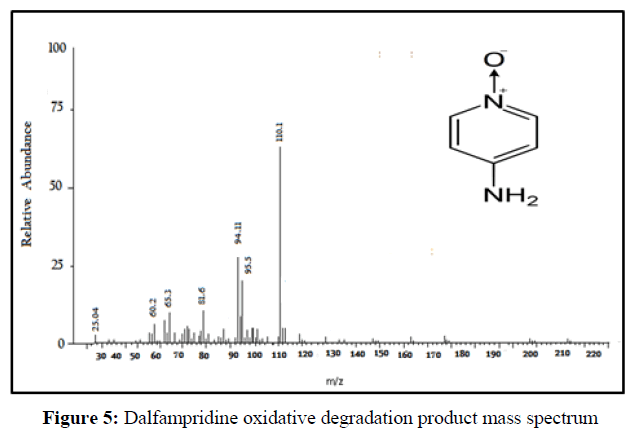
Mass spectrometry showed intact dalfampridine with 94,114 molar mass while dalfampridine oxidative degradation product molar mass was present at 110.1, Figures 4 & 5. And all index above shows 4-amino-pyridine-N-oxide as a degradation agent by conclusion.
Chromatographic conditions
Several trials for the adequate separation of dalfampridine and its oxidative degradation product were conducted to enhance and establish the optimum HPLC chromatographic conditions.
Prefect chromatographic separation of the dalfampridine drug and its oxidative degradation in the mixture solution carried out by using Spheri-5 RP C8 ( 220 X 4.6 X 5 μm particle size) with mobile phase consists of {acetonitrile : 0.02 M KH2PO4 ( 65 : 35 v/v )} at flow rate 1.0 mL min-1 and detected UV at 298 nm.
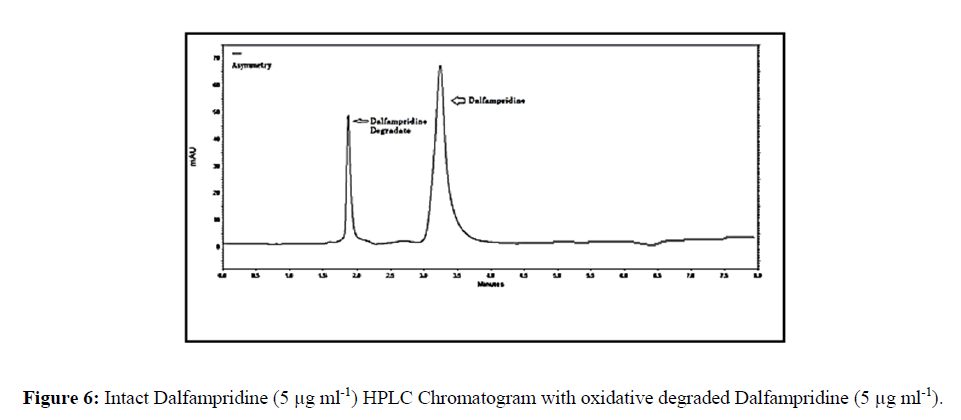
While Retention time (Rt) values for oxidative dalfampridine degradation and intact dalfampridine were setup (2.0+0.03, and 3.5+0.02) minutes respectively, (Figure 6).
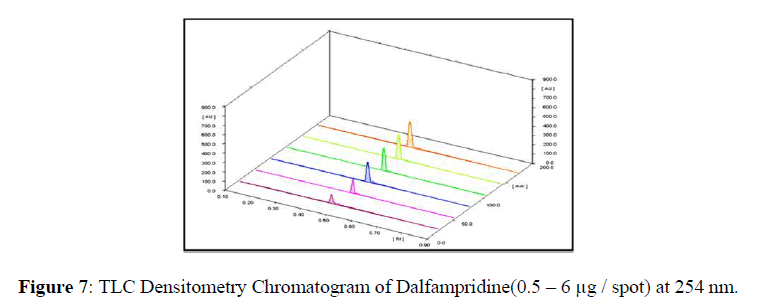
The findings of the TLC apparatus were favorable for the use of chloroform: acetonitrile: methanol (volume 6:3:1) as a developing process. The values of Retention time (Rt) were found to be 0.84 for entire dalfampridine and 0.26 and 0.72 for its oxidative degradate, respectively, as seen in (Figures 7 & 8). The estimation of the separation of dalfampridine at 254 nm was therefore foldable without any intrusion from its oxidative degradation product.
Methods Validation
Effectiveness of the intended methods were imposed per the ICH guidelines (17-20) of reliability, precision, Range and linearity, degree of repeatability, interday precision.
Linearity and range
The regression plot was set to be straight linear for the HPLC technique with a range of (0.2-6 μgml-1) and with a range of (0.5-6 μg/spot) for the TLC technique by plotting the drug concentrations versus peak area in calibration graphs. The linear regression equations form the diagrams were:
For HPLC method y = 0.892 x – 0.104 ………………… (r2 = 0.9997).
For densitometry TLC method y = 2515 x + 1434 ………………… (r2 = 0.9996).
Where r2 is the coefficient determination, x is the concentrations of drug, while y is the area under peak values. As calibration data reported in Table 1.
| Parameters | HPLC Procedure | Densitometric procedure |
|---|---|---|
| λmax | 298 nm | 254 nm |
| Linearity range (µg ml-1) | 0.2 — 6 | 0.5 — 6 |
| LOD (µg ml-1) | 0.054 | 0.098 |
| LOQ (µg ml-1) | 0.179 | 0.325 |
| Working range (µg ml-1) | 0.2 — 6 | 0.5 — 6 |
| - Regression Equation - Slope ± S.D - Intercept ± S.D |
A*= 0.892C**- 0.104 0.892 ± 0.018 - 0.104 ± 0.016 |
A* = 2515 C** + 1434 2515 ± 29.55 1434 ±81.77 |
| Correlation coefficient (r) | 0.9997 | 0.9996 |
Table 1: Spectral Data of Intended HPLC and TLC Densitometric steps for the Estimation of Dalfampridine
Limits of detection and quantitation
Both detection limits (LOD) and quantitation limits (LOQ) were set and calculated from the following equations in relation to the ICH guidelines:
LOD = 3.3 σ / S
LOQ = 10 σ / S
Where S is the slope of the calibration curve and σ is the standard deviationx ofy-intercepts of regression lines.
Accuracy
The intended and planned techniques were done for measuring varied dalfampridine concentrations within their linearity range after calculation of it from their regression equations. RSD% and accuracy of the decided techniques were found and calculated with clear and good results in Table (1).
Precision
Precision was evaluated by calculating 2steps first: interday (Intermediate precision) and Second: intraday (repeatability) precision after run and repeat measurement of the 3 varied concentrations three times in the same day and inspect the sample in triplicate on 3 successive days using the planned techniques. The RSD% satisfying values were calculated and on record in Table (1).
Specificity
The intended specificity of the techniques was confirmed by applying them in addition to its oxidative degradation product to laboratory-prepared mixtures of the entire dalfampridine.
Table 2 showed the selective detection of whole dalfampridine with 99.8 percent of its degradation product for HPLC technique and up to 100.4 percent for TLC-technique adopted by the planned procedures and ±SD percent mean of recovery. The effectiveness of the planned techniques including results was assessed by applying the standard addition technique showing no intrusion from excipients Table 3.
| Intact (µg ml-1) |
Degradate (µg ml-1) |
Degradate % | Intact found (µg ml-1) HPLC |
HPLC Recovery % of Intact | Intact found TLC (µg / spot) |
TLC Recovery % of Intact |
|---|---|---|---|---|---|---|
| 5 | 1 | 16.67 | 4.99 | 99.73 | 5.10 | 101.92 |
| 4 | 2 | 33.33 | 3.97 | 99.16 | 4.01 | 100.31 |
| 2 | 4 | 66.67 | 2.03 | 101.33 | 2.00 | 100.00 |
| 1 | 5 | 83.33 | 1.00 | 100.00 | 0.99 | 99.80 |
| 0.5 | 5.5 | 91.67 | 0.49 | 98.99 | 0.50 | 100.00 |
| Mean ± SD% | 99.84 ± 0.928 | 100.42 ± 0.856 |
Table 2: Detection of Dalfampridine with its oxidative degradation in Mixtures By the Intended HPLC & Densitometric steps
| HPLC-technique | TLC-technique | ||||||
|---|---|---|---|---|---|---|---|
| Taken µg ml-1 | Pure added µg ml-1 |
Pure found (µg ml-1 ) |
Recovery % | Taken (µg / spot) |
Pure added (µg / spot) |
Pure found (µg / spot) |
Recovery % |
| 2 | 4 | 3.98 | 99.46 | 1 | 1 | 1.00 | 100.00 |
| 3 | 3 | 2.95 | 98.28 | 2 | 1.97 | 98.67 | |
| 4 | 2 | 2.01 | 100.43 | 4 | 4.01 | 100.37 | |
| Mean | 99.39 | 99.69 | |||||
| RSD% | 1.080 | 0.905 | |||||
Table 3: Dalfampridine Recovery Study by nominated Standard Addition Technique via the decided HPLC & Densitometric procedure steps in its Tablets.
System suitability parameters were fixed and calculated for dalfampridine in RP-HPLC technique with good and prefect results Table 4.
| parameters | Stability HPLC method For Degradate |
% Degradate |
TLC densitometric method | Reference value |
|---|---|---|---|---|
| Resolution (R) | Neutral hydrolysis (1.18) Photodegradation (1.10) Acidic hydrolysis (1.85) Basic hydrolysis (1.47) Oxidative hydrolysis (2.12) Thermal degradation (1.29) |
20.39 19.54 22.69 21.54 99.20 11.73 |
0.84 | R > 2 |
| Tailing factor (T) | 1.73 | - | 0.96 | T < 2 |
| Capacity factor (K) | 1.56 | - | 1.94 | 1–10 acceptable |
| Theoretical Plates (N) | 2248 | - | 2117 | N > 2000 |
Table 4: System suitability parameters of decided methods for Estimation of dalfampridine
Statistical analysis
In order to compare the capacity of the chosen techniques for determining and detecting dalfampridine in pharmaceutical preparation and setting each of the chosen methods and the recorded spectrophotometric method, the results were presented for statistical analysis Table 5. And the calculated values t and F were less than the theoretical ones, with no considerable differences between the decided and the reported methods.
| Parameters | Stability HPLC method | TLC densitometric method | Reported method* [2] |
|---|---|---|---|
| Number of measurements | 5 | 5 | 5 |
| Mean % recovery of dalfampridine | 99.87 | 99.81 | 99.74 |
| % RSD | 0.686 | 0.612 | 0.696 |
| Student’s t-test** | 0.313 (1.796) | 0.156 (1.859) | —— |
| F-value** | 1.026 (6.094) | 1.290 (6.388) | —— |
Table 5: Intended and the reported methods for estimation of Dalfampridine in Dalfarosis® tablet.
Conclusion
In this work, both chromatographic techniques were developed and applied for the detection and estimation of dalfampridine with its oxidative- degradation product. The advantage of the densitometry TLC- technique is that several samples can be run altogether using a small amount of the mobile phase with less cost and minimal time consuming per analysis, as well as providing sensibility and selectivity.
The intented and decided techniques were set successfully to Dalfarosis® tablet with noticeable interference was found from pharmaceutical formularization excipients.
Compliance with ethical standards
Funding
This Article study has no funded form anywhere.
Conflict of Interest
Author A: Professor Dr. Khadiga M. Kelani declares that she has no conflict of interest with this study.
Author B: (Corresponding author) Dr. Ahmed Mohamed Wafaa Nassar declares that he has no conflict of interest with this study.
Author C: Dr. Wael Talaat declares that he has no conflict of interest with this study.
Author D: Dr. Samir Morshedy declares that he has no conflict of interest with this study.
Ethical Approval
This article does not contain any studies with human participants or animals performed by any of the authors.
References
- S Budavari, M O’neil, A Smith et al. 1989, 5233: p. 845-846.
- K Hayes, M Katz, J Devane et al. J Clin Pharm. 2003, 43 (2003): p. 379-385.
- E Samara, P Winkle, P Pardo et al., J. Clin Pharm. 2014, 54: p. 53-60.
- J Doniparthi. Int J BioMacro. 2020, 144: p. 725-741.
- H El-Fatatry, S Hammad and S Elagamy. J Analyt Techniques. 2013.
- S Thomas, S Shandilya, A Bharti. J Pharm Biomedanaly. 2012, 58: p.136-140.
- M Jain, V Srivastava, R Kumar et al., J Pharm Biomedanaly. 2017,133: p. 27-31.
- C Babu, K Rao, N Devanna et al., Asian J Pharm Clin Res. 2017, 10: p. 334-338.
- A Caggiano and A Blight. J drug assess. 2013, 2: p. 117-126.
- A Mythili, College of Pharmacy, Komarapalayam, 2018.
- B Kovács, F Boda, IFülöp et al., Acta Pharmaceutica. 2020, 70: p. 465-482.
- G Markovic, D Agbaba, DZ Stakic et al., J Chrom A. 1999, 847: p. 365-368.
- B Kovács, F Boda, IFülöp et al., Acta Pharmaceutica. 2020, 70: p. 465-482.
- IHT Guideline, Intconferon harmonization, Geneva, Switzerland, 2005.
- JA Adamovics, Routledge, 2017.

