Research Article - Der Pharma Chemica ( 2018) Volume 10, Issue 7
Developments in Gas Liquid Chromatography Using Liquid Crystals as Stationary Phases
El-Naggar AY1,2*, Altalhi A1 and Alshanbari NF3
1Chemistry Department, Faculty of Science, Taif, 888, Taif University, Kingdom of Saudi Arabia
2Egyptian Petroleum Research Institute, Nasr City, Cairo, Egypt
3Analytical Chemistry Deparment, Faculty of Science, Taif, 888, Taif University, Kingdom of Saudi Arabia
- *Corresponding Author:
- El-Naggar AY
Chemistry Department
Faculty of Science
Taif, 888, Taif University, Kingdom of Saudi Arabia
Abstract
Three liquid crystals (LCs) of different polarities were prepared, characterized and applied as stationary phase in gas chromatography by their coating on chromosorb pink acid washed (P AW) with thickness film 20%. The prepared liquid crystals are Triton x 100-CH3COOH (H1), Triton x 100-KCl (H2) and CTAB-KCl (I1). LCs was characterized by thermal analyzer via differential thermal analysis (DTA) and thermo gravimetric analysis (TGA), in addition to scanning electron microscope (SEM). It has been found that, their maximum recommended temperatures are 200°C. The chromatographic characterization, polarity through McReynolds scheme, selectivity through criterion scheme and efficiency of separation through resolution were studied via inverse gas chromatography. H1 exhibits highest polarity and most selective toward polar compounds compared with the other two LCs, this was compatible with its high efficiency of gas chromatographic separation of alcohol compounds. I1 shows the lowest polarity and less selective stationary phase toward polar solutes than other two LCs, but it has high criterion value using saturated hydrocarbons as solutes, this was reflected on the separation of saturated hydrocarbons giving good separation followed by aromatic hydrocarbons.
Keywords
Liquid Crystals, Stationary phase, Gas chromatography, Thermal analysis, Scanning electron microscope, Polarity, Selectivity.
Introduction
Liquid Crystals (LCs) are promising material because it is the phase of matter existing between the solid and liquid phases [1,2]. There are many types of liquid crystal states, depending up on the amount of order in the material [3-6]. The application of liquid crystals as stationary phases in gas chromatography was reported for the first time by Kelker [7-9], and Dewar and Schroeder [10,11]. They were initially employed in gas chromatography and then also in liquid and supercritical chromatography. There is an existing background of the overall knowledge concerning the liquid crystals properties as chromatographic stationary phases described in papers [8-13].
During the synthesizing of new liquid crystals, they were also investigated as new prospective chromatographic stationary phases. Grajek et al. [14] interpret the chromatographic results of the liquid crystals testing undertaken over a period of approximately the last 10 years. Moreover, we also attempt to anticipate the courses of investigations of the liquid crystals stationary phases (LCSPs).
The liquid crystals, employed as the chromatographic stationary phases, have the ability to separate the components of mixtures, which have a different molecular structure, i.e., structural isomers, position, and optical, even in the case when the differences in their boiling temperatures, fugitives, and molecular masses are negligibly low. The advantages of the chromatographic applications of liquid crystals as the LCSPs are the relatively wide temperature range of their mesophases which is very useful from the point of view of their applications. The rod-like azo-, azoxy compounds, Schiff’s bases, esters, biphenyl, and terphenyl derivatives generally have useful separation properties. In many cases, the LC temperature ranges can be widened by mixing two or more liquid crystalline compounds. The separation properties of the mixed stationary phases are generally better than the single phases. The widely held opinion is that the nematic phases have better separation properties than the smectic and cholesteric phases, but some of them, not being nematics, also have useful separation properties [14].
Materials and Methods
All chemicals were of reagent grade and were used without further purification.
Preparation of liquid crystals
The Triton x 100-CH3COOH (H1) phase was prepared by adding a known mass of the solid surfactant (Triton x 100) and diluting with aqueous 0.1 M, CH3COOH with the mass ratio of the surfactant to aqueous electrolyte being 1:1 (50 wt. % (Triton x 100) with 50 wt. % aqueous 0.3 M CH3COOH).
The Triton x 100-KCl (H2) phase was prepared by adding a known mass of the solid surfactant(Triton x100) and diluting with aqueous 0.1 M KCl, with the mass ratio of the surfactant to aqueous electrolyte being 1:1 (50 wt. % (Triton x 100) with 50 wt. % aqueous M KCl).
The CTAB-KCl (I1) phase was prepared by adding a known mass of the solid surfactant (CTAB) and diluting with aqueous 0.1 M KCl, with the mass ratio of the surfactant to aqueous electrolyte being 1: 1 (50 wt. % CTAB with 50 wt. % aqueous 0.1 M KCl).
The mixture was heated in a water bath, with vigorous stirring to 90°C to solubilise hydrophobic solutes within the micelles 22 and kept in the molten, isotropic micellar solution for at least two hours, after which, slow cooling to room temperature enabled the formation of the polycrystalline H1 and H2 phase, of density 0.895 g cm-3. The notation of the prepared liquid crystals was given in Table 1.
| Notation | Liquid Crystals |
|---|---|
| H1 | Triton 100 –CH3COOH |
| H2 | Triton 100 – KCL |
| I1 | CTAB – KCL |
Table 1: Notation of the prepared samples
Thermal analysis
Thermal analysis (TGA & DTA) was carried out at the temperature range from ambient to 800°C at a heating rate of 10°C/min and under a flow of Ar using Rigaku Thermo Plus 2 TG-DTA TG8120 to trace the structural changes brought about by the thermal treatment.
Scanning electron microscopy (SEM)
Scanning electron microscopy (JEOL-JSM-5400) operating with a 30 keV accelerating voltage was used to examine the morphology of the powders. All samples were mounted on stubs and gold-coated prior to analysis, to make them electrically conductive. The magnification range was about 2500X.
Preparation of stationary phases
The internal volume of packed column was calculated using the formula, i. v. = Л r2 L where Л equal 3.14, r is the column radius and L is the column length. The inert solid support used is chromosorb P AW, the volume of solid support was taken as the same internal volume of column. Thin film 20% of each prepared liquid crystal was weight and dissolved in acetone and methanol then added to the solid support in a way to cover the surface of solid support. The acetone and methanol were evaporated at temperature 50°C using a vapor path with continuous stirring till the liquid crystal was coated as thin film on the surface of chromosorb p. The stationary phase was dried at 120°C in drying oven and packed in a stainless steel column of 2 m length and 1/8 inch internal diameter.
Polarity scheme
The Mcreynolds components, nitro propane, benzene, pyridine, 2-pentanone and butanol in addition to the paraffinic series from pentane to decane were injected at oven temperature 120°C in order to obtain the retention index of each Mcreynolds component. The helium flow rat was maintained at 30 ml. min-1. The paraffinic hydrocarbons from pentane to decane, the alcohols from methanol to hexanol and the aromatics from benzene to xylenes were separated at oven temperature programming starting from 90°C to 160°C at a rate of 10°C min-1.
Selectivity index
Selectivity can be expressed in terms of uniformity criterion  it is used for estimating the degree of separation of multi component mixture; the uniformity criterion was given according to the following equation:
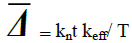
Where, kn is the number of peak on the chromatogram, t is the base width of the narrowest peak keff is the separation factor for worst separated pair of components and T is the duration of analysis.
Chromatographic data
The gas chromatograph used is Perkin Elmer Calrious 580 equipped with flame ionization detector (FID). Helium (oxygen free) was used as the mobile phase for FID at optimum flow rate was 30 ml. min-1. The column used was stainless steel tube of 2 m in length and 1/8 inch of internal diameter. The packed column was activated at 200°C for liquid crystals as stationary phase under flow of helium (30 ml. min-1) for 24 h. The solutes used for chromatographic characterization were selected to cover the wide range of polarity such as n-parrafin, aromatics and alcohols. The polarity indices were assessed with respect to the reference non-polar column SE-30 (20% SE-30 on chromosorb W. A. W., 60-80 mesh). The injector used is splitless injector at temperature 250°C and detector temperature is 300°C.
Results and Discussions
Characterization of liquid crystals
The investigation of physicochemical properties for the chromosorb P as solid support and liquid crystal samples to estimate their applicability as stationary phases in gas chromatography was achieved via thermal analysis through differential thermal analysis (DTA) & thermal gravimetric analysis (TGA) and scanning electron microscopy (SEM).
Thermal analysis
The thermal stability of stationary phases studied through differential thermal analysis (DTA) & thermal gravimetric analysis (TGA) from ambient up to 800°C, in order to assess the maximum recommended temperature for the gas chromatographic analysis. The profiles of TGA and DTA for the parent chromosorb P and the prepared liquid crystal samples H1, H2 and I1 as thin film on the surface of chromosorb P are illustrated in Figures (1-4). The DTA and TGA of parent chromosorb P as solid support were given in Figure 1, it has been shown from DTA that chromosorb P has neither endothermic peaks nor exothermic peaks at the rang of chromatographic temperatures up to 400°C indicating its high thermal stability at the all studied temperature degrees. only one endothermic peak was obtained at about 900°C may be due to the occurrence of phase change. This data was matched with the TGA profile which exhibit two stages of low weight loss, the first is 1.366% at temperature 250°C due to due to the removal of physisorbed water and the second weight loss stage is 1.77 at temperature 980°C may be due to the removal of chemisorbed water.
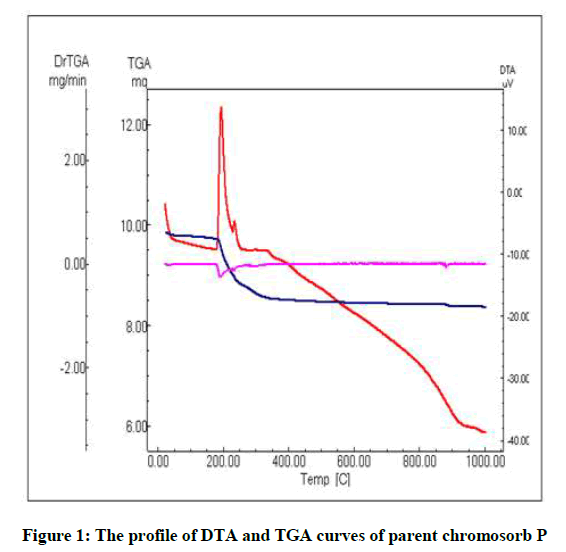
Figure 1: The profile of DTA and TGA curves of parent chromosorb P
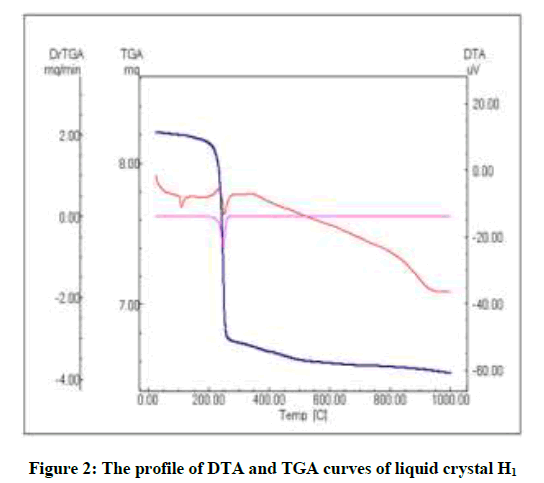
Figure 2: The profile of DTA and TGA curves of liquid crystal H1
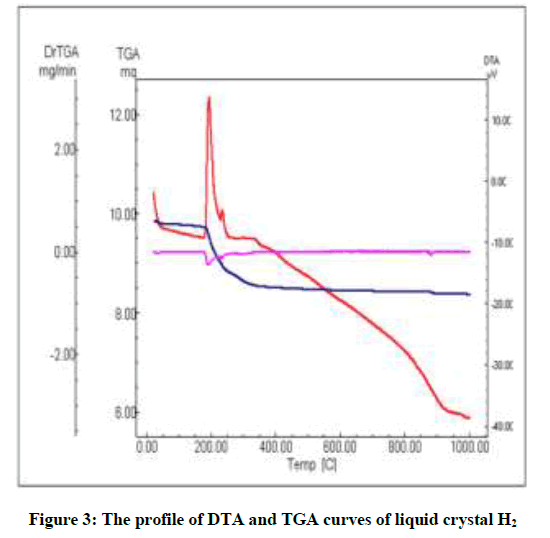
Figure 3: The profile of DTA and TGA curves of liquid crystal H2
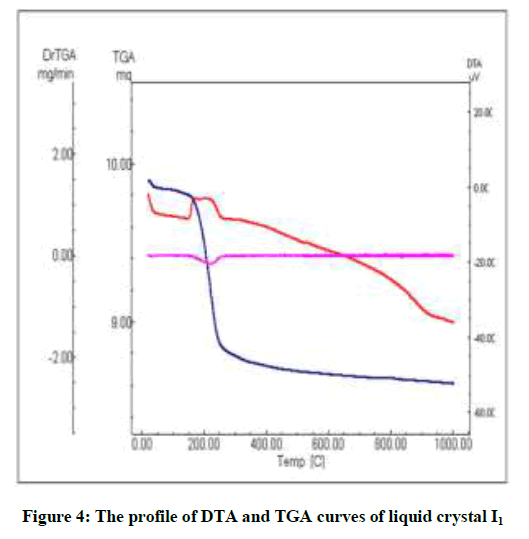
Figure 4: The profile of DTA and TGA curves of liquid crystal I1
The profiles of DTA and TGA of the liquid crystal Titron x 100 washed with acetic acid (H1) were shown in Figure 2. H1 exhibits two endothermic peaks, the fist at 100°C due to the removal of physisorbed water and the second at 250°C. These two endothermic peaks are compatible with the TGA profile of liquid crystal H1 which exhibits two abrupt weight losses. The first one about 0.535% at ≈100°C is due to the removal of physisorbed water. The second stage of weight loss is 17.60% at 300°C may be due to either the removal of chemisorbed water or some phase change. Both DTA and TGA of H1 prove its thermal stability up to 250°C and this is consider as the working chromatographic temperature.
Both DTA and TGA profiles of the liquid crystal Titron x 100 washed with KCl (H2) were shown in Figure 3, H2 exhibits one exothermic peak at about 200°C and reached to 250°C may be due to the decomposition of molecule. The TGA profile of liquid crystal H2 has one small weight loss stage about 0.884% at temperature 150°C represents the removal of small amount of physisorbed water. There is other stage of weight loss (9.535%) at temperature 250°C compatible with the exothermic peak obtained in DTA profile.
The DTA and TGA profiles of the liquid crystal I1 were shown in Figure 4, It exhibits one broad exothermic peak at a range (150-250°C) may be due to phase change and decomposition of molecule. The TGA profile of sample I represents two stages of weight loss the first one is small weight loss stage about 0.637% at temperature 140°C represents the removal of very little amount of physisorbed water. The second stage of weight loss is 10.326% at temperature 300°C compatible with the exothermic peak obtained in DTA profile.
Scanning Electron Microscope analysis (SEM)
The objective of the analysis using SEM is to study the morphology of chromosorb P (parent) and liquid crystal samples. Superstructure of untreated and coated samples was observed to obtain visual image about different surface textural properties, which could reflect on their performance as stationary phase in gas chromatographic separation. The scanning electron micrograph of parent and coated samples by liquid crystals are shown in Figures 5-8 taken at a magnification of 2500X. It is clearly seen from this picture that, the micrograph of chromosorb P sample shows an amorphous structure. In contrast, liquid crystal H1, H2 and I1 samples show pronounced effects on the textural properties of parent chromosorb P. Coating with liquid crystals may lead to closure of the small pores in the primary particles and to a partial closure of the spaces between rounded grains existing between primary particles [15].
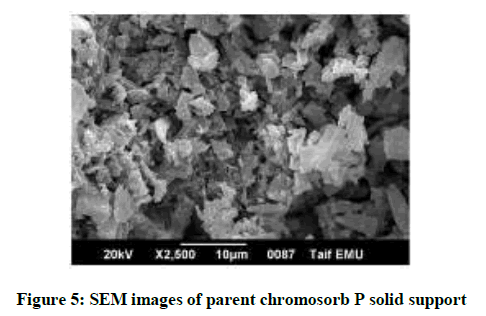
Figure 5: SEM images of parent chromosorb P solid support
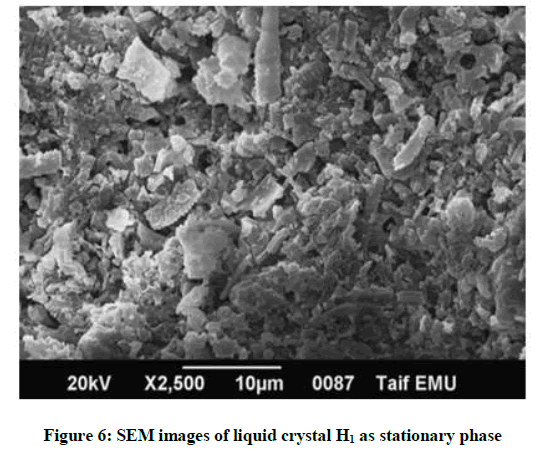
Figure 6: SEM images of liquid crystal H1 as stationary phase
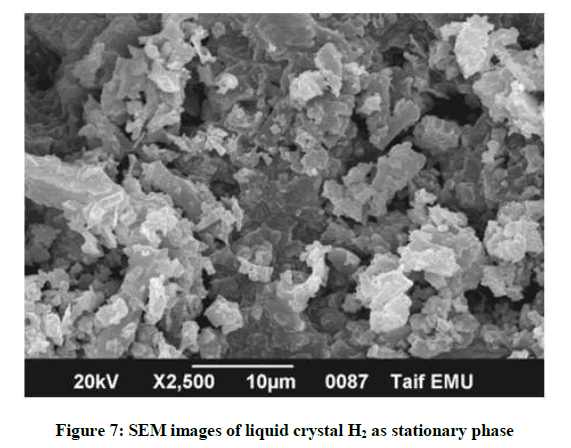
Figure 7: SEM images of liquid crystal H2 as stationary phase
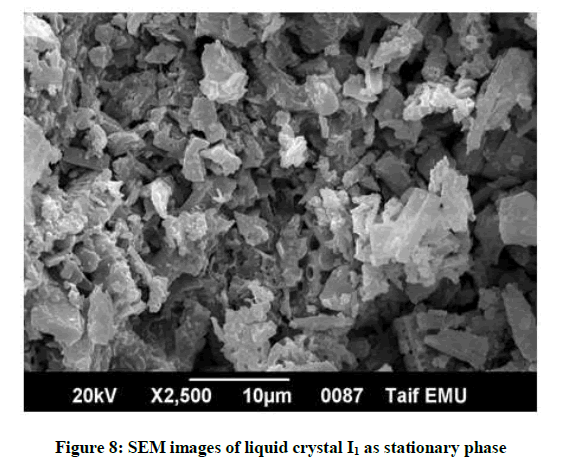
Figure 8: SEM images of liquid crystal I1 as stationary phase
Chromatographic characterization of liquid crystals as stationary phases
Polarity scheme [16]
McReynolds values provide a systematic approach to ranking LC stationary phases by polarity and simplify the task of cross-comparing phases to determine whether they are equivalent. They also are useful for predicting elution orders among related analytes and resolution of analytes from differing chemical families. Values are obtained by measuring the degree to which a phase retains several probe compounds, relative to their retention index (I) by a nonpolar phase (squalane) chosen as the reference standard phase for this calculation.
Characterization and evaluation of the behavior of the studied LC stationary phases according to McReynolds method is based on the determination of retention indices for five solutes namely benzene, nitro propane, pyridine, 1-pentanone and butanol (X, Y, Z, U and S respectively). The five McReynold constants for the studied stationary phases are obtained by calculating the differences observed for each of the substances tested between their retention index on sqalane (Isqualane) and that corresponding to the stationary phase being studied (Iphase), McReynold constants
(ΔI) = Iphase - Isqualane
The polarity of the studied chromatographic column depends according to McReynold conceptions, not only on the stationary phase but also on the solute to be analyzed. Thus each solute from the five selected solutes for this characterization scheme may refer to a certain type of interaction between the polymer stationary phase and solutes.
Generally, The McReynold constants which are related to molecular structures, allow an appreciation of the interactive forces between stationary phase and solute as a function of compound class. The orderly classification of polymer stationary phases with numerical data is very valuable for comparison and selection of column for particular type of analysis. The sum of the five calculated values has been used to define the overall polarity of the phase under test study. McReynolds method used for more investigation concerning the correlation between the molecular structure and the polarities of these liquid crystals towards each type of solutes. McReynold constants of the three prepared liquid crystals as stationary phases are given in Table 2.
| McReynold Compounds | Standard Retention index | Retention index of H1 | ∆I of H1 | Retention index of H2 | ∆I of H2 | Retention index of I1 | ∆I of I1 |
|---|---|---|---|---|---|---|---|
| Benzene (X) | 180 | 493.318 | 313.318 | 374.606 | 194.606 | 530.536 | 350.536 |
| Pyridine (Y) | 160 | 586.505 | 426.505 | 546.457 | 386.457 | 350.089 | 190.089 |
| Nitro propane (Z) | 150 | 395.658 | 245.581 | 552.091 | 402.091 | 335.325 | 185.325 |
| 1- pentanone (U) | 130 | 395.581 | 265.581 | 391.448 | 261.448 | 278.4 | 248.4 |
| Butanol (S) | 110 | 630.339 | 520.339 | 543.948 | 433.948 | 479.922 | 369.922 |
| Summation of ∆I | 730 | 1771.324 | 1678.55 | 1344.272 | |||
Table 2: The difference in retention index of McReynold constants of the studied liquid crystals
From the obtained data the following observations can be outlined: The I1 has the low values of the McReynold constants among the all studied McReynold solutes except benzene compound. These low values suggest that the CTAB-KCl stationary phase poorly retains these compounds that contain the corresponding organic functions.
This leads to low selectivity for these types of compounds. But it has high selectivity toward aromatic and paraffinic compounds due to the low matched low polarity of these organic compounds with that of I1. The overall polarity of the CTAB-KCl stationary phase has the low value reflecting low interactive forces between it and McReynold solutes (except aromatic and paraffinic compounds) as a function of compound class. Triton x 100-CH3COOH has the high values of the butanol McReynold constant reflecting its high selectivity toward alcohol compounds. The overall polarity of the Triton x 100-CH3COOH stationary phase has the high value due to the high interactive forces between it and alcohol compounds.
Selectivity index
Selectivity can be expressed in terms of uniformity criterion [17] it is used for estimating the degree of separation of multi component mixture; the uniformity criterion was given according to the following equation:
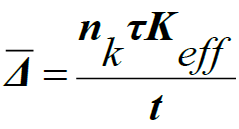
where, nk is the number of peaks on the chromatogram, τ is the base width of the narrowest peak, Keff is the separation factor for the worst separated pair of components, and t is the duration of analysis. Table 3 shows the calculated criterion for model systems comprising saturated hydrocarbons, aromatic hydrocarbons and normal alcohols. It has been found generally that the studied liquid crystals as stationary phases differ in its efficiency of separation according to the nature of separated solutes. Saturated hydrocarbons, aromatic hydrocarbons and normal alcohols can be separated by the prepared LCs but in different degrees of efficiency. CETAB-KCl is the most efficient stationary phase for eluting paraffinic compounds as illustrated from its criterion value ( =0.974) may be due to their low polarity of I1 which is compatible with the polarity of saturated hydrocarbons. This result matches with the studied polarity index. For separating aromatic hydrocarbons, the CETAB-KCl has the highest criterion number ( =0.866). So it is the most efficient stationary phase for separating these hydrocarbons followed by ( =0.711) for H2 stationary phase.
| Families | H1 | H2 | I1 |
|---|---|---|---|
| Paraffines | 0.58 | 0.688 | 0.974 |
| Aromatics | 0. 602 | 0.711 | 0.866 |
| Alcohols | 0.965 | 0.518 | 0.418 |
Table 3: Uniformity criterion for different mixtures using the prepared liquid crystals as stationary phases
Therefore, the high polar liquid crystal Triton x 100-CH3COOH (H1) gives high selectivity value with the solutes of high polarity such as alcohol (Δ=0.965), and gives low value with nonpolar solute like paraffines (Δ=0.580). This means that the polar stationary phase H1 is the most selective one for eluting the polar alcohol compounds, the nonpolar stationary phase exhibits high uniformity criterion number toward aromatic and paraffinic hydrocarbons reflecting its high efficiency of separation of nonpolar compounds. This result agrees well and confirms the previous data obtained on the polarity measurements of the studied LCs.
Efficiencies and applications of liquid crystals
The prepared liquid crystals have different separation efficiencies toward n-paraffines, aromatic hydrocarbons and alcohols. The chromatographic separation depends not only on the polarity of stationary phases but also on the nature and polarity of the separated solutes. The efficiency of gas chromatographic separation for the studied samples can be evaluated in terms of resolution (R), it is used as a quantitative measure of the degree of separation between two adjacent peaks.
R = (2Δt / W1+W2)
Where, R=degree of separation between two adjacent peaks, Δt = the time interval between peaks, W1 = width of the first peak at the base and W2 = width of the second peak at the base.
The separation of n-paraffines (1-C6, 2-C7, 3-C8, 4-C9, 5-C10) is capable of testing nonspecific interaction between solute and the prepared liquid crystals as stationary phases, as given in Table 4, and shown in Figure 9 depicts chromatograms illustrating the separation of n-Alkanes mixture on the prepared columns. The mixture of n-alkanes can be separated with high efficiency by the order: I1, H2 and H1 columns (Δ=0.974, 0.688 and 0.58) respectively. CTAB-KCl (I1) exhibits the most efficient separation of n-alkanes with sharp and symmetrical peaks, this may be related to the less polarity of I1 which is suitable for eluting the nonpolar n- alkane mixture. This result was matched with resolution factor of n-alkanes on the three studied stationary phases that given in Table 4. Triton x 100 treated with CH3COOH (H1) and that treated with KCl (H2) columns can elute n-alkanes but with lower efficiency of chromatographic separation than (I1), this may be due to differences in polarity between them and n- Alkanes.
| LCs | Paraffinic Hydrocarbons | Aromatic Hydrocarbons | Alcohols | ||||||||||
|---|---|---|---|---|---|---|---|---|---|---|---|---|---|
| C9, C10 |
C8, C9 |
C7, C8 |
C6, C7 |
C6, C7 |
C7, C8 |
C8, C9 |
C9, C10 |
C1OH, C2OH | C2OH, C3OH | C3OH, C4OH | C4OH, C5OH | C5OH, C6OH | |
| H1 | 1.84 | 1.72 | 1.61 | 1.4 | 2.19 | 1.69 | 1.54 | 1.39 | 2.49 | 1.79 | 1.54 | 1.43 | 1.267 |
| H2 | 1.79 | 1.61 | 1.39 | 1.22 | 2.37 | 1.88 | 1.47 | 1.4 | 2.18 | 1.68 | 1.31 | 1.26 | 1.06 |
| I1 | 3.64 | 3.33 | 2.69 | 2.54 | 2.59 | 2.26 | 2.07 | 1.86 | 1.75 | 1.46 | 1.14 | 1.06 | 0.89 |
Table 4: Resolution of Paraffines, aromatic hydrocarbons and alcohols on the studied liquid crystals as stationary phases
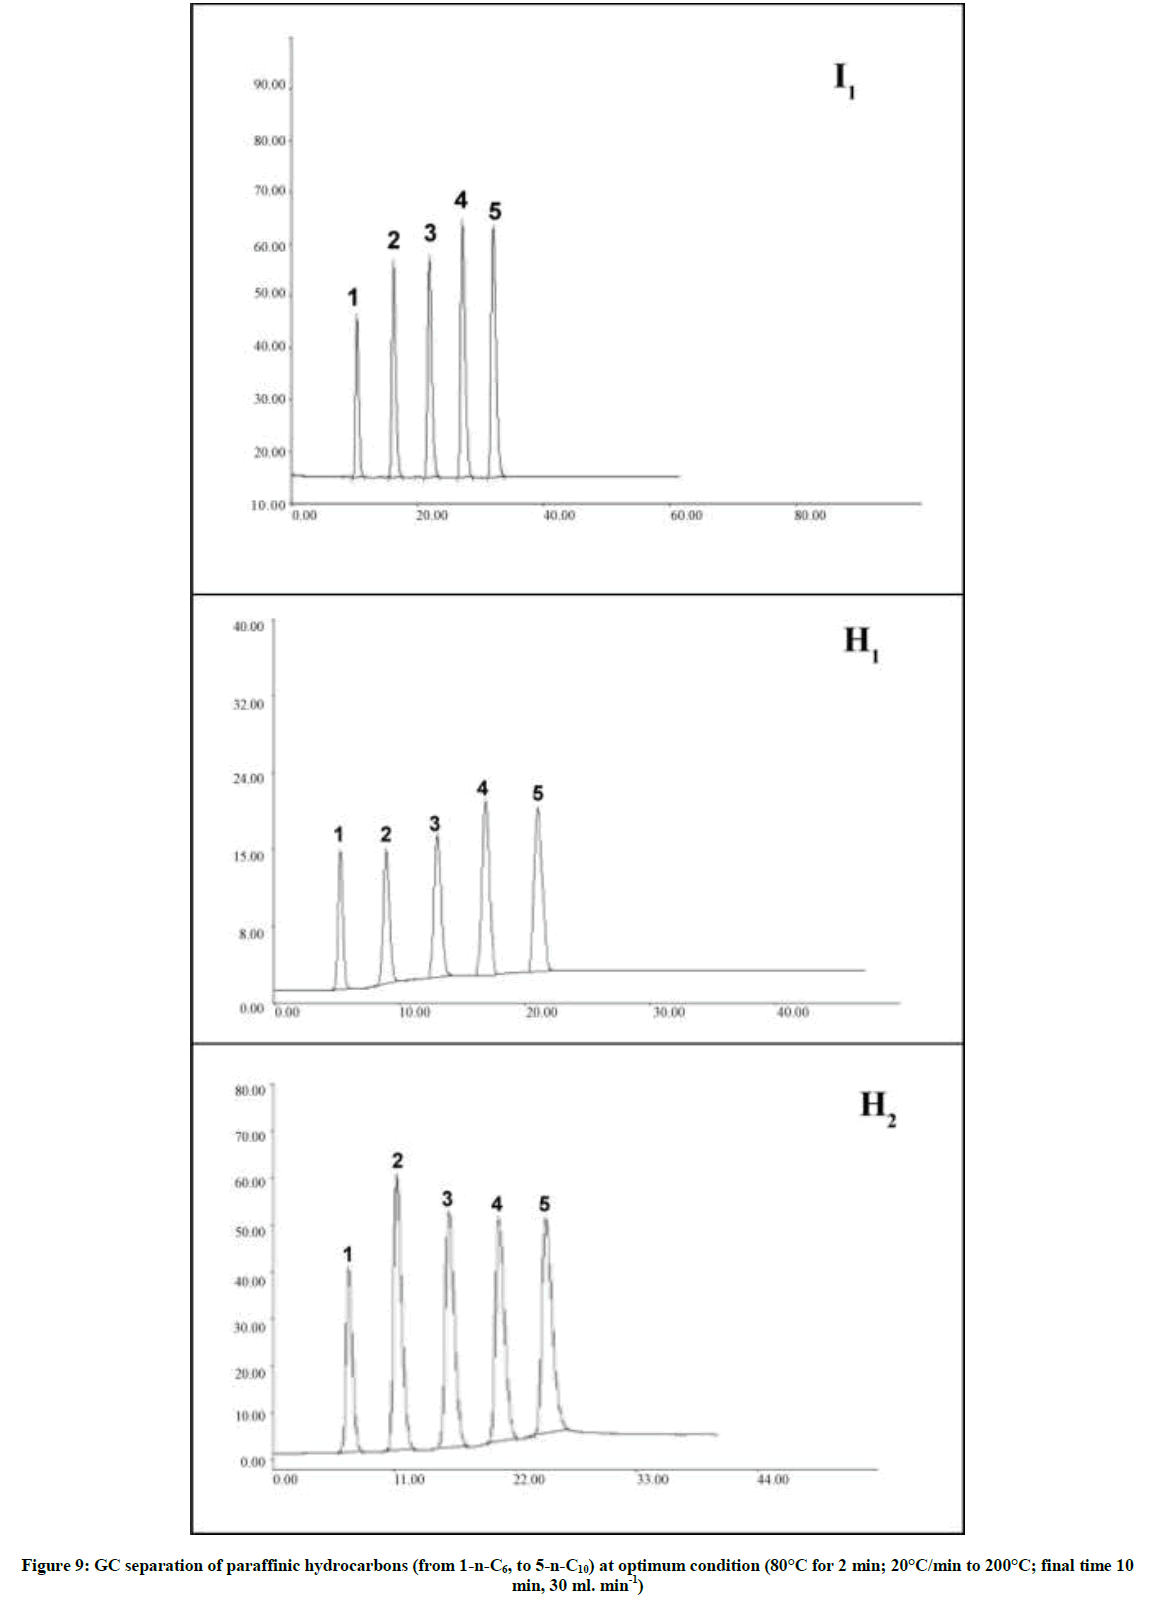
Figure 9: GC separation of paraffinic hydrocarbons (from 1-n-C6, to 5-n-C10) at optimum condition (80°C for 2 min; 20°C/min to 200°C; final time 10 min, 30 ml. min-1)
Table 4 and Figure 10 depict the performance of the studied LCs on the separation of aromatic mixture (Benzene, toluene, ethylbenzene, propylbenzene and butylbenzene). It has been found that CTAB-KCl (I1) has the highest R value for each pair of aromatic hydrocarbons than both H1 and H2 reflecting good chromatographic separation. This may be related to the compatible polarity between CTAB-KCl and aromatic hydrocarbons. The triton x 100 treated with both acetic acid (H1) and potassium chloride (H2) can elute aromatic hydrocarbons with nearly the same degree of separation accompanied with some increase in peak width compared with that produced using CTAB-KCl stationary phase.
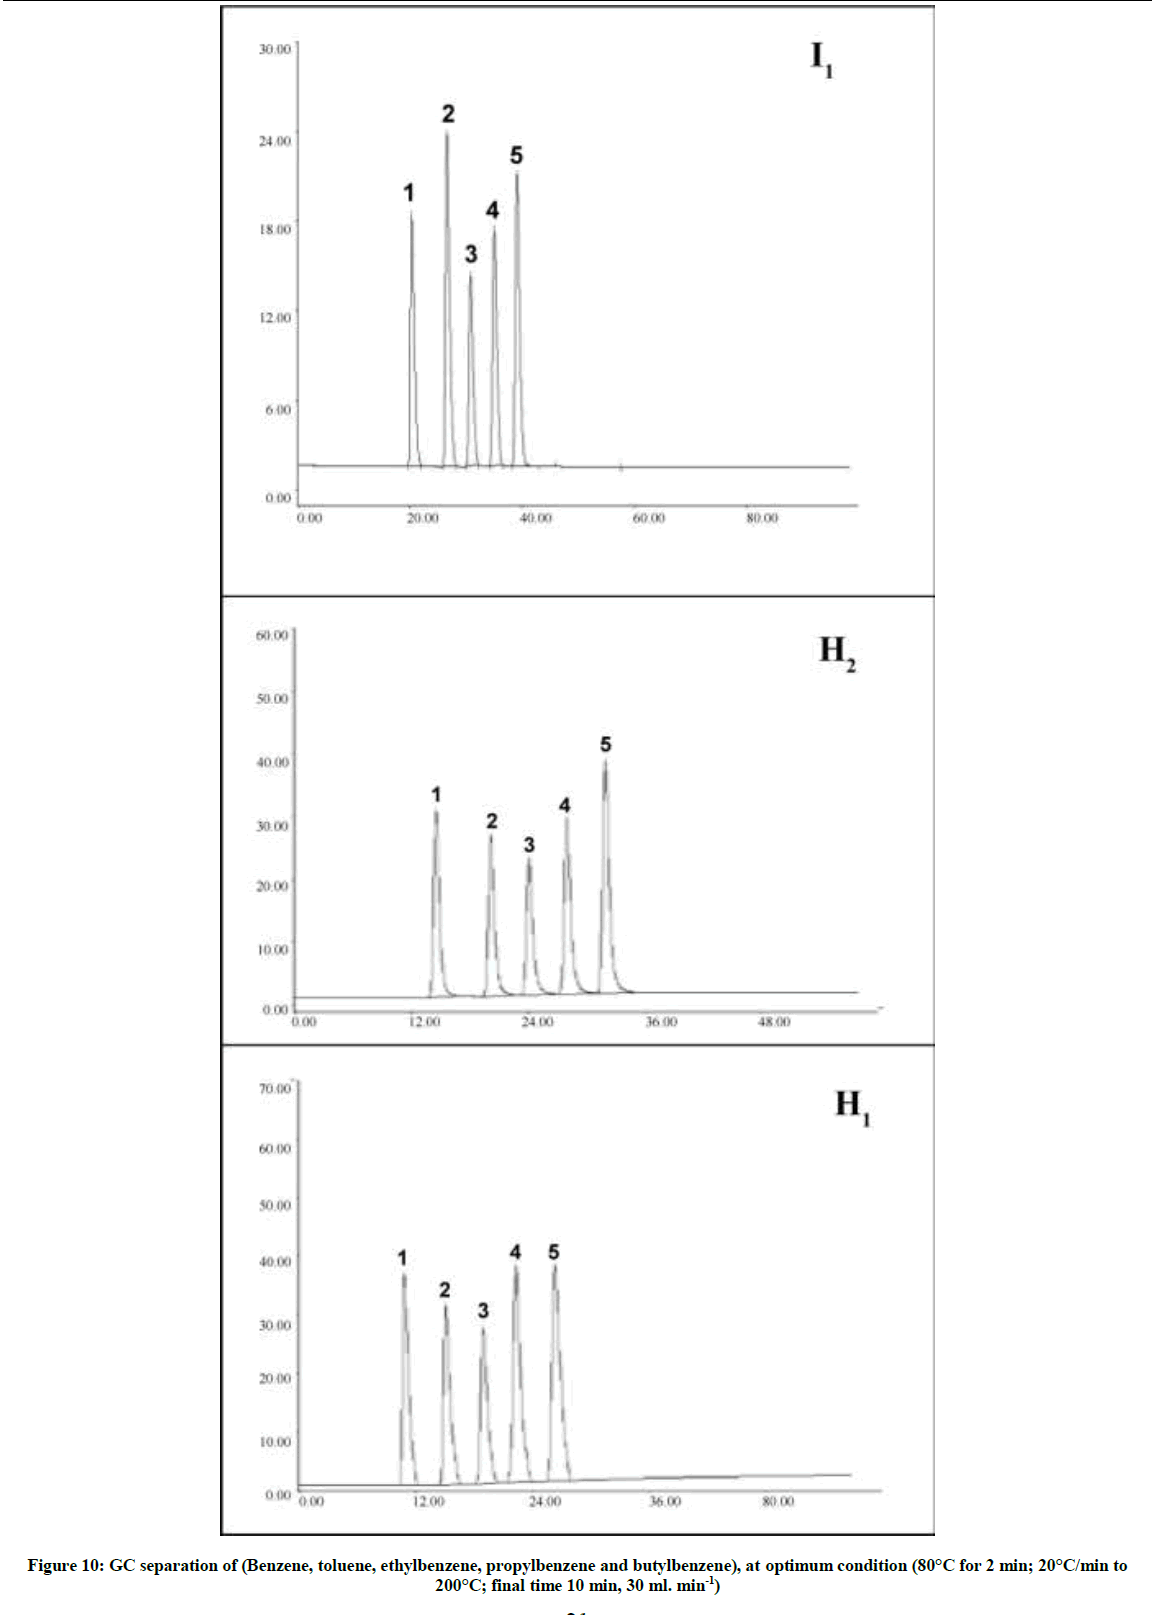
Figure 10: GC separation of (Benzene, toluene, ethylbenzene, propylbenzene and butylbenzene), at optimum condition (80°C for 2 min; 20°C/min to 200°C; final time 10 min, 30 ml. min-1)
Alcohol compounds such as methanol, ethanol, propanol, butanol, pentanol and hexanol) are the most polar organic compounds which interact with the surface of liquid crystals evolving different separation efficiencies. The resolutions of alcohol compounds on the studied stationary phases were given in Table 4. The gas chromatographic separation of alcohols was shown in Figure 11. The resolution of triton x100 treated with acetic acid (H1) exhibits the highest value compared with other stationary phases. So, the prepared H1 can elute alcohols with symmetrical and sharp peaks (Figure 11), due to its high polarity as discussed above. This data was matched with its high criterion value.
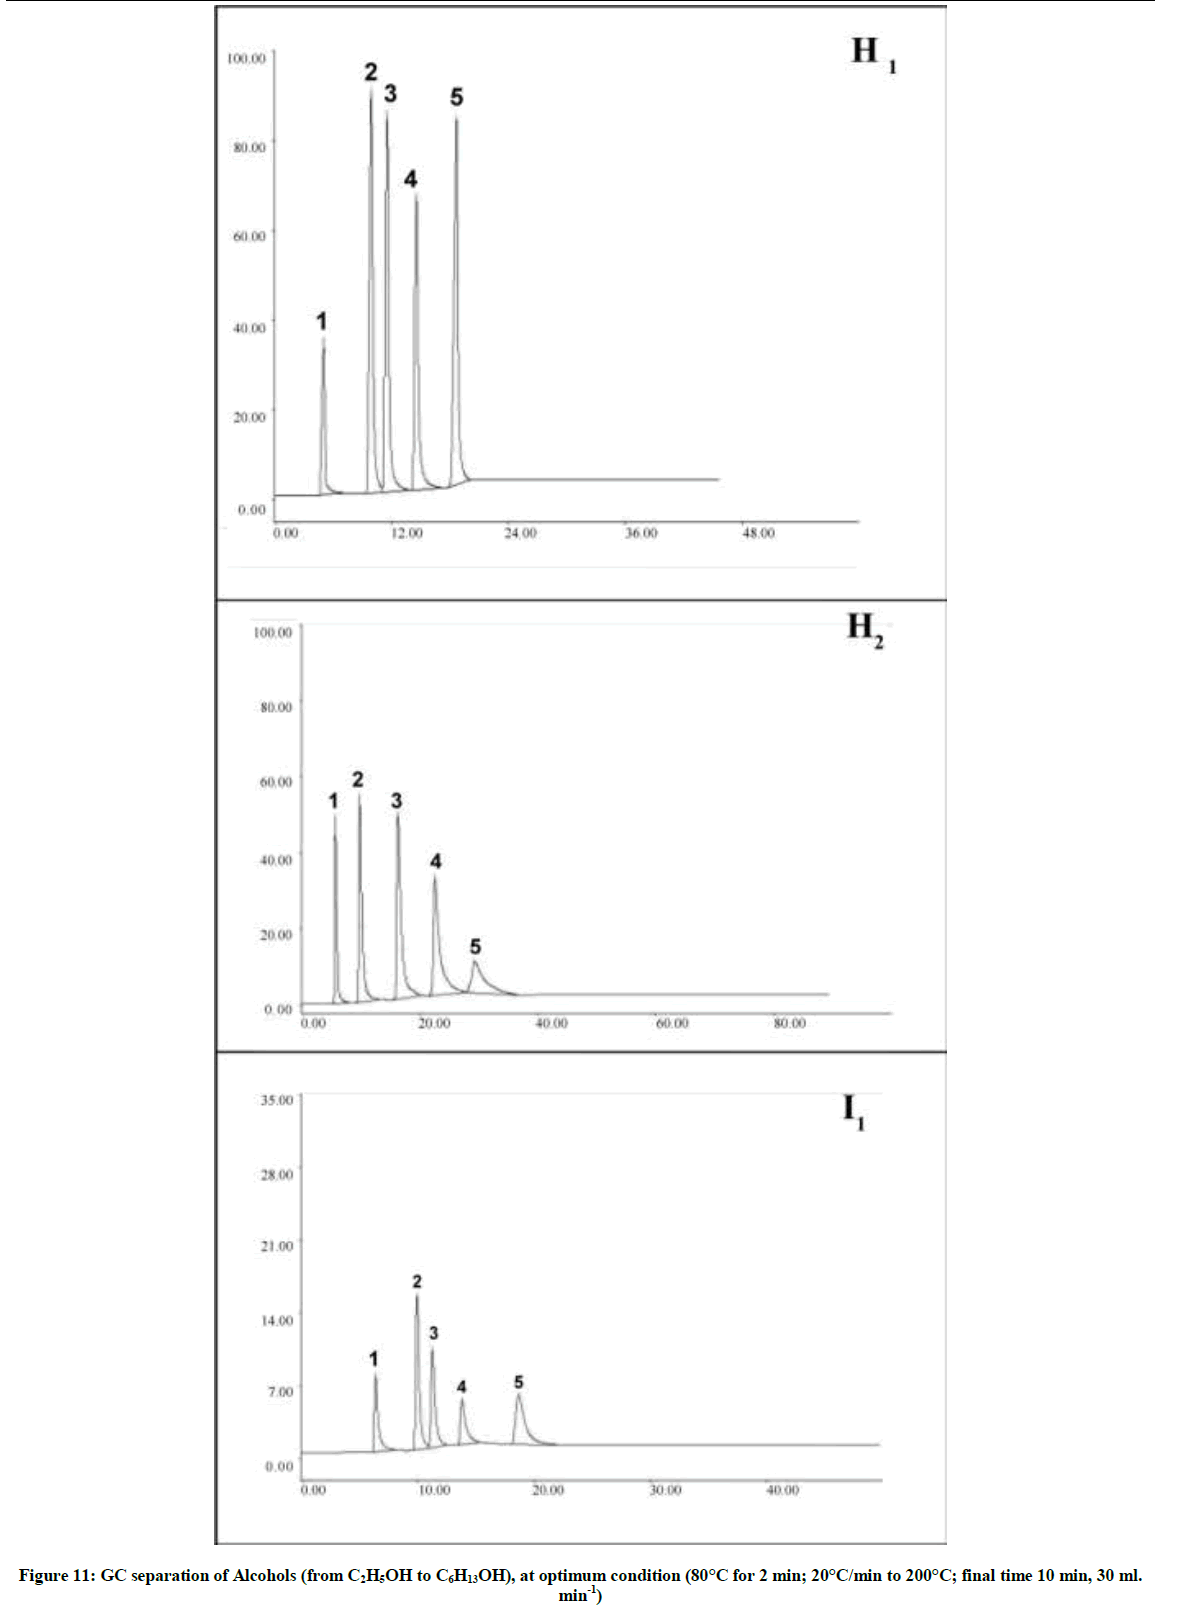
Figure 11: GC separation of Alcohols (from C2H5OH to C6H13OH), at optimum condition (80°C for 2 min; 20°C/min to 200°C; final time 10 min, 30 ml. min-1)
Triton x 100 treated with potassium chloride (H2) has resolution values for alcoholic compounds lower than that in H1. So, the separation efficiency of alcohol compounds on the liquid crystal H2 show neither good nor bad separation as shown in Figure 11. CTAB-KCl can elute alcohols with unsymmetrical peaks and much skewed peaks with a long tail (Figure 11), due to its low polarity as discussed above, this data was matched with its low polarity and low criterion value.
Conclusion
The liquid crystals Triton x100-CH3COOH (H1), Triton x100-KCl (H2) and CTAB-KCl (I1) were prepared, charaterized and selected as stationary phase in gas chromatography. These liquid crystals tack our attention because of their unique thermal analysis and scanning electron microscope. The thermal stability of the prepared three liquid crystals via differential thermal analysis and thermogravimetric analysis indicate that they are stable at temperature 200°C. Scanning electron microscopy for The parent chromosorb P shows an amorphous structure, and that for liquid crystals H1, H2 and I1 show pronounced effects on the textural properties of parent chromosorb P. Coating with liquid crystals may lead to closure of the small pores in the primary particles and to a partial closure of the spaces between rounded grains existing between primary particles.
Gas chromatographic characterization was followed by polarity assessment through McReynold and determination of the selectivity through uniformity criterion using different probes as representatives of their corresponding families with the investigated stationary phases. McReynold scheme helps to identified and arranged liquid crystal stationary phases according to their polarities, also, it is investigate the correlation between the molecular structure and the polarities of these liquid crystals towards each type of solutes. Selectivity can be expressed in terms of uniformity criterion that used for estimating the degree of separation of multi component mixture. CETAB-KCl has high criterion value (=0.974) using saturated hydrocarbons. This result was matched with its low polarity value through McRenold system. This was reflected on its high efficient of separation of these compounds.
While conventionally Titron x 100 - acetic acid was preferred for separating high polar organic compounds such as alcohols, this result was conformable with its highest polarity and its high criterion value toward polar compounds compared with the other two LCs. CETAB-KCl exhibits good separation performance for n-paraffinic and aromatic hydrocarbons. CTAB-KCl represents low polarity and maximum criterion value toward paraffinic hydrocarbons reflecting good separation of these hydrocarbons and can separate aromatic hydrocarbons but with moderate polarity and selectivity values.
References
- H. Hada, K. Takaoka, M. Saikawa, Y. Yonezawa, Bull. Chem. Soc. Jpn., 1981, 54, 1640.
- Y. Yonezawa, M. Okai, M. Ishino, H. Hada, Bull. Chem. Soc. Jpn., 1983, 56, 2873.
- I. Dierking, Textures of Liquid Crystals, Wiley-VCH, 2003.
- I.C. Khoo, S.T. Wug, World Scientific., 1993.
- S.D. Lee, J. Chem. Phys., 87, 4972-4974, 1987.
- S.D. Lee, J. Chem. Phys., 89, 7036-7037, 1989.
- H. Kelker, Fresenius J. Anal. Chem., 1963, 198, 254-266.
- H. Kelker Ber Bunsenges, Phys. Chem., 1963, 86, 698.
- H. Kelker, R. Hatz, Handbook of liquid crystals, Weinheim, Chemie Verlag, 1980.
- M.J.S. Dewar, J.P. Schröeder, J. Am. Chem. Soc., 1964, 86, 5235-5239.
- M.J.S. Dewar, J.P. Schröeder, J. Org. Chem., 1965, 30, 3485-3490.
- Z. Witkiewicz, J. Chromatogr., 1982, 251, 311-337.
- Z. Witkiewicz, J. Chromatogr., 1989, 466, 37-87.
- H. Grajek, Z. Witkiewicz, M. Purchała, W. Drzewiński, Chromatographia., 2016, 79(19), 1217-1245.
- P. Uhlmann, S. Schneider, J. Chromatogr., 2002, A 969, 73.
- B.R. Kersten, C.F. Poole, K.G. Furton, J. Chromatogr., 1987, 411, 43-59.
- T.J. Stark, P.A. Larson, R.D. Dandeneau, Proc. 5th, Int. Symp. Capillary Chromatogr., 1983, 65.


