Research - Der Pharma Chemica ( 2021) Volume 13, Issue 1
Quantitative Structure-Activity Relationship and Molecular Modeling Studies on a series of constrained (L-)-S-adenosyl-L-homocysteine (SAH) analogues acting as DNA methyltransferase inhibitors.
Arshita Jindal1, Anjali Sharma1 and Neeraj Agarwal1*Neeraj Agarwal, Department of Biotechnology, Meerut Institute of Engineering and Technology, Meerut 250005, India, Email: neeraj.agarwal@miet.ac.in
Received: 08-Jul-2020 Accepted Date: Jan 21, 2021 ; Published: 28-Dec-2020
Abstract
DNA methyltransferases catalyses the transfer of methyl group to DNA. However, in the current study, a series of DNA methyltransferase inhibitors and new compound with better efficacy were predicted. Hence quantitative structure activity relationship (QSAR) studies were done on the series of constrained (L-)-S-adenosyl-L-homocysteine (SAH) analogues acting as DNA methyltransferase inhibitors, and afterwards followed by molecular modelling which gives cross-validated result (r 2 cv) of 0.653 carried out by Leave one out (LOO) method, and predicted (r 2 pred.) is 0.600 with coefficient of correlation of (r) get by the multiple regression analysis is 0.934. Based on the model generated by the quantitative structure-activity relationship (QSAR) series of new compounds have been generated. Then these compounds were docked with the protein and ADME properties of each of the newly proposed compounds were studied using SwissADME that highlights properties of the compounds, their lipophilicity, solubility, drug likeliness, pharmacokinetics, etc. Toxicity prediction of these compounds is also made using PROTOX 2, making them suitable leads against DNA methyltransferase.
Keywords
DNA methyltransferase, QSAR, Molecular Docking, ADME, Toxicity.
Introduction
DNA functional unit is the nucleosome, as it stand alone within the nuclear context and determines if gene is expressed or not [1]. Addition of Methyl group at fifth position of the cytosine inactivates gene expression [2]. Most important epigenetic factor is DNA methylation which is operated by DNA methyltransferase enzymes [3]. Afterward, complexity is added because of the effect of histone deacetylases and acetylases by controlling the acetylation at lysine tails [4]. In addition, deacetylases and acetylases are able to attach and modulate DNMTs [5]. When histone protein undergo phosphorylation and methylation led to the detection of histone methyltransferases, histone demethylases [6].
Noncoding RNA’s discovers as epigenetic set that are managed by epigenetic machinery and leads to the detection of DNA demethylases [7] the TET (ten-eleven translocation) enzymes, is responsible for conversion of 5-methylcytosine to 5-hydroxymethylcytosine which resulted in more complexity of cell [8]. DNA methylation inhibitors (DNMTI) were thought to be most responsible cause for cancer development and progression. DNA methylation regulates gene expression of higher eukaryotes is a major epigenetic modification. DNMTs works by the formation of additional covalent bond of a methyl group from S adenosyl-L-methionine to the 5-position of cytosine, within CpG dinucleotides [9].
Azacytidine and decitabine are successful epigenetic (figure 1). DNA methyltransferase (DNMT) inhibitors are used as epigenetic modulators, they are relatively toxic and have poor chemical stability [10]. Quantitative structure activity relationship (QSAR) models are extensively used in drug discovery to check the activity of untested chemicals. . In our current study, QSAR model has been prepared, by implementation of that model we are able to design some new molecules of higher activity and safer in terms of toxicity. The ADME parameters for such molecules have also been filtered with the help of SwissADME. Also, we checked their hepatotoxicity, carcinogenicity, mutagenicity, cytotoxicity with the help of ProTox-ll.

Figure 1: Licensed compounds available in the market.
Materials and Methods
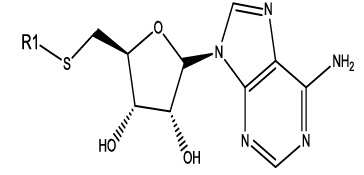
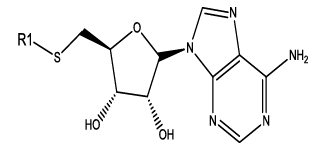
We have considered a series of twenty-four molecules of Constrained (L-)-S-adenosyl-L-homocysteine (SAH) analogues acting as DNA methyltransferase inhibitors [11] which were evaluated for their anticancer activity. Compounds (listed in table 1) of above series are recited with their anticancer activity. The most compelling parameters governing the activity of the compounds were found to be harmonic topological index proposed by narnumi (hatov), most negative charge on H atom (QHmin), slogP contribution and surface area contributions (slogP) and radial distribution function 85/weight by relative vander waal volume (RDF85v). ChemDes, a freely web-based platform (used for calculation of molecular descriptors and instantly [12]) is used for calculating all these parameters. Parameters used for equation shows negligible correlation. Docking studies were performed on the predicted compounds to examine the interactions between the protein (PDB id 3PTA) [13], and for docking studies Molegro Virtual Docker was used and a new series of 10 compounds were designed and ADME/T properties were checked by using SwissADME[14] (a web server that gives access to predictive models for calculating drug-likeness, pharmacokinetics, with in-house methods such as the BOILEDEgg, Bioavailability Radar and iLOGP it verifies Lipinski, Ghose, veber, Egan and Muegge rule [15]) and PROTOX-II. Toxicity of these compounds were predicted with the help of ProTox-II where mutagenicity, carcinogenicity and many other endpoints like cytotoxicity, immunotoxicity and hepatotoxicity were checked [16].
 |
||||||||||
| Comp | R1 | HA | QH | SA4 | R85V | log(1/IC 50) | ||||
| Obsd | Calculated | Predicted (LOO) | ||||||||
| 1 | 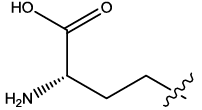 |
2.977 | 0.03 | 12.65 | 6.03 | 6.09 | 5.93 | 5.09 | ||
| 2 | 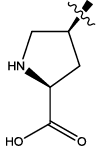 |
3.006 | 0.03 | 12.65 | 8.77 | 5.96 | 6.24 | 6.53 | ||
| 3 | 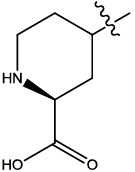 |
2.953 | 0.03 | 19.07 | 5.65 | 5.10 | 5.20 | 5.23 | ||
| 4b | 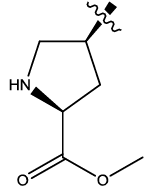 |
2.814 | 0.03 | 12.65 | 6.73 | 5.40 | 5.54 | - | ||
| 5 | 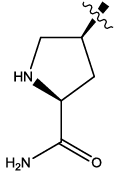 |
2.962 | 0.03 | 12.65 | 7.57 | 6.30 | 6.02 | 5.97 | ||
| 6b | 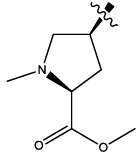 |
2.661 | 0.03 | 12.65 | 11.28 | 5.35 | 5.49 | - | ||
 |
||||||||||
| Comp | R1 | HA | QH | SA4 | R85V | log(1/IC 50) | ||||
| Obsd | Calculated | Predicted (LOO) | ||||||||
| 7 | 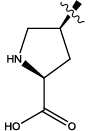 |
2.813 | 0.03 | 12.65 | 6.09 | 5.32 | 5.48 | 5.51 | ||
| 8c | 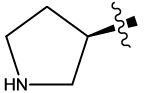 |
2.813 | 0.03 | 12.65 | 6.09 | 4.36 | 5.48 | - | ||
| 9 | 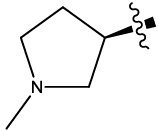 |
2.636 | 0.03 | 12.65 | 7.47 | 5.35 | 5.11 | 4.77 | ||
| 10 | 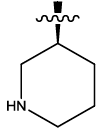 |
2.768 | 0.03 | 19.07 | 6.68 | 5.09 | 4.78 | 4.79 | ||
| 11 |  |
2.768 | 0.03 | 19.07 | 5.48 | 4.72 | 4.68 | 4.68 | ||
| 12b |  |
2.768 | 0.03 | 19.07 | 5.48 | 4.51 | 4.68 | - | ||
| 13 |  |
2.793 | 0.03 | 25.49 | 6.10 | 4.03 | 4.16 | 4.34 | ||
| 14 |  |
2.863 | 0.04 | 6.23 | 4.99 | 4.35 | 4.60 | 4.87 | ||
| 15 |  |
2.777 | 0.03 | 12.65 | 5.48 | 5.67 | 5.34 | 5.30 | ||
| 16 |  |
2.827 | 0.04 | 6.23 | 4.57 | 4.74 | 4.47 | 4.20 | ||
 |
||||||||||
| Comd | R1 | R2 | R3 | HA | QH | SA4 | R85V | >log(1/IC 50) | ||
| Obsd | Obsd | Obsd | ||||||||
| 17 | H | CO2H | H | 3.006 | 0.03 | 12.65 | 6.10 | 5.96 | 6.02 | 6.05 |
| 18b | H | CO2H | Cl | 2.749 | 0.03 | 12.65 | 7.40 | 6.09 | 5.42 | - |
| 19 | H | H | H | 2.813 | 0.03 | 12.65 | 6.16 | 5.32 | 5.49 | 5.52 |
| 20 | H | H | Cl | 2.568 | 0.03 | 12.65 | 6.63 | 4.44 | 4.85 | 5.16 |
| 21c |  |
CO2H | H | 3.004 | 0.03 | 18.21 | 11.38 | 5.43 | 5.90 | - |
| 22 | 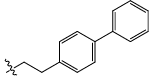 |
CO2H | Cl | 2.828 | 0.03 | 18.21 | 13.75 | 5.60 | 5.61 | 5.64 |
| 23c | 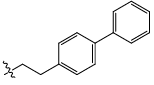 |
H | H | 2.879 | 0.03 | 18.21 | 11.73 | 4.82 | 5.59 | - |
| 24 | 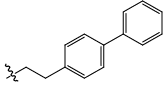 |
H | Cl | 2.708 | 0.03 | 18.21 | 13.11 | 5.32 | 5.22 | 5.18 |
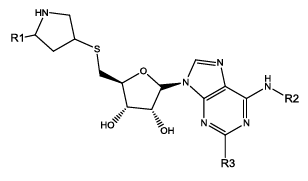
Table 1: Constrained (L-)-S-adenosyl-L-homocysteine (SAH) analogues. their physiochemical parameters and DNA methyltransferase inhibition activity.
QSAR Results
The bifurcation of the table 1 molecules has been done into two groups i.e. training set and test set. And such bifurcation done arbitrarily considering that wide variation should be present along with the good span of their biological activity. The molecules having superscript “b” of table 1 molecules are considered as test set molecules, while with superscript “c” are not considered for the model generation and considered as outliers, because of their aberrant behaviour. Hansch analysis (Multiple regression analysis) of training set, exhibit the following correlation.
log(1/IC50) = 2.764(1.178) Hatov -156.107(57.735) QHmin - 0.099(0.039) slogpvsA4 +0.083(0.061) Rdf85v +3.142(4.204) (1)
n = 17 r = 0.934 s = 0.267 F (4,19) = 20.431(4.50) r2cv=0.653 r2pre= 0.600
where ‘n’ signify the number of training set molecules, ‘r’ signify the correlation coefficient, s is the standard deviation, ‘r2cv’ is the square of the cross-validated correlation coefficient which is procure from jackknife procedure LOO (leave one out), ‘F’ signify the Fischer ratio between the difference of calculated and observed activities, and the figure within the parentheses with ‘+’/ ‘-’ sign are 95% confidence intervals and the data within the parentheses for F is the standard F-value at 99% level. IC50 is the molar concentration of the compound at 50% enzyme inhibition. Correlation expressed by (1) is quite significant and most significant parameters are harmonic topological index proposed by narnumi (Hatov), most negative charge on H atom (Qhmin), slogP contribution and surface area contributions (slogpA4) and radial distribution function -085/weight by relative vander waal volume (RDF85V). These parameter shows negligible correlation that cited in table 2.
| 1HA | 2QH | 3SA4 | 4R85V | |
|---|---|---|---|---|
| 1HA | 1.000 | 0.057 | 0.113 | 0.093 |
| 2QH | 1.000 | 0.592 | 0.184 | |
| 3SA4 | 1.000 | -0.138 | ||
| 4R85V | 1.000 |
Table 2: Correlation between the significant parameters.
Highly significant correlation is expressed by (1), and its validation can be determined by r2cv and r2pred. values, which are 0.653 and 0.60, respectively. The r2cv was calculated by given equation below:
r2cv = 1 − [Σi (yi,obsd − yi,pred )2 / Σi (yi,obsd – yav,obsd )2 ] (2)
where, yi,pred and yi,obsd define as predicted(from Leave one out) and observed activity values of compound respectively, and yav,obsd is the average of observed activities of compounds that were used the correlation. If r2cv > 0.60, then correlation is valid. From this perspective, the correlation expressed by (1) seems to be legal. However, the model’s predictive proficiency was estimated by predicting the biological activity of the all compounds that are used as test set. r2pred, can be estimated as follows
r2pred = 1 − [Σi (yi,obsd − yi,pred )2 / Σi(yi,obsd − yav,obsd )2 ] (3)
where, yi,pred and yi,obsd are predicted(from Leave one out) and observed activity values of compound, respectively and yi,obsd is identical as in (2). In test set compounds, predicted biological activity values from (3) are given in Table 1. A comparative analysis between predicted values and observed values displays that the predicted values are in great coincide with the corresponding observed ones. Graphical representation between observed and predicted activities provides better analysis for compound as shown in figure 2 of both test set and training set. Some new potential compounds were predicted (Table 3) on the basis of (1). These compound have more potency. For the prediction of new compound the structure of predicted compounds were modified and the variables were applied in (1) to calculate their activity. The activity of predicted compound were higher than any other compound in present series (Table1).
| Comp | Structure | HA | QH | SA4 | R85V | IC50 |
|---|---|---|---|---|---|---|
| 1 | 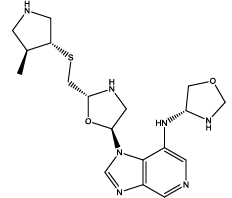 |
2.58 | 0.02 | 13.15 | 7.54 | 6.47 |
| 2 | 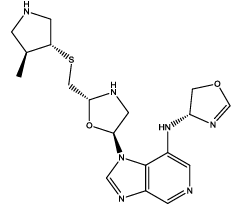 |
2.63 | 0.02 | 13.15 | 5.06 | 6.40 |
| 3 | 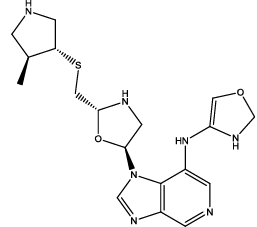 |
2.64 | 0.02 | 13.15 | 7.31 | 6.62 |
| 4 | 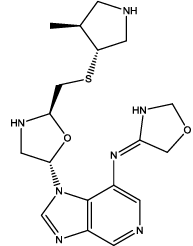 |
2.61 | 0.02 | 13.15 | 8.23 | 6.61 |
| 5 | 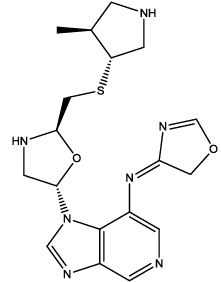 |
2.67 | 0.02 | 13.15 | 4.14 | 6.44 |
| 6 | 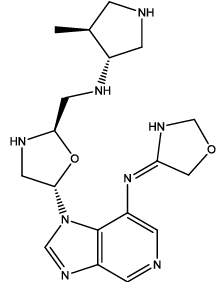 |
2.96 | 0.02 | 13.15 | 4.98 | 7.31 |
| 7 | 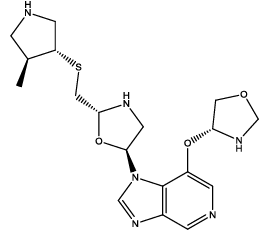 |
2.6 | 0.02 | 13.15 | 7.47 | 6.52 |
| 8 | 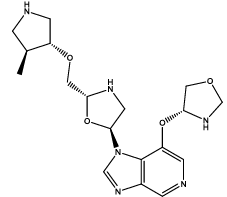 |
2.97 | 0.02 | 13.15 | 6.36 | 7.45 |
| 9 | 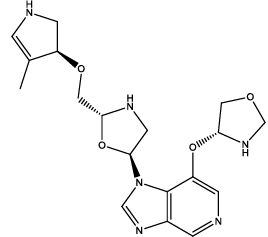 |
3.05 | 0.02 | 13.15 | 4.98 | 7.56 |
| 10 |  |
2.07 | 0.01 | 13.15 | 8.06 | 6.66 |
Table 3: Some proposed compounds belonging to the series of Table1 and their activities predicted from (1).

Figure 2: A plot between observed and predicted DNA methyltransferase inhibition activities of compounds of Table 1: (a) for training set; (b) for test set.
Docking Results
Computer aided drug discovery become a rapid assessment to perform various function such as lead optimization, identification and virtual screening [17] [18] [19]. Molecular docking uses computation method for the prediction of ligand-receptor complex. For docking we used molegro virtual docker protein validation was done where protein gets validate by iterated simplex algorithm and mol dock score with RMSD score 0. Protein used for docking was taken from Protein Database (having PDB ID 3PTA). Docking results are cited in table 10 along with the comparative studies with two marketized drugs namely azacitidine and decitabine. Compound (9) shows the highest hydrogen bonds as shown in figure 3. Hydrophobic interaction of compound 9 in shown in figure 4.

Figure 3: A model showing hydrogen bond interactions of predicted compound 9 (Table 2) with the amino acid residues in enzyme DNA methyltransferase.

Figure 4: The model showing hydrophobic interactions of predicted compound 9 (Table 2) with the enzyme DNA methyltransferase. The red surface shows strong hydrophobic zone and the blue one low hydrophobic zone.
ADME Result
Lipophilicity
Lipophilicity can be defined as partition coefficient (log Po/w) between n-octanol and water. SwissADME allows admittance to five predictive models; XLOGP3, an knowledge based atomistic method for the prediction of model [20]; WLOGP, is a purely atomistic method it is based on fragmental system given by Wildman and Crippen[21]; MLOGP, which gives a relationship with an archetype of topological method and 13 molecular descriptors implemented [22] [23]; SILICOS-IT, it relies on 7 topological descriptors and 27 fragments [24]; and last iLOGP, which is a physics-based method that will be calculated by Generalized-Born and solvent accessible surface area (GB/SA) model. Results are cited in table 4 comparable with marketized drug and the predicted compounds shows better lipophilicity.
| Compound | iLOGP | XLOGP3 | WLOGP | MLOGP | Silicos-IT Log P | Consensus Log P |
|---|---|---|---|---|---|---|
| 1 | 2.21 | 0.09 | -1.13 | 0.18 | -0.18 | 0.24 |
| 2 | 2.3 | 0.35 | -0.64 | 0.51 | 0.49 | 0.60 |
| 3 | 2.15 | 0.81 | -0.65 | 0.1 | -0.19 | 0.44 |
| 4 | 2.4 | -0.14 | -0.64 | 0.51 | 0.89 | 0.60 |
| 5 | 2.42 | 0.36 | -0.16 | 0.83 | 1.56 | 1.00 |
| 6 | 2.64 | -1.22 | -1.79 | -0.26 | 0.01 | -0.12 |
| 7 | 2.27 | 0.08 | -0.97 | 0.18 | 0.14 | 0.34 |
| 8 | 2.74 | -0.72 | -1.68 | -0.59 | -0.42 | -0.13 |
| 9 | 2.34 | -0.85 | -1.42 | -0.67 | -0.43 | -0.21 |
| 10 | 2.35 | -0.13 | -1.43 | 0.1 | -1.26 | -0.07 |
| Azacitidine | 0.37 | -2.17 | -3.48 | -2.98 | -2.72 | -2.2 |
| Decitabine | 0.58 | -1.89 | -2.46 | -2.2 | -1.84 | -1.56 |
Table 4: Lipophilicity of the proposed compounds (Table 2) in comparison with the commercial ones.
Water Solubility
For handling and formulation of drugs it should be a soluble molecule [25]. Moreover, for oral administration, solubility plays a major property in absorption rate [26]. For delivering a sufficient quantity of a drug in a small volume, drug should be highly soluble [27]. Two topological methods are used for the prediction of Water Solubility the first one is ESOL model [28] and other one is Ali et al. [29] solubility is provided in term of mol/l and mg/ml. Results are cited in table 5 compared with marketized drug it shows that compound 9 shows better result.
| S.No. | logS (ESOL) |
Solubil-ity | Class | logS (Ali) |
Solubility | Class | logS (SILICOS-IT) |
Solubility | Class |
|---|---|---|---|---|---|---|---|---|---|
| 1 | -2.25 | 2.27E+00mg/ml; 5.59E-03 mol/l | Soluble | -2.22 | 2.45E+00 mg/ml; 6.04E-03 mol/l |
Soluble | -3.84 | 5.90E-02mg/ml; 1.46E-04 mol/l |
Soluble |
| 2 | -2.4 | 1.59E+00mg/ml; 3.94E-03 mol/l |
Soluble | -2.5 | 1.29E+00 mg/ml; 3.19E-03 mol/l |
Soluble | -3.6 | 1.01E-01 mg/ml; 2.50E-04 Mol/l |
Soluble |
| 3 | -2.69 | 8.17E-01 mg/ml; 2.02E-03 mol/l |
Soluble | -2.97 | 4.36E-01 mg/ml; 1.08E-03 mol/l |
Soluble | -3.82 | 6.09E-02 mg/ml; 1.51E-04 mol/l |
Soluble |
| 4 | -2.16 | 2.78E+00 mg/ml; 6.90E-03 mol/l |
Soluble | -1.99 | 4.16E+00 mg/ml; 1.03-02 mol/l |
Very Soluble | -4.05 | 3.59E-02 mg/ml; 8.89E-05 mol/l |
Moderately Soluble |
| 5 | -2.46 | 1.38E+00 mg/ml; 3.44E-03 mol/l |
Soluble | -2.51 | 1.23E+00 mg/ml; 3.07E-03mol/l |
Soluble | -3.82 | 6.13E-02 mg/ml; 1.53E-04 mol/l |
Soluble |
| 6 | -1.38 | 1.63E+01 mg/ml; 4.21E-02 mol/l |
Very Soluble | -0.59 | 9.98E+01 mg/ml; 2.58E-01 mol/l |
Very Soluble | -4.01 | 3.80E-02 mg/ml; 9.84E-05 mol/l |
Moderately Soluble |
| 7 | -2.25 | 2.27E+00 mg/ml; 5.59E-03 mol/l | Soluble | -2.15 | 2.88E+00 mg/ml; 7.08E-03 mol/l |
Soluble | -3.52 | 1.21E-01 mg/ml; 2.99E-04 mol/l |
Soluble |
| 8 | -1.65 | 8.76E+00mg/ml; 2.24E-02 mol/l |
Very Soluble | -0.98 | 4.07E+01 mg/ml; 1.04E-01 mol/l |
Very Soluble | -3.17 | 2.65E-01 mg/ml; 6.78E-04 mol/l |
Soluble |
| 9 | -1.55 | 1.08E+01 mg/ml; 2.79E-02 mol/l |
Very Soluble | -0.85 | 5.52E+01 mg/ml; 1.42E-01 mol/l |
very Soluble | -3.15 | 2.74E-01 mg/ml; 7.05E-04 mol/l |
Soluble |
| 10 | -2.1 | 3.23E+00 mg/ml; 8.02E-03 mol/l |
Soluble | -1.4 | 1.60E+01 mg/ml; 3.98E-02 mol/l |
Very Soluble | -3.5 | 1.26E-01 mg/ml; 3.13E-04 mol/l |
Soluble |
| Azacitidine | 0.03 | 2.62E+02 mg/ml; 1.08E+00 mol/l |
Highly Soluble | 0.10 | 3.08E+02 mg/ml; 1.27E+00 mol/l |
Highly Soluble | 0.84 | 1.69E+03 mg/ml; 6.98E+00 mol/l |
Soluble |
| Decitabine | -0.21 | 1.41E+02 mg/ml; 6.17E-01 mol/l |
Very Soluble | -0.18 | 1.50E+02 mg/ml; 6.56E-01 mol/l |
Very Soluble | 0.58 | 8.60E +02 mg/ml; 3.77E+00 mol/l |
Soluble |
Table 5: Water solubility of the proposed compounds (Table 2) in comparison with the commercial ones.
Pharmacokinetics
Pharmacokinetics, evaluate ADME behaviours of the compound on the basis of model. Multiple linear regression, aims in the prediction of skin permeability coefficient (Kp) which is adapted from the Potts and Guy [30], they also found Kp in linear correlation with lipophilicity and molecular size. Passive human gastrointestinal absorption and blood-brain barrier permeation were predicted with the help of BOILED-Egg model [31]. P450 (CYP) isoenzymes play a key role in drug elimination through metabolic biotransformation [32]. About 50% to 90% of the therapeutic molecules are substrate of five major isoforms (CYP1A2, CYP2C19, CYP2C9, CYP2D6, CYP3A4) [33] [34]. One of the major cause of pharmacokinetics-related drug-drug interactions is isoenzymes inhibition [35] [36]. All the predicted compounds show high GI absorption along with presence of Pgp substrate in comparison with the market drugs that have low absorption rate with absence of Pgp substrate as cited in table 6.
| S.no | GI absorption | BBB permeant | Pgp substrate | CYP1A2 inhibitor | CYP2C19 inhibitor | CYP2C9 inhibitor | CYP2D6 inhibitor | CYP3A4 inhibitor | log Kp (cm/s) |
|---|---|---|---|---|---|---|---|---|---|
| 1 | High | No | Yes | No | No | No | No | No | -8.71 |
| 2 | High | No | Yes | No | No | No | No | No | -8.51 |
| 3 | High | No | Yes | No | No | No | No | No | -8.19 |
| 4 | High | No | Yes | No | No | No | No | No | -8.86 |
| 5 | High | No | Yes | No | No | No | No | No | -8.49 |
| 6 | High | No | Yes | No | No | No | No | No | -9.52 |
| 7 | High | No | Yes | No | No | No | No | No | -8.72 |
| 8 | High | No | Yes | No | No | No | No | No | -9.19 |
| 9 | High | No | Yes | No | No | No | No | No | -9.27 |
| 10 | High | No | Yes | No | No | No | No | No | -8.85 |
| Azacitidine | Low | No | No | No | No | No | No | No | -9.33 |
| Decitabine | Low | No | No | No | No | No | No | No | -9.03 |
Table 6: Pharmacokinetics of the proposed compounds (Table 2) in comparison with the commercial ones
Drug-likeness
Drug likeness refers to orally active compounds. SwissADME provides five different rule-based filters, first one is Lipinski filter [37], second one is the Ghose, third one is Veber, fourth one is Egan and last rule is Muegge [38–41]. All the compounds obey Lipinski rules with 0 violations whereas compound 5 obey Ghose , all the compounds obey Veber, Egan, Muegge with 0 violation whereas azacitidine violates rule with one violation cited in table 7.
| S.no | Lipinski #violations | Ghose #violations | Veber #violations | Egan #violations | Muegge #violations | Bioavailability Score |
|---|---|---|---|---|---|---|
| 1 | 0 | 1 | 0 | 0 | 0 | 0.55 |
| 2 | 0 | 1 | 0 | 0 | 0 | 0.55 |
| 3 | 0 | 1 | 0 | 0 | 0 | 0.55 |
| 4 | 0 | 1 | 0 | 0 | 0 | 0.55 |
| 5 | 0 | 0 | 0 | 0 | 0 | 0.55 |
| 6 | 0 | 1 | 0 | 0 | 0 | 0.55 |
| 7 | 0 | 1 | 0 | 0 | 0 | 0.55 |
| 8 | 0 | 1 | 0 | 0 | 0 | 0.55 |
| 9 | 0 | 1 | 0 | 0 | 0 | 0.55 |
| 10 | 0 | 1 | 0 | 0 | 0 | 0.55 |
| Azacitidine | 0 | 1 | 1 | 1 | 1 | 0.55 |
| Decitabine | 0 | 1 | 0 | 0 | 0 | 0.55 |
Table 7: Drug likeness of the proposed compounds (Table 2) in comparison with the commercial ones.
Medicinal Chemistry
In medicinal chemistry potentially problematic fragments were identified, Two complementary pattern recognition methods has been used. PAINS are those molecules that contains substructures display potent response in assays irrespective of the protein target [42] in six orthogonal assays analysis. Synthetic accessibility (SA) is an important factor that is consider in this selection process. Synthetic accessibility score ranges from 1- 10 that is from very easy to very difficult. Results are cited in table 8.
| Compound | PAINS #alerts | Brenk #alerts | Leadlikeness #violations | Synthetic Accessibility |
|---|---|---|---|---|
| 1 | 0 | 0 | 1 | 5.08 |
| 2 | 0 | 0 | 1 | 5.19 |
| 3 | 0 | 0 | 1 | 5.03 |
| 4 | 0 | 1 | 1 | 5.13 |
| 5 | 0 | 1 | 1 | 5.13 |
| 6 | 0 | 1 | 1 | 5.07 |
| 7 | 0 | 0 | 1 | 5.09 |
| 8 | 0 | 0 | 1 | 4.95 |
| 9 | 0 | 0 | 1 | 4.93 |
| 10 | 0 | 1 | 1 | 5.24 |
| Azacitidine | 0 | 0 | 1 | 3.77 |
| Decitabine | 0 | 0 | 1 | 3.46 |
Table 8: Medicinal Chemistry of the proposed compounds (Table 2) in comparison with the commercial ones.
Toxicity
ProTox webserver is used for the prediction of toxicity. Toxicity of predicted compounds along with drug are cited in table 9. Endpoints toxicity is calculated which include hepatotoxicity, cytotoxicity, carcinogenicity, mutagenicity, immunotoxicity. Hepatotoxicity is a main cause for pull out of drug as it cause liver failure [43]. Prediction data of DILI extracted from DILIrank [44] and NIH LiverTox database [45]. Carcinogenicity refers as induced tumor due to chemicals in cell [46]. Carcinogenic Potency Database (CPDB) [47] and CEBS database [48] are used for prediction of data. Mutagenicity is changes in DNA of cell due to chemicals and responsible for abnormal genetic mutations [49] Ames test [50] and CEBS database [48] are used for prediction. Cytotoxicity can cause undesired cell damage and desired damage, which results in tumour cells [51]. Chemical European Biology Laboratory database is used for prediction [52]. Immunotoxicity may have adverse effect on the immune system due to xenobiotics [53]. Hepatotoxicity, cytotoxicity, carcinogenicity, mutagenicity, immunotoxicity of predicted compound are cited in table 10 with reference with commercial drug. Azacytidine and decitabine shows hepatotoxicity and carcinogenicity as shown in table 9.
| Compound | Hepatotoxicity | Carcinogenicity | Immunotoxicity | Mutagenicity | Cytotoxicity |
|---|---|---|---|---|---|
| 1 | Inactive | Inactive | Inactive | Inactive | Inactive |
| 2 | Inactive | Inactive | Active | Inactive | Inactive |
| 3 | Inactive | Inactive | Inactive | Inactive | Inactive |
| 4 | Inactive | Inactive | Inactive | Inactive | Inactive |
| 5 | Inactive | Inactive | Inactive | Inactive | Inactive |
| 6 | Inactive | Inactive | Inactive | Inactive | Inactive |
| 7 | Inactive | Inactive | Inactive | Inactive | Inactive |
| 8 | Inactive | Inactive | Inactive | Inactive | Inactive |
| 9 | Inactive | Inactive | Inactive | Inactive | Inactive |
| 10 | Inactive | Inactive | Inactive | Inactive | Inactive |
| Azacitidine | Active | Active | Inactive | Active | Inactive |
| Decitabine | Active | Active | Inactive | Inactive | Inactive |
Table 9: Toxicity of the predicted compounds in comparison with the commercial ones.
| Compound | Total Interaction energy | H- bond energy | No. of H- bonds | H- bonds | H- bond length(Å) | Mole dock score | Internal energy of pose |
|---|---|---|---|---|---|---|---|
| 1 | -147.975 | -9.64 | 6 | N(19) - Thr(828) O(22) - Arg(619) N(26) - Arg(619) N(15) - Asn(577) N(15) - Asn(577) N(15) - Arg(576) | 2.58 2.86 2.60 3.16 3.29 2.95 | -170.83 | -22.858 |
| 2 | -151.534 | -6.83 | 4 | N(19) - Asp(60) N(19) - Gln(647) O(12) - Arg(618) N(26) - Asn(61) | 2.58 2.86 3.25 3.04 | -167.31 | -15.776 |
| 3 | -153.758 | -12.21 | 8 | N(3) - Arg(644) N(13) - Arg(618) O(12) - Thr(828) N(13) - Thr(828) N(15) - Arg(619) N(26) - Asn(577) N(26) - Asn(577) N(26) - Arg(576) |
2.79 3.57 2.54 3.14 3.38 3.33 2.94 3.35 | -169.42 | -15.661 |
| 4 | -149.883 | -5.08 | 3 | N(27) - Glu(57) N(3) - Arg(618) N(15) - Arg(644) | 2.76 2.79 3.14 | -165.89 | -16.011 |
| 5 | -151.555 | -13.58 | 6 | O(25) - Arg(618) N(22) - Thr(828) N(20) - Arg(619) N(15) - Asn(577) N(15) - Asn(577) N(15) - Arg(576) |
2.92 2.60 2.60 3.35 3.16 3.00 | -169.09 | -17.531 |
| 6 | -140.6 | -15.68 | 9 | O(12) - Arg(618) O(12) - Arg(618) N(3) - Arg(644) N(27) - Asp(60) N(22) - Arg(618) N(20) - Arg(576) N(20) - Asn(577) N(20) - Asn(577) N(15) - Arg(619) |
3.00 3.50 2.86 3.10 3.07 2.84 3.13 3.10 3.55 | -159.16 | -18.557 |
| 7 | -150.499 | -12.86 | 8 | O(19) - Arg(618) N(13) - Thr(828) N(13) - Arg(618) O(12) - Thr(828) N(15) - Arg(619) O(19) - Arg(618) O(22) - Glu(57) N(26) - Arg(576) |
3.10 3.10 3.23 2.53 3.20 3.44 3.59 2.96 | -168.10 | -17.601 |
| 8 | -150.995 | -4.82 | 4 | N(15) - Arg(644) O(6) - Arg(618) O(6) - Arg(618) N(3) - Arg(618) | 3.40 3.36 3.50 2.80 | -164.62 | -13.622 |
| 9 | -151.603 | -19.29 | 10 | O(22) - Arg(618) O(22) - Arg(618) N(3) - Arg(644) O(12) - Arg(618) O(19) - Thr(828) N(26) - Arg(619) N(13) - Asn(577) N(15) - Asn(577) N(15) - Arg(576) N(15) - Asn(577) |
3.24 3.24 3.08 2.89 2.95 2.98 3.40 3.10 2.78 3.05 | -162.87 | -11.265 |
| 10 | -151.540 | -15.79 | 9 | O(12) - Arg(618) N(3) - Thr(828) O(19) - Thr(828) N(24) - Asp(54) N(26) - Arg(619) N(13) - Asn(577) N(15) - Asn(577) N(15) - Arg(576) N(15) - Asn(577) |
3.04 3.34 3.10 2.81 3.09 3.22 3.39 2.60 3.11 | -165.73 | -14.192 |
| AZACITIDINE | -107.256 | -16.891 | 9 | N(14) - Asp(60) N(14) - Glu(57) N(12) - Arg(618) O(13) - Arg(618) O(15) - Arg(618) O(15) - Arg(618) O(7) - Arg(618) O(7) - Arg(619) O(16) - Asp(54) |
2.99 3.10 2.53 3.39 3.14 3.45 2.60 2.60 2.60 | -94.569 | 12.6877 |
| DECITABINE | -108.152 | -20.953 | 10 | O(14) - Arg(619) O(14) - Arg(618) O(15) - Arg(618) O(15) - Arg(576) O(0) - Thr(828) N(7) - Glu(57) N(12) - Glu(57) N(12) - Asp(60) N(10) - Arg(618) O(11) - Arg(618) |
2.60 2.71 2.83 2.67 3.30 3.42 3.10 2.68 2.60 2.16 |
-96.455 | 11.6974 |
Table 10: Docking results of predicted compounds (Table 2) with reference to the active drugs available in the market. Energy values are in kCal/mol.
Conclusion
Some new molecules of DNA methyltransferase inhibitors have been proposed in table 2 having higher potency. Docking results of predicted compounds are comparable with commercial drugs as there is similarity in the binding patterns of the commercial drugs and proposed compounds, which shows the structural based similarity between them. ADME properties of the molecules was done by ProTox method. It is comparatively better than commercially available software like BioVia [54]. ADMET properties of predicted compounds are better in compression to the commercial drug as well as toxicity of predicted compounds are least or non-toxic as compared to licensed drugs. Synthetic accessibility of compounds is moderate, so they can be synthesized and tested in wetlab.
Conflicts of Interest
The author declared that, having no conflict of interests
Acknowledgements
The authors are thankful to the Meerut Institute of Engineering and Technology for providing the infrastructure and support for completion of this project. This work was also supported by the Molexus. Our profound gratitude is expressed to Mr. René Thomsen for providing the academic License of MVD software used for Docking. We acknowledge ChemAxon Ltd. (www.chemaxon.com) for the academic license agreement. ADMET properties were studied by the help of SwissADME and ProTox-ll.
References
- JS You and PA Jones. Cancer Cell. 2012, 22: p.9-20.
- RZ Jurkowska, TP Jurkowski and A Jeltsch. Chem Bio Chem. 2011, 12: p. 206-22.
- JR Davie and MJ Hendzel. J Cell Biochem. 1994, 55: p. 98-105.
- H Heyn and M Esteller. Nat Rev Genet.2012, 13: p. 679-92.
- M Esteller.Nat Rev Genet. 2007, 8: p. 286-98.
- MV Iorio, C Piovan, CM Croce. Biochim Biophys Acta. 2010, 1799: p. 694-701.
- S Ito,L Shen, Q Dai et al., Science. 2011, 333: p. 1300-3.
- S Seisenberger, JR Peat, TAHore et al., Philos Trans R Soc Lond B Biol Sci. 2013, 368: p. 20110330.
- M Rius and F Lyko. Oncogene. 2012, 31: p. 4257-65.
- SylwiaFlis; Ph.D., Department of Pharmacology, National Medicines Institute.
- L Isakovic, O Saavedra, M Llewellyn et al., Bioorg Med Chem Letters. 2009, 19(10): p. 2742–2746.
- J Dong, D Cao,H Miao et al., J Chem Inform. 7(1).
- http://doi.org/10.2210/pdb3PTA/pdb
- http://www.swissadme.ch/help.php
- A Daina, O Michielin and V Zoete. Scientific Reports. 2017, 7(1).
- AB Raies and VB Bajic.Wiley Interdiscip. Rev. Comput Mol Sci. 2016, 6: p. 147–172.
- J Bajorath. Nature Rev. Drug Discov. 2002, 1: p. 882–894.
- WP Walters, MT Stahl and MA Murcko.Drug Discov. Today. 1998 3: p. 160–178.
- T Langer and RD Hoffmann. Curr Pharm Design. 2001, 7: p. 509–527.
- T Cheng. J Chem Inf Model. 2007, 47: p. 2140–2148.
- SA Wildman and GM Crippen. J Chem Inf Model. 1999, 39: p. 868–873.
- I Moriguchi, H Shuichi, Q Liu. Chem Pharm Bull. 1992, 40: p. 127–130.
- I Moriguchi, H Shuichi, I Nakagome et al., Chem Pharm Bull. 1994, 42: p. 976–978.
- http://silicos-it. be.s3-website-eu-west-1.amazonaws.com/software/filter-it/1.0.2/filter-it.html, accessed June 2016.
- TJ Ritchie, SJF Macdonald, S Peace et al., Med Chem Commun. 2013, 4: p. 673.
- G Ottaviani. Eur J Pharm Sci. 2010, 41: p. 452–457.
- KT Savjani, AK Gajjar, and JK Savjani. ISRN Pharm. 2012,p. 195727.
- JS Delaney. J. Chem. Inf. Model. 2004, 44: p. 1000–1005.
- J Ali, PCamilleri, MB Brown et al., J. Chem. Inf. Model. 2012, 52: p. 420–428.
- RO Potts and RH Guy.Pharm. Res. 1992, 09: p. 663–669.
- A Daina and VA Zoete.ChemMedChem.2016, 11: p. 1117–1121.
- B Testa and SD Kraemer. Chem Biodivers. 2007.
- CR Wolf, G Smith and RL Smith. British Med J. 2000.
- L Di. Drug MetabToxicol. 2014,10: p. 379–393.
- PF Hollenberg. Drug Metab. Rev. 2002, 34: p. 17–35.
- S Huang. J Clin Pharmacol.2008, 48: p. 662–670.
- CA Lipinski, F Lombardo, BW Dominy et al., Adv Drug Deliv. 2001, 46: p. 3–26.
- AK Ghose, VNViswanadhan and JJ Wendoloski. J Comb Chem. 1999, 1: p. 55–68.
- DF Veber. J. Med. Chem. 2002, 45: p. 2615–2623.
- WJ Egan, KM Merz and JJ Baldwin. J Med Chem. 2000, 43: p. 3867–3877.
- I Muegge, SL Heald and D Brittelli. J Med Chem. 2001, 44: p. 1841–1846.
- JB Baell and GA Holloway. J Med Chem. 2010, 53: p. 2719–2740.
- VB Siramshetty, J Nickel, C Omieczynski. Nucleic Acids Res. 44: p. 1080–1086.
- M Chen,ASuzuki, S Thakkar et al., Drug Discov. Today, 21: p. 648–653.
- S Thakkar, M Chen, H Fang et al., Gastroenterol Hepatol., 12: p. 31–38.
- R Kroes, AG Renwick, M Cheeseman et al., Food Chem. Toxicol., 42: p. 65–83.
- RB Fitzpatrick, Med Ref Serv. 2008, 27: p. 303–311.
- IA Lea, H Gong, A aleja. Nucleic Acids Res. 2017, 45: p. D964–D971.
- BN Ames, WE Durston, E Yamasaki., Proc Natl Acad Sci USA. 1973, 70: p. 2281–2285.
- K Hansen, S Mika, T Schroeter. J Chem Inform Model. 2009, 49: p. 2077–2081.
- L Zhang, CM Mchale, N Greene. 2014, 55: p. 679–688.
- AP Bento,AGaulton, A Hersey et al., Nucleic Acids Res. 2014, 42: p. 1–8.
- AK Schrey, J Nickel-Seeber, MN Drwal, et al., Food Chem Toxicol. 2017, 107: p. 150–166.
- P Banerjee, AO Eckert, AKSchrey., Nucleic Acids Research. 2018, 46: p. 257–263.


